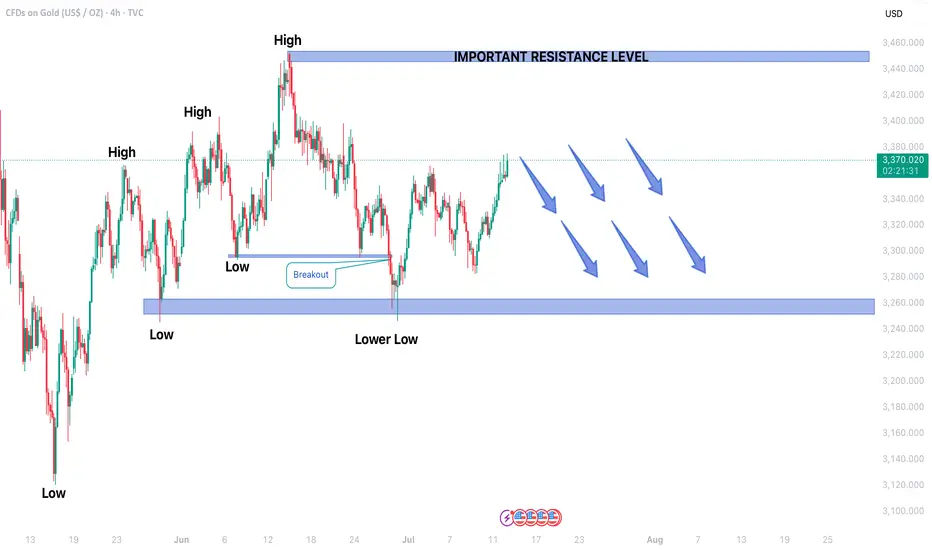
GOLD TRADING IN BEARISH TREND IN 4H TIME FRAMEGold price forming Lower lows which indicated Bearish trend movement.
Price is currently moving in Secondary Trend.
In upcoming sessions secondary trend may end and price may start forming Primary trend.
After a candlestick reversal pattern, Gold may continue to fall.
Price may hit the support level of 3250$ in upcoming sessions.
On higher side 3450$ may act as an important resistance level.
XAUUSDK trade ideas
As risk aversion wavers, will gold rise or fall?
💡Message Strategy
After falling for two consecutive days, gold (XAU/USD) rebounded slightly in the Asian session on Wednesday, stabilizing above $3,320, attracting some bargain-hunting buyers. The market has paid close attention to the tariff policy that US President Trump continues to increase, and the rising risk aversion has become the core factor supporting gold prices.
The US CPI data for June showed that overall prices rose by 0.3% month-on-month, the largest increase in five months, and the core CPI rose to 2.9% year-on-year, both higher than expected. This has caused the market to worry that tariffs are gradually pushing up inflation, prompting the Federal Reserve to extend the high interest rate policy cycle.
📊Technical aspects
The current trend of gold is constrained by both fundamentals and technical factors.
On the one hand, Trump's tariff policy has pushed up inflation expectations, triggering risk aversion and rethinking of the Fed's policy path, providing support for gold;
On the other hand, the Fed's tone of "maintaining high interest rates for longer" has limited the room for gold prices to rebound.
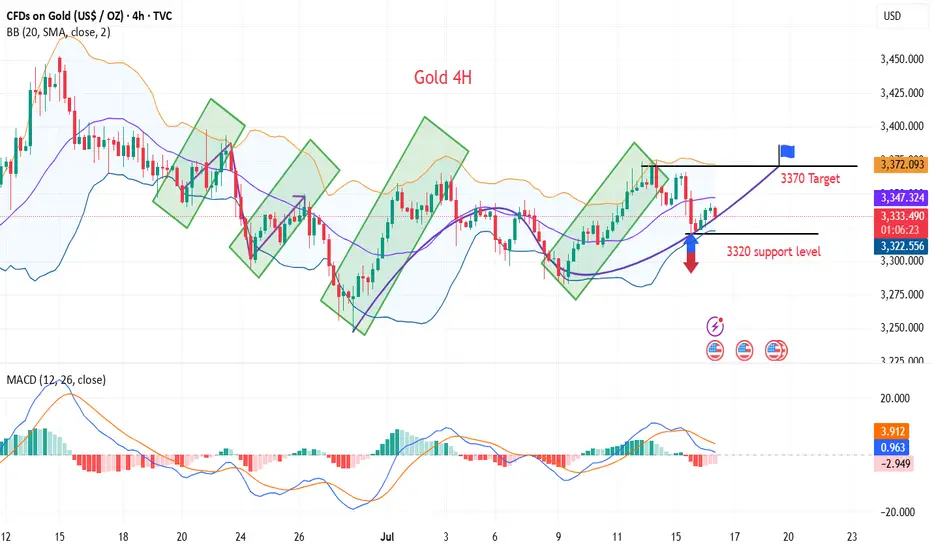
From the 4-hour chart, gold prices found support near the 100-period SMA (about $3,320) on Tuesday, stopping the decline from the three-week high. In the short term, if it can stand above the 3340-3345 resistance band, it may test the 3365-3370 area again, and the further target is the 3400-dollar round mark.
💰Strategy Package
Long Position:3320-3330,SL:3305,Target: 3365-3370
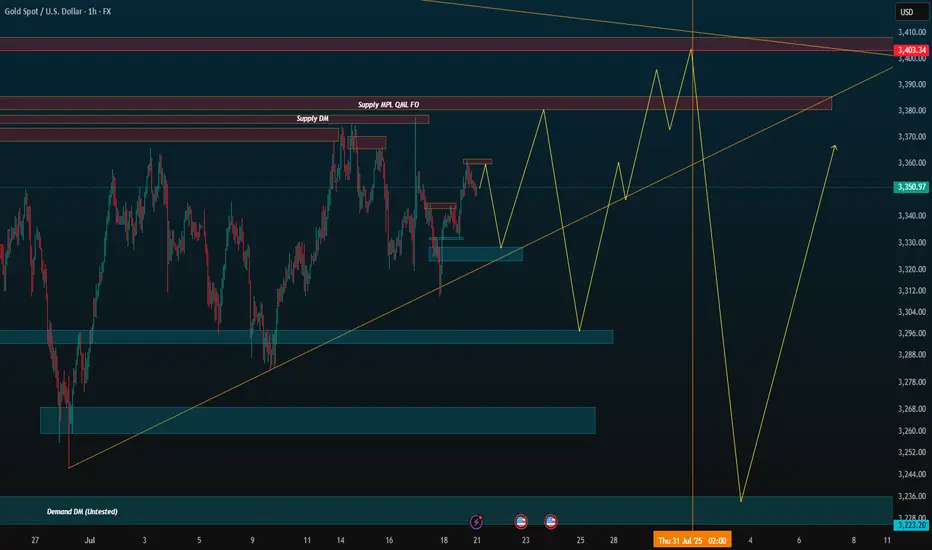
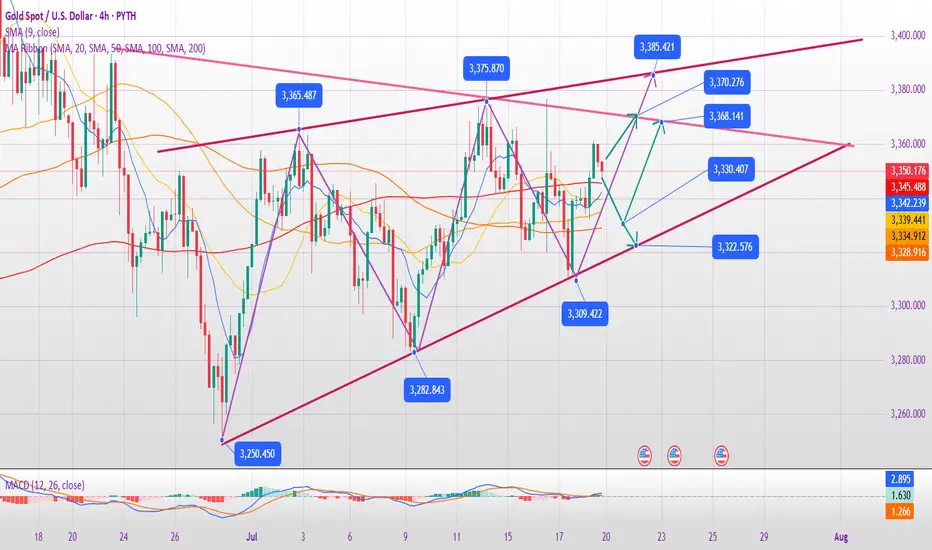
Pure Speculation Mode (FOMC + NFP)This is just pure speculation projection I made. Just ignore, I wanna save this and compare before and after next month.
XAUUSD 1H | Bullish BOS & OB Retest | Targeting 3390+🚀 Gold (XAUUSD) 1H Timeframe is showing a clean Bullish Market Structure with multiple Breaks of Structure (BOS ↑) confirming upside momentum.
🔹 Price retraced back into a strong Demand Zone (OB) and has started pushing upward again, indicating strong buyer interest.
🔹 Clear Order Block Retest after BOS confirms Smart Money Entry.
🔹 Target is marked around 3390+, based on previous liquidity and imbalance zones.
📈 Expecting continuation of bullish trend until the marked Target Point is reached.
💡 This setup follows pure SMC principles: BOS → OB Retest → Expansion.
🟢 Buy Bias Active | 📊 High Probability Trade Setup
#XAUUSD #Gold #SMC #BreakOfStructure #OrderBlock #LiquidityGrab #TrustTechnicallyAnalysis

Gold Aiming Higher: Bullish Momentum Toward Key S&D ZoneHello guys!
The main bullish trend remains intact on Gold. After forming a solid base near the QML level, price has been respecting the ascending channel structure and is now pushing toward the upper boundary of that channel.
The current price action shows strength and momentum, and with the recent breakout above the midline of the channel, it signals that buyers are likely to push price toward the next key area of interest.
The target is clearly defined: the supply zone around 3409–3423, which has previously acted as a major resistance area.
Core idea:
Main trend: Bullish
Structure: Ascending channel
Support confirmed: QML zone bounce
Current behavior: Price moving along the top of the channel
Target: 3409–3423 supply zone

Gold on high time frame
"Hello traders, focusing on gold, the price recently swept liquidity around $3,250 and displayed strong signals indicating a potential upward movement. The next target could be around $3,400."
If you need further clarification or have more details to discuss, feel free to share!

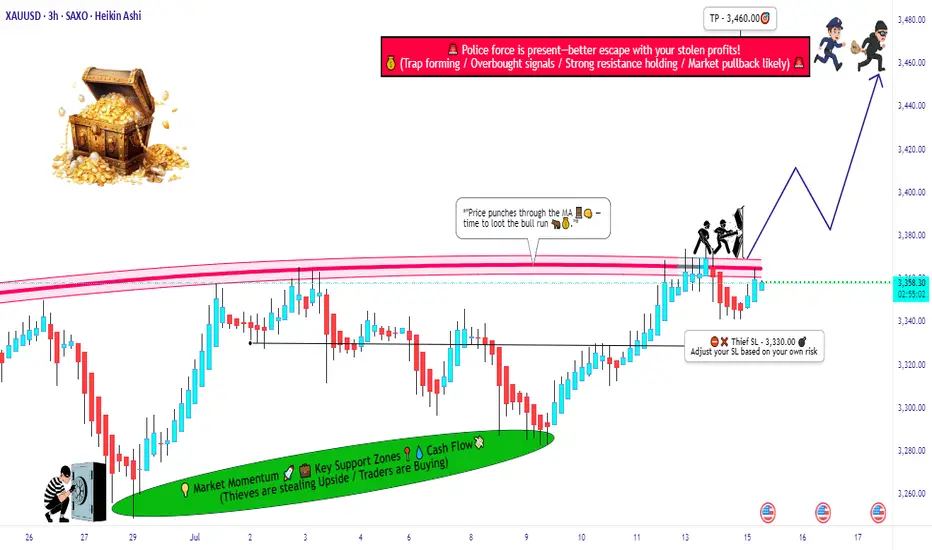
GOLD (XAU/USD) MA Breakout – High-Probability Long Setup!💰🚨 GOLD HEIST ALERT! XAU/USD MASTER PLAN (Thief Trading Style) 🎯
🔥 Steal Pips Like a Pro – High-Probability Gold Breakout Strategy! 🔥
🎯 Thief Trading’s GOLD Heist Strategy (Swing/Day Trade) �💸
👋 Hey there, Market Pirates & Profit Snatchers! 🌍✨
Based on our 🔥Thief Trading Style🔥 analysis, we’re plotting a major heist on XAU/USD (GOLD). The plan? Buy the breakout, escape before the cops (resistance) arrive! 🚔💨
📈 ENTRY ZONE: The Heist Begins!
🚀 "Wait for the MA Breakout (3400) – Then Strike!"
Bullish Confirmation: Enter on a 15M/30M pullback after MA breakout.
Thief’s Trick: Use Buy Stop above MA or Buy Limit near swing lows for best risk-reward.
DCA/Layering Strategy: Deploy multiple limit orders to maximize gains.
🔔 Set an ALERT! Don’t miss the breakout – thieves move fast! ⏳
🛑 STOP LOSS: Protect Your Loot!
📍 Thief’s SL Placement: 3330.00 (4H Swing Low) – Adjust based on your risk & lot size.
⚠️ WARNING: If using Buy Stop, DO NOT set SL until after breakout – unless you love unnecessary losses! 🔥
🎯 TARGET: Escape with the Gold!
🏴☠️ Take Profit Zone: 3460.00 (or Exit Early if Bears Show Up!)
Scalpers: Only trade LONG side – use trailing SL to lock in profits.
Swing Traders: Ride the wave but watch for resistance traps!
📰 MARKET CONTEXT: Why This Heist?
Neutral Trend (But Bullish Potential! 🐂)
Key Factors: Geopolitics, COT Data, Macro Trends, Sentiment Shift
🚨 News Alert: Avoid new trades during high-impact news – trailing SL saves profits!
💥 BOOST THIS HEIST! (Like & Share for More Pips!)
💖 Hit the 👍 Boost Button to strengthen our Thief Trading Crew!
🚀 More Heist Plans Coming Soon – Stay Tuned!
⚠️ DISCLAIMER (Stay Safe, Thieves!)
This is NOT financial advice. Do your own analysis & manage risk.
Markets change fast! Adapt or get caught.
🎯 Happy Trading, Pirates! Let’s Steal Some Gold! 🏴☠️💛
XAUUSD buy Idea!Xauusd has printed its low in the past week and currently looking for a high nearing 3400 region. 3400 could be a very important rejection or breakout zone.

GOLD to the MoonHiper Clear Structure and the beginning of a new impulse towards 3.600 and 3.700
Hope everybody had a chance to got in
gg

Analysis and strategy of gold trend on July 21:
In-depth analysis of gold market and precise trading strategy
Analysis of core contradictions
Game of long and short forces:
Short forces: Strong economic data (retail sales +0.6%, unemployment benefits 221,000) pushed the US dollar index to 98.95, and the US Treasury yield rose to 4.495%
Bull forces: The safe-haven buying caused by inflation expectations formed a strong takeover, and the 3300 mark showed strong support
Market signal interpretation:
The deep V reversal shows the characteristics of "false breakthrough", and smart funds take the opportunity to absorb funds
The negative correlation between US Treasury yields and gold has temporarily failed, reflecting the market's confusion about the Fed's policy expectations
Technical three-dimensional analysis
Daily level:
MACD double-line golden cross, the upward momentum column is mildly increased
KDJ golden cross runs above 60, not entering the overbought area
Key watershed: 3320 (bullish defense line) vs 3375 (previous high resistance)
4-hour level:
The rising channel is complete, and the low point gradually moves up (3309→3320)
The angle after the KDJ golden cross is steep, indicating sufficient short-term momentum
30-minute short-term:
3350 constitutes the intraday long-short balance point
If the Asian session falls and the callback does not fall below 3342, the strong structure will be maintained
Precise trading strategy
Main long plan:
Ideal entry: 3332-3335 (Fibonacci 38.2% retracement level)
Defense point: 3318 (Daily EMA30 support)
Target ladder: 3355 (Start reducing positions and take profits) → 3372 (stop profit 50%) → 3398 (trend target)
Secondary short opportunity:
Trigger condition: first touch 3373 + shooting star pattern
Stop loss setting: 3383 (previous high + 3 US dollars to filter false breakthroughs)
Profit space: 3350-3340 (quick in and quick out)
Breakthrough trading strategy:
Break above 3380: chase longs when stepping back to 3370, target 3400 integer level
Break below 3315: short when the price rebounds to 3325, target 3290 support
Key price matrix
Support level 3330 long-short boundary
Support level 3310 trend lifeline
Resistance level 3365 previous day high
Resistance level 3375 weekly level strong resistance
Special tips for risk management:
Position control: single transaction does not exceed 3% of the principal
Time window: US market volatility is usually magnified by 30%
Emergency warning:
Speech by Fed officials may trigger a $50 fluctuation
The escalation of geopolitical conflicts in the Middle East will trigger safe-haven buying
Operational suggestions: The current market is in a key direction selection window, and it is recommended to adopt a combination strategy of "breakthrough follow + callback buy". Focus on the breakthrough of the 3365-3375 area during the US trading period. If three consecutive 15-minute K-lines stand at 3370, the upward space will be opened. Conservative investors can wait for a pullback to the 3330-3335 area to arrange mid-term long positions.
Buy Opp!Hello all. after missing my last idea (I explain the reason on that idea), price is ready to makes a new Higher High. be happy and have a great day. be aware about 16 UTC or times around that. (wink)

XAU/USD Analysis – Wave 2 Still in ProgressOANDA:XAUUSD
We're currently in a corrective structure following our Circle Wave 3.
✅ (A) and (B) of the correction are already complete.
🔽 Now we're in the development of Wave (C), which should unfold as a 1–2–3–4–5 structure.
📌 Current Situation
Wave 1 of (C) was very impulsive – a strong move confirming the structure
We're now in Wave 2, which is developing as a classic ABC correction
✅ Circle A and Circle B are complete
🔄 Currently transitioning from Circle B to Circle C
🧠 Market Insight
We’ve already seen the first touch of the Fib zone, but I don’t believe that marks the end of Circle C just yet – the time duration of B → C is too short compared to 1 → A and A → B.
That's why I expect a smaller degree correction playing out now:
→ (A) → (B) → (C) (lower timeframe within Circle C)
Alternatively, the whole 1 → 2 could even unfold as an A–B–C–D–E triangle, though I personally prefer ABC structures for cleaner setups and better trade entries.
📈 Trade Setup
There are two short setups currently marked in the chart:
Sell from small B → small C
🎯 Take-Profit: Aligned with Fib Extension Zone near 3400
🛑 Stop-Loss: Just above the small A
Sell from small C extension move
🛑 Stop-Loss: Below (B)
🎯 Target: Also around the major Fib confluence zone at 3400
📊 Conclusion
✅ Wave (1) done
🔄 Wave (2) still unfolding as complex ABC
⚠️ Be patient for confirmation of small B → C
🟢 Fib zones aligned – volume expected around 3400
🧩 Clean setups preferred over triangle flags

Gold SELL SetupHi everyone
This is our out look for Monday trading day. We have completed a second wave retracement & can sell off from 3354 to 3328 possible.
Always remember to apply proper risk management.
Let us know in the comments what you think of the setup & where you see gold go.

Gold Trading Strategy For Next Week✅ Gold exhibited an irregular box-range consolidation this week, with frequent directional shifts and weak trend continuity. The price tested the 3375 level twice but failed to break through effectively, followed by significant pullbacks each time—indicating clear selling pressure around that area. On the technical side, the Bollinger Bands on both the daily and 4-hour charts have contracted simultaneously, suggesting that gold is currently in a consolidation phase, awaiting a breakout to define the next direction. Overall, gold remains trapped within a broad range, with neither the upside nor downside achieving a decisive breakout. Whether the range will be broken—and in which direction—will likely be determined next week.
✅ On Friday, gold mainly trended higher within a narrow range, in line with previous expectations. During the session, we initiated a short position around 3341–3343, took profit near 3333, and subsequently shifted to a long bias. Gold then climbed to around 3361 before entering a sideways consolidation phase, closing the day near 3350. In the absence of major geopolitical news over the weekend, the bullish momentum is expected to continue into next week.
✅ From a technical perspective, the 4-hour moving average system shows a bullish divergence pattern, supporting the current upward trend. Combined with the continuation of the overnight rebound momentum, gold may target the 3380 level in the coming week. The MACD fast line is turning upward near the high zone and may soon form another bullish crossover. Meanwhile, the shrinking green histogram bars suggest that positive momentum could emerge soon. The KDJ indicator still has room to rise before reaching the overbought zone.
✅ Key short-term support levels lie at 3345 and 3340. As long as this zone holds, it can be considered a valid entry point for long positions. On the upside, attention should be paid to the 3375–3380 resistance range, which aligns with previous highs. A successful breakout above this zone could pave the way for further upside potential.
🔴 Key resistance zone: 3375–3380
🟢 Key support zone: 3340–3345
✅ If the 3340 support holds, consider entering long positions on dips, with a target near 3380. If prices approach 3380 and show signs of losing momentum—such as divergence in indicators—it may be appropriate to consider shorting near the top, and then reassess after a pullback toward support.

GOLD LONG FROM RISING SUPPORT|
✅GOLD is trading in an uptrend
And the bullish bias is confirmed
By the rebound we are seeing
After the price retested the support
So I think the growth will continue
LONG🚀
✅Like and subscribe to never miss a new idea!✅
Disclosure: I am part of Trade Nation's Influencer program and receive a monthly fee for using their TradingView charts in my analysis.


XAU/USD BULLISH SETUPPrice has cleared previous support zone, however we see a retracement into the 30min internal PFL zone where we expect price to bounce back to the higher timeframe bullish momentum as correction has likely ended.

Mapping for week 21-25th july.As per my mapping.
this is the video version of it and hopefully its gonna be helpful for you and me.

3 possible scenarios for next weekI am seeing a potential of sideways market may be present next week due to last friday gold did not mange to close bullish.
The week close as bearish and inside previous week candle.
so whats my plan to trade next week.
Key levels is what I will look for.
key levels as follows.
3400-3500
- 3408
- 3422
- 3445
- 3450
- 3500
3300-3399
- 3301
- 3310
- 3321
- 3328
- 3331
- 3344
- 3347
- 3361
- 3378
- 3393
- 3399
3200-3300
- 3296
- 3287
- 3275
- 3266
- 3256
- 3248
- 3230
- 3218
- 3205
3100-3200
- 3195
- 3188
- 3167
- 3153
- 3120
- 3100
so here it goes when the market reach at certain key levels and provide a reversal or rejections. Then I'll take the 2nd entry as 1st entry is usually higher risk. target only 50-100 pips as potential for it to return to the position again is high as that is shown in last week it kept hitting resistance and support couple of times before breaking either.

GOLD AT CROSSROADS: CAPITALIZING ON MARKET SHIFTS FUNDAMENTAL ANALYSIS
With Gold currently trading at 3357, we're at a pivotal moment. The confluence of heightened geopolitical tensions and recent decisive US government actions – including renewed tariff threats and evolving monetary policy signals – is creating a clear trajectory. Analysis indicates a compelling opportunity to initiate aggressive sell signals, targeting 3345 and then pushing for 3330. Risk is rigorously managed with a disciplined stop loss at 3380. This is a strategic move, designed to profit from the immediate downward pressures stemming from the global political and economic landscape, as the market re-calibrates to these powerful forces."

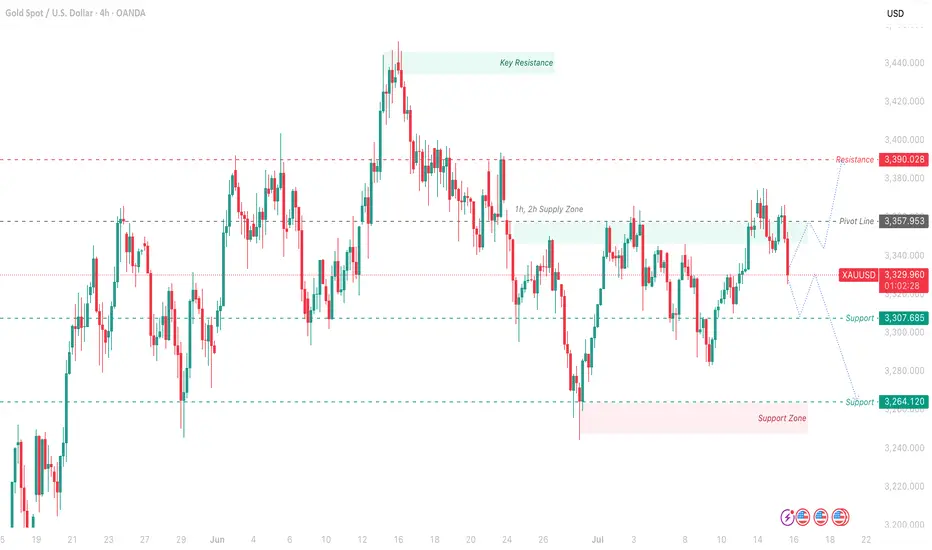
GOLD Outlook – Bearish Confirmed Post-CPIWith the CPI data released at 2.7%, gold’s bearish momentum is confirmed below the Pivot Line of 3,357.953 USD.
The market reaction suggests no immediate Fed rate cuts, supporting downward pressure. Expect a move toward Support at 3,307.665 USD and the Support Zone around 3,264.120 USD. A close above 3,357.953 USD on a 1H or 4H candle could indicate a bullish reversal toward Resistance at 3,390.028 USD.
Trade Setup:
Short Entry: Near 3,357.953 USD with bearish confirmation, Stop Loss above 3,390.028 USD.
Take Profit: Initial target at 3,307.665 USD, with a second target at 3,264.120 USD.
Long Entry: Only if price breaks and holds above 3,357.953 USD, with a Stop Loss below 3,250 USD, targeting 3,390.028 USD.
Pivot Line: 3,357.953 USD
Support: 3,307.685 USD – 3,264.120 USD (Support Zone)
Resistance: 3,390.028 USD – ~3,400 USD (Key Resistance)
1h, 2h Supply Zone: Between 3,357.953 USD and 3,390.028 USD
XAUUSDsell gold for a continuous bearish order flow
Looking a a continuous downside to 3000 till September when rate cut is more probable

Report - 17 jully, 2025Executive Notes – Summary
Tariffs Bring In $50bn+ for U.S.: Global partners mostly restrained; only China and Canada retaliated. EU delays action until Aug 1. → Bullish short-term for USD revenue and equities tied to U.S. industrial base; long-term inflation risk rising.
Trump vs Powell (Fed Chair): Trump floated firing Powell; market volatility followed. Odds hit 40%, fell after walk-back. → Bearish for DXY, bullish for XAUUSD and risk hedges.
China-Japan Espionage Flashpoint: Japanese executive jailed. U.S. and Japanese corporates face higher operational risk. → Negative FDI outlook for China, positive momentum for India, Vietnam.
EU–Mercosur Trade Deal at Risk: France demands safeguards on beef, sugar, poultry. Deal approval hinges on political concessions. → Watch agri-commodities (softs), BRL, and EU agri-lobby impacts.
ASML Profit Warning: Trump tariff fears cloud 2026 chip industry outlook; shares drop 11%. → Bearish on EU semis, capital goods.
Nvidia China Deal Revival: U.S. set to grant export licenses for AI GPUs; H20 shipments may resume. → Bullish for China AI adoption and semis; BABA, BIDU, NVDA in rebound territory.
Goldman & JPM Rally on IB Recovery: M&A/IPO flows return; +26% YoY IB fees. → Signals CEO confidence; bullish for dealmakers and sector ETFs (KCE, XLF).
Subsea Cable Ban on China: FCC to block Chinese tech in U.S.-linked subsea networks. → Signals rising digital Cold War; tech supply chains shifting westward.
Germany’s Allianz CEO Sounds Alarm: Warns of fiscal collapse by 2035 if welfare spending not reformed. → Supports hard-asset thesis; bearish EU fiscal stability perception.
Crypto Week & Stablecoin Push: Cantor-led SPAC to buy $4B BTC; U.S. fast-tracking stablecoin rules. → Bullish BTC, USDT dominance, and crypto-native banking platforms.
Full Strategic Macro & Market Analysis
President Trump’s aggressive tariff policy is achieving both economic and political outcomes ahead of the election: $64 billion in Q2 customs revenues and symbolic victory over hesitant global peers. According to Treasury data, tariffs have surged income by over $47 billion YoY. This influx comes with asymmetric retaliation: only China and Canada have meaningfully responded. The EU, under pressure from France’s agricultural bloc, has paused countermeasures, awaiting August 1 negotiations.
The market's muted reaction reflects the novelty of tariffs being treated as quasi-fiscal tools. Yet, the Yale Budget Lab’s finding of a 20.6% effective average tariff — the highest since 1910 — is an inflationary wildcard. UBS projects that core goods prices may push CPI above 2.3% until 2027 without policy reversal, eroding real incomes and squeezing margins across consumer sectors. As noted by Fed officials like John Williams, tariffs alone are lifting inflation by a full percentage point over the next 12 months.
At the same time, Trump’s remarks about firing Fed Chair Powell jolted Treasury and currency markets. The DXY fell nearly 0.9% intraday, while 2-year U.S. yields dropped to 3.90%, pricing in a potentially more dovish successor. This political volatility amplified market preference for inflation hedges and high-quality equity earnings.
Assets:
XAUUSD (Gold):
Trump’s Fed confrontation, rising CPI prints, and global legal-institutional instability support continued gold upside. Technical momentum remains bullish. If DXY dips below 103 and Powell uncertainty rises, gold could retest $2,450.
S&P 500 & Dow Jones:
Rotation continues. Industrials and financials (e.g., Goldman Sachs, JPMorgan) gain from tariff-driven reshoring and M&A revival. However, semis and global tech face drag from ASML warnings and U.S.–China tech decoupling. Dow holds better given dividend strength, but risk spikes if Powell is removed or tariffs push inflation past 3%.
USDJPY:
USD weakening bias persists on Fed risk, though yen gains are capped by geopolitical risk in Asia (e.g., Chinese jet near Japan, espionage cases) and Japan’s sluggish growth. A move toward 152 is possible if Powell exits or the Fed pivots dovishly.
DXY (Dollar Index):
Trump’s instability narrative, threats to Fed credibility, and rising CPI are weighing on the dollar. Watch for a decisive breakdown below 103, especially if ECB/BoE turn hawkish or U.S. deficit headlines worsen.
Crude Oil (WTI):
Supported by strong commodity complex (steel, copper, aluminum all up), tariffs on inputs, and stable OPEC+. Bullish bias into Q3, with demand steady and risk premia rising from China tensions and Middle East unrest.
Macro Risks
Fed Politicization: Powell’s premature dismissal could unravel market confidence in the U.S. rate regime. Bonds and USD would sell off; capital flight risk rises.
Persistent Inflation: Tariffs risk pushing CPI above 3% in 2025. Long-end yields will respond faster than the Fed.
Tech War Escalation: Subsea cable bans, Huawei exclusion, and AI chip controls could trigger further retaliation from China.
EU-Mercosur Breakdown: French farming veto could stall EU diversification efforts and strengthen protectionist politics in Europe.
Emerging Opportunities
U.S. Banks and Dealmakers: Goldman Sachs and JPMorgan gains point to a rebound in capital markets activity. KCE ETF, GS, and MS are prime exposure vehicles.
AI-Semiconductor Complex (Selective): Nvidia’s China deal reversal allows for a tactical rebound in NVDA, BIDU, BABA, despite broader export controls.
Bitcoin Accumulation Wave: Trump-aligned SPACs (Cantor Equity Partners 1, BSTR Holdings) are spearheading institutional BTC acquisition. Stablecoin legislation expected to favor U.S. dollar dominance.
Dividend-Centric Strategies: Payout increases from industrials (Costamare, ILPT) outnumber dividend cuts. Defensive dividend plays are outperforming growth narratives in volatile macro backdrops.
Possibilities:
XAUUSD (Gold)
Short-Term (1–4 weeks): Likely to stay elevated or push higher amid Fed independence concerns and strong CPI tailwinds. A sustained move above $2,400 opens a path to $2,450–2,480, especially if Powell’s status deteriorates or the DXY breaks 103.
Medium-Term (3–6 months): Remains supported by structural inflation and global de-dollarization themes (e.g., stablecoins, geopolitical risk in Asia, digital infrastructure war). Positioning may increase if the Fed turns more political.
S&P 500
Short-Term: High volatility. Earnings remain solid, especially in financials and industrials, but valuation compression risk persists if long-end rates stay above 5%. Potential 1–2% pullbacks on Powell uncertainty.
Medium-Term: Rotation-led upside possible if Fed stability is restored. But if tariffs worsen CPI and margins compress, we could see a multi-month consolidation. AI and industrial resilience may cap downside.
USDJPY
Short-Term: Expected to test downside near 152. Japanese yen gaining haven demand, and dovish Fed risk undermines USD strength. If risk sentiment worsens (China, Powell), JPY outperforms.
Medium-Term: Neutral-to-bearish. If the Fed resumes cuts or dollar confidence erodes, USDJPY could move sub-150. BOJ remains dovish, limiting gains beyond that.
DXY (US Dollar Index)
Short-Term: Under pressure. If Powell's removal gains traction or more tariffs fuel CPI, DXY may decisively lose 103 support. Temporary rebounds on safe-haven flows possible.
Medium-Term: Bearish bias forming. Stablecoin growth, Trump-led policy volatility, and global diversification efforts (e.g., EU trade deals) weigh on demand for USD assets.
Crude Oil (WTI)
Short-Term: Bullish tone holds. Supply-side support from OPEC+, tariffs lifting input costs, and solid U.S. industrial activity. Potential retest of $85/bbl.
Medium-Term: Risk of higher volatility. If global growth slows (China contraction or Fed missteps), oil could retreat to mid-$70s. But inflationary pressure remains net supportive.
Dow Jones Industrial Average
Short-Term: Outperforming due to resilient bank earnings, dividend momentum, and defensive bias. Likely to remain range-bound with modest upward drift unless Powell is ousted.
Medium-Term: Cautiously bullish. Dividend themes remain strong, and industrials benefit from tariff protection. But inflation and long-duration debt concerns could cap gains.
