Critical moment! Where will gold go?After rebounding for two consecutive days, gold prices consolidated in a narrow range in the Asian market on Wednesday, hovering below a one-week high. Although the US dollar rebounded slightly and the market's improved risk appetite suppressed safe-haven demand, the Fed's interest rate cut expectations and trade uncertainties limited the downside of gold prices. The market is waiting for the upcoming ADP and non-farm data to determine the timing of the Fed's interest rate cut. The key technical resistance is $3,358.
Gold received a positive cross in June. At present, the monthly line has an upper shadow for three consecutive trading months, and the shadow is long, indicating that the upper selling pressure is relatively large; in this way, for the future market, we are more optimistic about the highs and falls. In the recent stage, gold is not interested in US data, but Trump frequently calls for the Fed to cut interest rates, which we still need to pay attention to. The sharp rise in gold in the past two days is not unrelated to the Fed's expectation of a rate cut. On the other hand, it is also related to the market rumor that the US President Trump's tariff deadline on July 9 is also related. If the US dollar index bottoms out and rebounds, ushering in a phased upward trend; then, it is bound to suppress gold.
Short-term resistance is yesterday's high point 3350-3360 area. If it breaks above, it is expected to hit 3375-80, and further 3400 mark; before breaking above 3400 area, there is still a large sweep range. If it goes up, the bulls will have a wave of acceleration, and the upper 3425 and 3450 may even hit the historical high. For the day, the 5-day moving average 3315 area will form a strong support after breaking through. If it rebounds and rushes higher, it cannot break below. Once it breaks below, the market will continue to fall, further 3300~3295, and then 3275 and 3255~45 areas; that is, the rise on Monday and Tuesday means the end of the bulls. Therefore, in terms of operation, the short-term relies on the 3315-3325 area to support low longs, and if it rises, it will continue to short with reference to the resistance area.
XAUUSDK trade ideas

Gold Weekly Summary and Forecast 7/5/2025In my half year review, I expected next half year gold will continue its bullish drive. Overall picture shows a bullish momentum. However, the road is not straight and could be bumpy.
In 2W TF, there is a three drive pattern indicated in the chart with three red arrows. An immediate price drop will follow from this pattern. Therefore, I am expecting the price to drop to 3180 before next take off.
Next week's high is max at 3380 and could drop to 3260. Watch out the daily trading plan for more details next week.

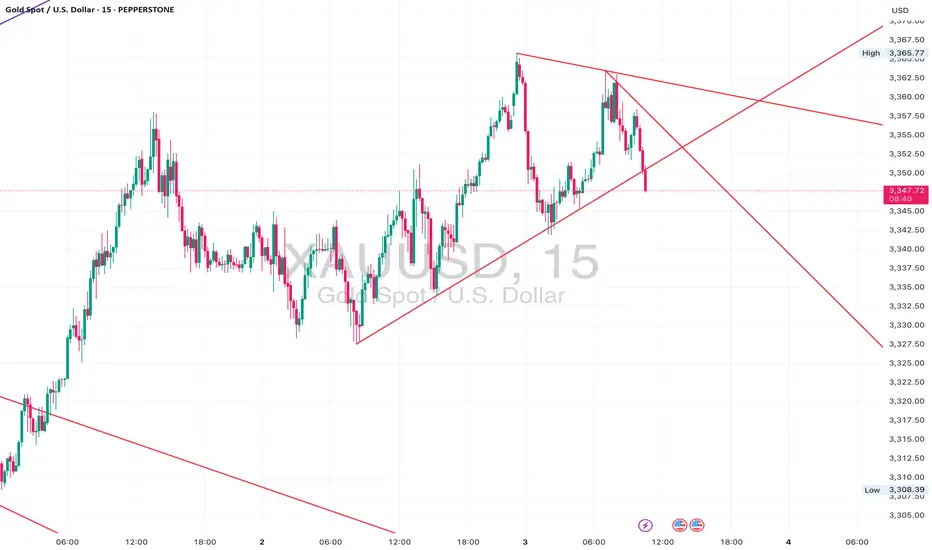
Gold Squeeze Incoming – Triangle Break Looming on XAUUSDGold is coiling tightly within a symmetrical triangle on the 5-minute chart, pressing against key support around 3,352. Price action is compressing between a rising trendline and descending resistance — indicating an imminent breakout.
⸻
📍 Key Levels:
• Support: 3,352-3,350 zone – defending so far.
• Resistance: 3,360-3,366 area – repeated rejection above.
⸻
🔎 What I’m Watching:
✅ Break below the rising trendline could trigger a quick drop toward 3,340 and possibly 3,333.
✅ Break above the descending trendline may fuel a rally back toward 3,366-3,370.
🕒 Timing matters: volume is building as price nears the apex — be ready for a spike in volatility.
⸻
📌 Plan:
• Wait for a clear 5M candle close outside the triangle for confirmation.
• Set alerts at 3,349 and 3,362 to catch the breakout early.
• Manage risk tightly – false breakouts are common in squeeze patterns.
⸻
💬 How are you trading this setup? Drop your thoughts below ⬇️ and let’s discuss!
DeGRAM | GOLD retest of the resistance line📊 Technical Analysis
● Price holds above the broken blue resistance line, now acting as support near 3 347, while an inner up-sloper is guiding a stair of higher lows inside the new grey channel.
● The confluence of channel mid-line and 3 355 swing high is the gate; its clearance activates an equal-width objective at 3 380, with the outer rail / former consolidation lid at 3 425 next.
💡 Fundamental Analysis
● Easing US ISM-services prices trimmed real 2-yr yields and the dollar, while latest WGC data show June net central-bank purchases rising for a third month, reviving dip-buying in gold.
✨ Summary
Long 3 345–3 355; hold above 3 355 targets 3 380 → 3 425. Invalidate on an H1 close below 3 320.
-------------------
Share your opinion in the comments and support the idea with a like. Thanks for your support!

Gold on upswing as expectedAs discussed throughout my yesterday's session commentary: "My position: Since #3,337.80 was neckline for upside Bull structure, I was aware if it gets invalidated to the downside, it will open doors for #3,327.80 extension (which held twice throughout late U.S. and Asian session). I don't expect much Selling action today however Bulls need another Fundamental push to invalidate wall of Resistances at #3,340's and #3,350's. I will continue Scalping as opportunity arise / no Swing orders."
I have expected Gold to test upside extension where I Bought (Scalp of course) #3,342.80 twice towards #3,348.80 and re-Sold #3,357.80 - #3,362.80 belt many times (excellent returns). I will await area to be engulfed and only then make my move.
As I am getting many Fundamental inquiries lately: Gold's current almost #2-Year perma-Bull outlook is driven by more than Fundamentals - rising Global debt, Central bank Buying (especially by China), and general declining trust in fiat currencies all play key roles in Gold's perma-Bull stance. It's considered undervalued by some part of my analysis when adjusted for Inflation and Money supply expansion (like #M2 growth). Gold acts as a Long-term hedge against currency devaluation and systemic Risk, especially during Global conflicts or financial crises. Mining costs are also on the rise while new discoveries are declining, which supports Higher future Prices. With ongoing de-Dollarization and interest in Gold-backed digital assets, the Long-term future of Gold looks structurally strong.
My position: Gold is Trading within #3,350's belt which represents crossroads for the Short-term. Either #3,362.80 - #3,368.80 break-out to the upside towards #3,377.80 strong Resistance, or #3,342.80 - #3,352.80 break-out to the downside towards #3,327.80 Support. Current Price-action is ideal for Scalping since I don't expect major movement until tomorrow's NFP numbers.

XAUUSD:A long trading strategy
The highest gold price in the Asian session reached 3365.4, which is already our mid-line target range. If you have completed and left the market, congratulations, because I personally set the TP point of 3368, so it did not touch, the trend of the past two days is appropriate rewithdrawal after strengthening, the high is also gradually rising, the overall long trend has not changed. For today's data, the probability will make gold prices continue to rise, trading ideas or to do the main.
Trading Strategy:
BUY@3347-51
TP:3365-70
This TP range is also the target range of the median trader, for friends who do not have automatic stop profit, you can take a profit manually at that time.
More detailed strategies and trading will be notified here ↗↗↗
Keep updated, come to "get" ↗↗↗
Gold & $3400Gold is under the resistance at $3400 for a long time, and if can not break that then downside movement will come.

Gold remains strong, and we continue to buy on pullbacks!ADP employment unexpectedly turned negative, and the probability of a rate cut increased again
The ADP employment report released on the same day showed that the number of private sector jobs in the United States decreased by 33,000 in June, the first net loss since March 2023, and the May data was also significantly revised down to +29,000. After the release of the ADP data, the probability of the Federal Reserve's interest rate cut in July quickly rose from 20% before the data was released to about 27.4%. The market's bet on a rate cut before September has almost been fully factored in, and federal funds futures also show that the possibility of a 50 basis point rate cut has risen to 22%.
This "frown-making" data released a strong signal of cooling in the labor market before Thursday's non-farm report. If today's non-farm continues to be weaker than expected, it may force the Federal Reserve to act faster.
Gold opened high and then retreated continuously. From the daily chart, gold is still in an upward trend in the long term. The previous market rebounded effectively after touching the downward trend line, and the rebound force was considerable. With the restart of the bullish force, the main idea can carry the trend and do more on dips. In addition, from the 4-hour chart, gold has broken through the previous downward trend line and has gone out of the V-shaped reversal pattern, which means that the previous short-term downward trend has ended. At present, a new trend is also opening up in the 4-hour chart. The rise of gold has also established an upward trend line. You can consider buying on dips based on the upward trend line 3332. However, due to insufficient bottoming time in the previous stage, it may still face the risk of decline, so you should set the stop loss with caution. From the 1-hour chart, gold fell after opening high, and the bullish trend remains unchanged. The points for long orders can consider 3334 and 3328.
Gold operation suggestions: Go long on gold near 3325-3335, with a target of 3350-3360.

GOLD (XAUUSD) | 4H OB Respected | waiting for 30m LH BreakPair: XAUUSD
Bias: Bullish
Timeframes: 4H, 30M, LTFs
• 4H showing strong bullish structure — OB respected cleanly, confirming higher timeframe demand.
• On 30M, now patiently waiting for the break of LH to confirm continued bullish intent. After that, looking for a sweep off a fresh internal OB for LTF entry confirmation.
🔹 Entry: After LH break + sweep + CHoCH on LTFs
🔹 Entry Zone: Within fresh internal OB post-LH break
🔹 Target: Near structure highs
Mindset: Let the structure speak. No guesswork — wait for your levels, your break, and your confirmation. Precision over prediction.
Bless Trading!

July 3, 2025 - XAUUSD GOLD Analysis and Potential OpportunityAnalysis:
Today, the NFP report will be released during the US session.
Before Asian trading even began, the market saw a sharp downward move.
It’s possible that both the Asian and European sessions will remain range-bound until the data release provides a clear direction.
Until then, treat 3342–3365 as the primary range and focus on selling near resistance and buying near support within this zone.
🔍 Key Levels to Watch:
• 3375 – Resistance
• 3365 – Resistance
• 3358 – Resistance
• 3352 – Resistance
• 3342 – Important support
• 3337 – Support
• 3328 – Key support
• 3310–3312 – Intraday key support zone
• 3300 – Psychological level
📈 Intraday Strategy:
• SELL if price breaks below 3342 → target 3337, then 3333, 3328, 3322
• BUY if price holds above 3348 → target 3350, then 3352, 3355, 3358
👉 If you want to know how I time entries and set stop-losses, hit the like button so I know there’s interest — I may publish a detailed post by the weekend if support continues!
Disclaimer: This is my personal opinion, not financial advice. Always trade with caution and manage your risk.
XAUUSD: Gold Surges on U.S. Fiscal Reform ExpectationsGold remains firmly within a short-term bullish structure after rebounding strongly from the $3,258 support zone and forming a consolidation pattern just below the $3,342 resistance. This area marks the confluence of a descending trendline and a fair value gap (FVG), where buyers may gather momentum to break through.
Fundamental news continues to favor the upside: concerns over the U.S. budget deficit and an upcoming tax reform package have boosted safe-haven demand for gold. Meanwhile, U.S. bond yields and the dollar remain low, further driving capital into precious metals.
Yesterday, gold rose by approximately $33.49, equivalent to 3,349 pips, confirming strong bullish inflows. If price breaks above the $3,342–$3,356 zone, the next target could extend beyond the $3,400 mark.
However, if short-term pullbacks occur, the $3,258 area remains a key support level to watch for potential bullish re-entry signals.
Gold price rises by more than $100, will the bull run continue?📰 News information:
1. Geopolitical situation
2. PMI data
3. Global Central Bank Governors Meeting
📈 Technical Analysis:
The NY session is about to begin, and there are two things we need to pay attention to. First, the PMI data, and second, the talks between global central bank governors. If Powell again hints that the inflation outlook is weaker than expected, this will increase the Fed's easing bets and trigger a new round of decline in the US dollar. The dovish tone may help gold prices to further rebound. On the contrary, if Powell makes some hawkish or cautious remarks, this may exacerbate the recent downward trend in gold prices. The key point at present is the 3350 mark. If the 4H closing line of the NY session remains below 3350, then in the short term we are expected to continue to retreat to the 3330-3320 range. If the 4H closing line is above 3350 and stabilizes, gold may rebound to the 61.8% position, which is around 3372.
🎯 Trading Points:
SELL 3340-3350-3355
TP 3330-3325-3320
BUY 3330-3320
TP 3340-3350-3372
In addition to investment, life also includes poetry, distant places, and Allen. Facing the market is actually facing yourself, correcting your shortcomings, confronting your mistakes, and strictly disciplining yourself. I hope my analysis can help you🌐.
FX:XAUUSD FXOPEN:XAUUSD PEPPERSTONE:XAUUSD FOREXCOM:XAUUSD FX:XAUUSD OANDA:XAUUSD TVC:GOLD

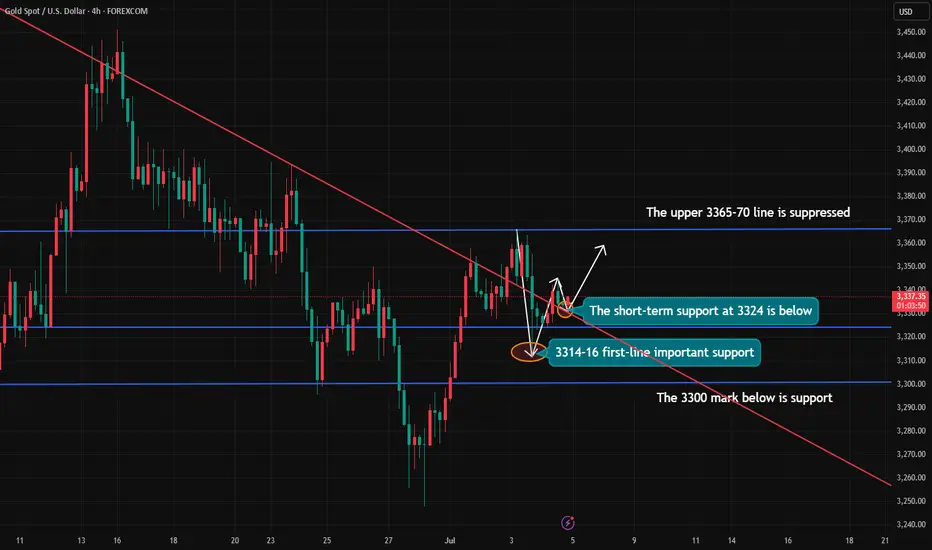
Gold lacks downward momentum.Today, gold is relatively quiet due to the impact of the US Independence Day holiday. Below, we continue to pay attention to the short-term quality layer of 3324. The key pressure above is maintained at yesterday's opening point of 3345-50. At midnight, gold rebounds near 3345-50 and can be shorted. The target is around 3330-33. It closes early at midnight and maintains a range of fluctuations! If your current gold operation is not ideal, I hope I can help you avoid detours in your investment. Welcome to communicate!
From the 4-hour analysis, pay attention to the support of 3324-30 below, focus on the support position of 3316, and pay attention to the short-term resistance of 3345-50 above. At midnight, the overall high-altitude low-multiple cycle participation remains unchanged. In the middle position, watch more and move less, be cautious in chasing orders, and wait patiently for key points to participate.
Gold Pulls Back After Strong US NFP Data📊 Market Overview:
U.S. June Non-Farm Payrolls came in at 147,000 vs. 110,000 expected, strengthening the dollar and reducing expectations for a July Fed rate cut. As a result, gold dropped nearly 1%, trading in the $3,328–3,332 zone
📉 Technical Analysis:
• Key Resistance: $3,350 – $3,360
• Immediate Support: $3,322 – $3,328
• EMA: Price has fallen below the 09 EMA, indicating a bearish short-term trend.
• Candle/Volume/Momentum: A strong bearish candle with increased volume shows significant selling pressure post-NFP
📌 Outlook:
Gold may continue its downtrend in the short term if the dollar remains strong and no fresh bullish triggers emerge. A drop toward $3,322–$3,328 is possible.
💡 Trade Ideas:
🔻 SELL XAU/USD at: $3,342 – $3,345
🎯 TP: $3,322
❌ SL: $3,348
🔺 BUY XAU/USD at: $3,322 – $3,325
🎯 TP: $3,345
❌ SL: $3,316

gold strong upwardGold will continue its strong upward trend, the corrections seem to have come to an end, the gold price is certain to reach above $3500, if the current price and the price of 3235 break down, you should not panic, the direction of the gold price movement is still towards the ceiling ( ATH ) CMCMARKETS:GOLD

Gold Daily Review
Dear traders, the sell-off last night directly brought the bulls back to their original form. The closing price of 3325 made most of the gains accumulated hard this week spit back. To me, this wave of market is a typical "data killing". The June non-agricultural data came out halfway, and the employment data was so strong that even the old foxes on Wall Street were surprised. Now the market's bet on the September rate cut has dropped directly from 70% to less than 50%. How can gold, which is "interest rate sensitive", withstand such a critical blow?
From a technical perspective, the negative line of the daily line is indeed ugly, but I think the bulls should not die. Look at the 4-hour chart. The Bollinger Bands have begun to "tighten their belts", and the 3310-3365 box is clearly drawn. Today is Independence Day. The US market closed early. Those Wall Street wolves probably ran to the Hamptons for a pool party. We are likely to play a "lying flat" market in the Asian and European markets. I calculated with my fingers that the 40 USD range of 3310-3350 is enough for us to toss around. Remember - short orders at the upper edge of 3345 should be as fast, accurate and ruthless as "whack-a-mole", and long orders at the lower edge of 3325 should be as patient as a fisherman!
The news is now "ice and fire". On the one hand, Trump's "big and beautiful" tax cut bill has just passed the test successfully. After this shot of booster, the US dollar and US bond yields are soaring like stimulants; on the other hand, drones in the Middle East are causing trouble again, and the small flame of geopolitical risk has not been extinguished. If you ask me, gold is like a "schizophrenic patient" now, jumping back and forth between inflation narratives and risk aversion sentiment.
Specific strategy:
① Directly "operate from a height" near the rebound of 3345, set the stop loss at 3352, and the target position is the 3330-3320 range. Remember that this position is the "previous high neckline position" and the probability of breaking is not high.
② You can "lighten your position and fish" when it falls back to 3325. The defensive position of 3315 must be strictly guarded, and the target position is the pressure zone of 3335-3345
Market next target ⚠️ Disruption Analysis – Gold (1H):
🔹 Pattern Disruption Identified:
The chart previously followed a descending structure with lower highs and lower lows, confirming bearish momentum.
However, a temporary recovery (small bullish correction) appears after a sharp drop, disrupting the previous flow.
---
🔄 Disruption Points:
1. Break in Momentum (Structure Shift):
The recent bullish correction (small upward leg) challenges the consistency of the descending trend.
It signals a potential pause or trap in the current bearish move.
2. Price Rejection Area:
Price attempted to bounce but failed to break above the previous lower high, indicating bearish strength remains intact, but is facing disruption from short-term buyers.
3. Volatility Spike:
The long wick on the recent candle shows a volatility disruption, likely due to economic news or high-impact events (suggested by the ⚡ icon on the chart).
4. Target Zone Disruption:
Though the yellow arrow points toward a bearish target, the slight upward pullback adds uncertainty about whether price will reach that level immediately.
XAUUSD POSSIBLE SHORTOn the technical view, the instrument is trading in a global bull trend on D1. It recently rejected for the 3rd time near a key zone and is now testing a supporting bullish trendline. If this is broken below and the subsequent support, it will be a good indication of a bearish movement.
Please do your own analysis before taking any trades.
Cheers and happy trading !!!

XAU/USD) bearish reversal analysis Read The captionTechnical analysis of (XAU/USD) based on price action and technical indicators on the 15-minute timeframe. Here's a
---
Key Technical Insights:
1. Resistance Level (Highlighted Yellow Zone):
Price is approaching a strong resistance zone (previous rejection marked by red arrows).
This area has historically pushed price downward.
2. Trendline Support (Rising Black Line):
Price has been following a short-term ascending trendline, forming higher lows.
A break below this trendline signals potential bearish reversal.
3. EMA 200 (Blue Line):
Price is currently above the EMA 200, indicating short-term bullish momentum.
However, price is testing resistance — a rejection could flip momentum bearish.
4. Bearish Rejection & Projection:
The chart shows an anticipated rejection from resistance, followed by a break of trendline support.
Target zone is marked near 3,228.098, indicating a drop of ~94 points from the current level.
5. RSI (Relative Strength Index):
RSI is nearing overbought territory (68.79).
A bearish divergence or RSI crossing down may confirm weakening momentum.
Mr SMC Trading point
---
Conclusion / Trading Idea:
Bias: Bearish
Entry Zone: Near the resistance level (~3,322)
Confirmation: Break of trendline support
Target: 3,228
Stop-Loss: Above resistance zone (just over the upper trendline)
---
pelas support boost 🚀 this analysis)

Gold: Smart Money or Trap Money? Long Setup with a twistDescription
> Gold – Long Setup Breakdown
After a clean break to a new Higher High, price pulled back aggressively on volume. A lot of traders will label that red spike as bearish — but let’s unpack what’s really happening.
1. Structure Held
Despite the drop, the move respected the previous demand zone — a classic smart money move to test liquidity before continuation.
2. Volume Spike (Red Candle):
Could be:
A shakeout of late buyers, or
Aggressive shorting that got absorbed just above the key structure.
3. Quick Reclaim + Tight Base:
Price reclaimed the zone fast and started building a tight consolidation just above the reclaimed zone — that’s usually a sign of pre-expansion energy.
4. Buy Stop Cluster Potential:
The current compression hints at stops above being used as fuel for the next impulsive leg.
I'm positioning long here — not because of the breakout, but because of the retest that held above demand with signs of absorption and continuation.
But I want your take:
Is this absorption by smart money or a bull trap?
Would you wait for a second retest, or is this the real deal?
How do you interpret that red volume spike?
Drop your thoughts 👇 Let's build sharper analysis through debate.

My Weekly Review and Some tierlist for the zones I madeHello guys. its end of the week and I wanna share you my journey since monday until today. I also tell you the real reason why I don't believe the bottom is in yet and holding my swing sell. Thank you for watching.
