Xauusd and gold wasn next move police📈 TradingView Professional Bullish Idea – XAUUSD (Gold/USD)
Timeframe: 1H
Bias: Bullish, with confirmation from FVG & CHoCH
Structure:
Strong Break of Market Structure (BMS)
CHoCH (Change of Character) confirming bullish shift
Fair Value Gap (FVG) filled and respected
Price above EMA 50 & 100, showing momentum alignment
---
📌 Trade Plan (Professional Format)
> ENTRY ZONE:
Watch for bullish continuation above 3,339–3,343 FVG zone
Confirmation: Strong candle close above FVG with volume support
> TP Targets:
🎯 TP1: 3,350.00 (previous minor high – already hit)
🎯 TP2: 3,361.00 (liquidity target)
🎯 TP3: 3,375.00 (upper imbalance target)
> STOP LOSS:
🛑 Below 3,324.00 (below previous BMS & demand block)
> Invalidation:
Price closes below 3,322 with volume → invalidates bullish thesis
---
🔍 Idea Summary
> Price has respected demand zone with strong BMS & CHoCH.
FVG filled with bullish reaction suggests possible continuation.
As long as price stays above the EMA cluster and demand, bulls are in control.
XAUUSDK trade ideas

downtrend, back to 3300 gold price⭐️GOLDEN INFORMATION:
Gold prices (XAU/USD) inch higher in early Asian trading on Wednesday, recovering part of Tuesday’s sharp decline to multi-day lows, though follow-through buying remains limited. Lingering uncertainty surrounding US President Donald Trump’s trade tariffs, combined with expectations that the Federal Reserve (Fed) will maintain elevated interest rates, continues to dampen risk appetite. This weaker market mood is providing modest support to the safe-haven metal.
Meanwhile, the US Dollar (USD) eases slightly after Tuesday’s surge to its highest level since late June, which is helping gold stabilize. However, persistent speculation that the Fed may delay rate cuts, following a slight uptick in US inflation, continues to bolster the greenback and could cap further gains in gold. Traders remain cautious and await today’s US Producer Price Index (PPI) release for clearer direction.
⭐️Personal comments NOVA:
Selling pressure, break 3340 downtrend line continues. Economic news is helping DXY recover
⭐️SET UP GOLD PRICE:
🔥SELL GOLD zone: 3381- 3383 SL 3388
TP1: $3370
TP2: $3360
TP3: $3350
🔥BUY GOLD zone: $3306-$3304 SL $3299
TP1: $3318
TP2: $3330
TP3: $3343
⭐️Technical analysis:
Based on technical indicators EMA 34, EMA89 and support resistance areas to set up a reasonable SELL order.
⭐️NOTE:
Note: Nova wishes traders to manage their capital well
- take the number of lots that match your capital
- Takeprofit equal to 4-6% of capital account
- Stoplose equal to 2-3% of capital account

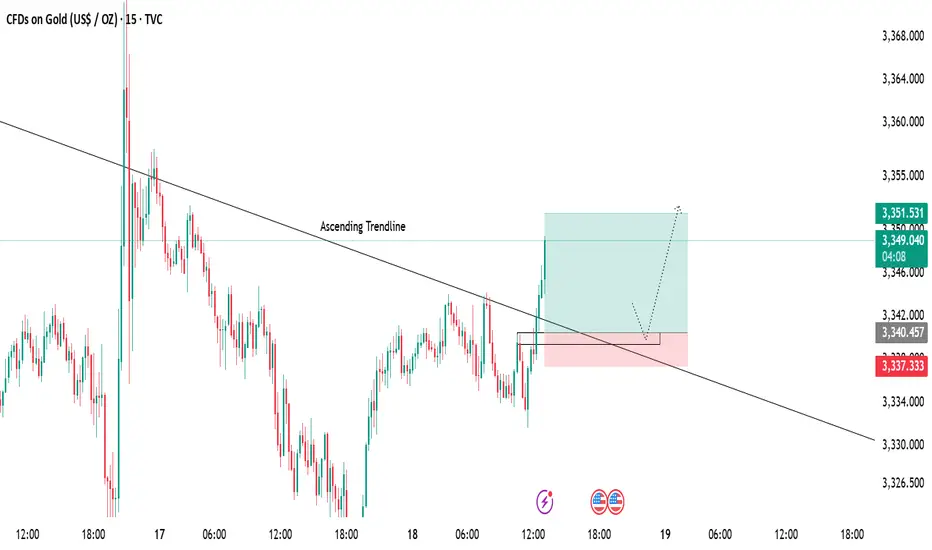
Gold 15-Min Chart Analysis Alert!Gold has successfully broken above the descending trendline, showing early signs of bullish momentum. Price has reclaimed structure and is now trading above the breakout level.
📌 Retest Zone:
We can expect a possible pullback towards the marked zone for a healthy retest before continuing the upward move.
🎯 Bullish Target:
As long as price holds above the support area, the bullish bias remains intact with targets around 3351+.
Gold Double Bottom Rejection - Bullish Confirmation PatternThere is currently a double bottom rejection pattern at play and price is reacting to an H4 TF demand zone. Confirmations to go long will be in this demand zone or the next one. But my money is on the current one.
Best thing to do is wait for an M15 supply to break to validate taking longs from the current demand. But the bulls are showing strength.

Target remained gold.All markets, especially gold, have been the most manipulated in the last month.
(Market manipulation is completely different from market volatility due to news)
Previously, this happened maybe once or twice a month, but in the last month it happened more than 10 times
Last word: The price of the bottom 3247 will never be hit until the target 3257 is touched

Gold price will reach 3400 next weekGold price will reach 3400 next week
Would you rather believe in your own beliefs or in what Trump says?
Trump's attitude towards Powell: "Fire him!" yesterday, "I didn't say that!" today, "Actually he is a genius!" tomorrow - this is more difficult to predict than the gold market. "
"If the Fed cuts interest rates, Trump will say it is his credit;
If the Fed raises interest rates, it must be a conspiracy of the "deep government." ”
As shown in Figure 4h
Gold prices are under pressure near 3375 and are currently converging near 3350.
The entire macro triangle convergence structure is slowly coming to an end.
Next week, a new round of big market will surely break out.
And this weekend, there is a high probability that new major events + black swan events will occur.
4-hour level short-term trading logic
Bull-bear watershed: US$3350 (closing price on Friday this week)
Upward breakthrough: Pay attention to the pressure zone of US$3370→3380. If the breakthrough fails, the upward expectation will look to 3400+.
Downward breakthrough: Pay attention to 3315-3 The $320 support zone, if lost, will turn bearish to $3,280.
Core driving events:
Fed policy game (key time: July 22-25)
July 22: Fed Governor Waller's speech (previously called for a 25 basis point rate cut in July)
Market focus: If the "immediate rate cut" stance is strengthened, gold prices may break through the $3,370 resistance level.
July 24: Fed Beige Book released
Potential impact: If the report shows regional economic weakness (especially manufacturing/employment), safe-haven buying of gold will increase.
July 25: US Q2 Initial GDP value (expected to grow 1.8% year-on-year)
Scenario simulation: If the data is lower than 1.5%, stagflation trading may push gold prices up by more than 1.5% in a single day
Geopolitical risk (Trump policy interference)
July 23: Trump team may announce details of tariffs on the EU
Historical law: For every 1% increase in tariff expectations, gold volatility will increase by 0.3%, but the market has partially digested 30% tariffs.
Middle East situation: If the ceasefire agreement between Israel and Hamas breaks down, gold prices may respond quickly and rise by 1%-2%.
Summary:
Next week, gold is likely to maintain a range of $3310-3380, but there is an event-driven breakthrough opportunity.
Key observation nodes:
Waller's speech on July 22 (rate cut expectation calibration)
Beige Book on July 24 (economic resilience verification)
GDP data on July 25 (stagflation trading trigger point)

Gold trade short now 📉 Short Trade Signal – XAU/USD (15m Chart)
⚠️ Signal Type: Short
⏰ Timeframe: 15 minutes
📸 Chart Reference: Price consolidating after bullish impulse; resistance formed
🔽 Trade Details
Parameter Value
Entry (Sell) 3,345.00 (current level)
Stop Loss (SL) 3,368.00 (above recent high/resistance)
Take Profit (TP) 3,309.00 (demand zone / imbalance fill)


Daily live trade with XAUUSD in 15m/30m/1h 20250718Daily live trade with XAUUSD in 15m/30m/1h 20250718

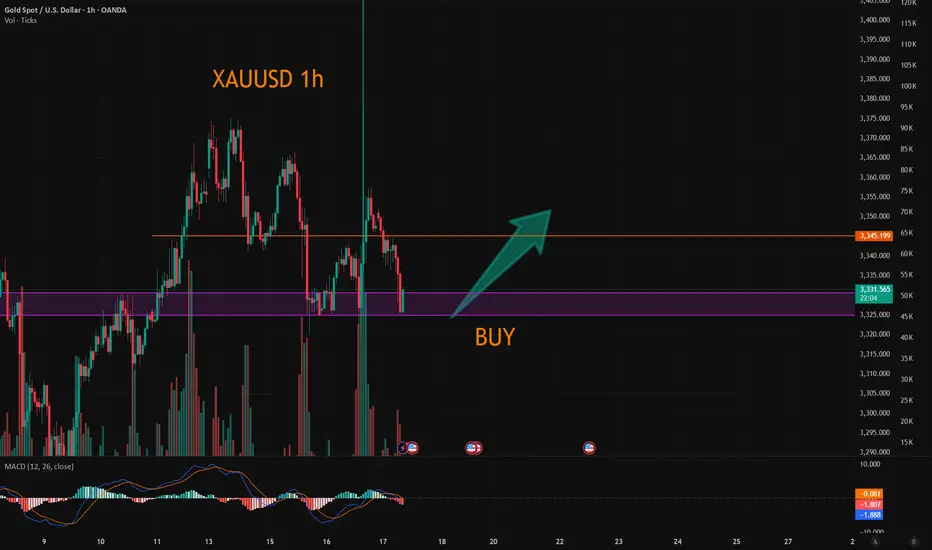
XAUUSD AND GOLD NEXT MOVR DOWN TREND 🧠 OANDA:XAUUSD Professional Trading Idea (Smart Money Concept Based)
🔍 Market Structure Overview:
CHoCH → confirmed on bullish move (July 11–13), signaling reversal from bearish to bullish.
LH to LL → clean bearish leg formed post FVG mitigation and rejection.
BMS (Break of Market Structure) confirmed → shift back to bearish structure.
Price recently tapped into a deep FVG + demand zone, showing rejection wick and bounce.
---
🎯 Trading Plan: Intraday Sell-Bias Idea (Unless Proven Otherwise)
🔴 Bias: Bearish
📍 Entry Zone: Around 3340–3345 (inside FVG + previous supply zone)
🛑 SL (Invalidation): Above 3350–3355 zone
🎯 TP1: 3330
🎯 TP2: 3315
🎯 TP3: 3304 (major demand zone)
---
✅ Entry Conditions (Confirmation Required):
Rejection candlestick or bearish engulfing in 3340–3345 zone
EMA resistance hold
No bullish BMS on lower timeframes
---
⚠️ Invalidation Plan:
If price breaks above 3355 with momentum and closes bullish → structure flips to bullish, look for buys only on retracement to 3345–3350 zone.

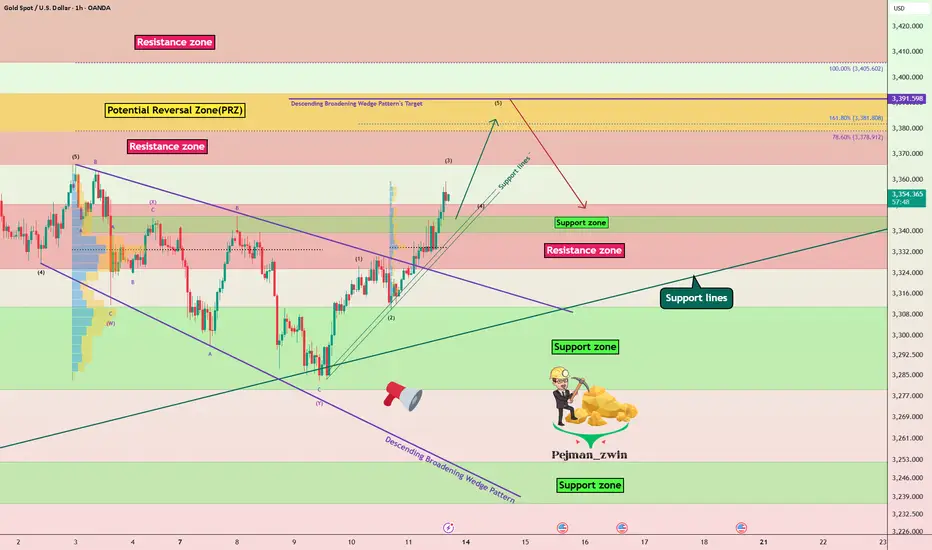
Gold Roadmap=>Short termGold ( OANDA:XAUUSD ) currently appears to have broken through the Resistance zone($3,350-$3,325) .
The Resistance zone($3,350-$3,325) was broken with the help of the Descending Broadening Wedge Pattern , the upper line of this classic pattern having served as an important resistance line for us in previous ideas .
In terms of Elliott wave theory , Gold has completed the Double Three Correction(WXY) within the Descending Broadening Wedge Pattern . It is currently completing the next five impulse waves . Wave 5 of these waves could end in the Potential Reversal Zone(PRZ) .
I expect Gold to rise to the Potential Reversal Zone(PRZ) , and of course, given the momentum of gold approaching PRZ , we can also look for Short positions in PRZ .
Note: Stop Loss (SL) = $3,329
Gold Analyze (XAUUSD), 1-hour time frame.
Be sure to follow the updated ideas.
Do not forget to put a Stop loss for your positions (For every position you want to open).
Please follow your strategy; this is just my idea, and I will gladly see your ideas in this post.
Please do not forget the ✅ ' like ' ✅ button 🙏😊 & Share it with your friends; thanks, and Trade safe.
Update gold time 1 hourI checked on the 15 minute time frame and saw liquidity points for us to consider trading, Gold price is being supported, candlestick patterns are showing signs of breaking resistance so consider volume for the sell-off plan. If you do not have a buy order in the idea below 👇
then set up a buy order according to this trading idea, good luck to you and us.
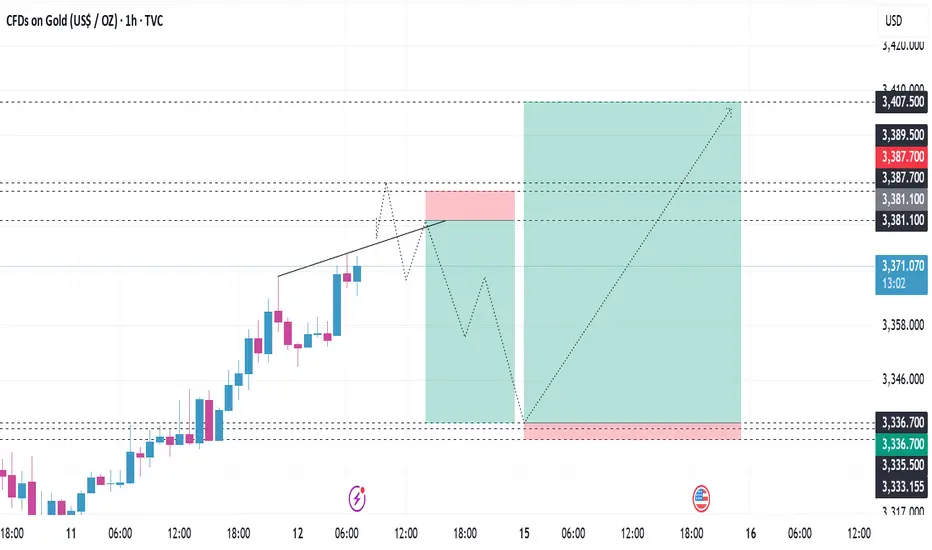
High Probability Short for Asia: Major Profit at 3318 Description:
Gold remains under pressure below multiple descending trendlines and is consolidating above key support. With volatility high, there’s a strong chance of a breakdown during the Asia session.
Trade Plan:
Wait for a retest of the 3,340–3,355 resistance zone (yellow box).
Watch for a bearish rejection (such as a strong wick, bearish engulfing, or high selling volume) at this zone—do not short blindly.
Enter short after confirmed rejection.
Trade Management:
Take a big part of your profit at 3,318 (first blue support line).
Once 3,318 is hit, immediately move your stop-loss to breakeven (your entry) for the remaining position.
Let the rest run toward the next targets: 3,301 and 3,299, and possibly as low as 3,247 if the breakdown is strong.
Key Points:
High-probability move is expected during the Asia session.
Trade only on confirmation, not at random levels.
If price reclaims and holds above 3,355, bearish idea is invalid.
Summary:
Look for a confirmed rejection near 3,340–3,355. Take most profit at 3,318, move stop-loss to breakeven, and hold the rest for a potential deeper drop.

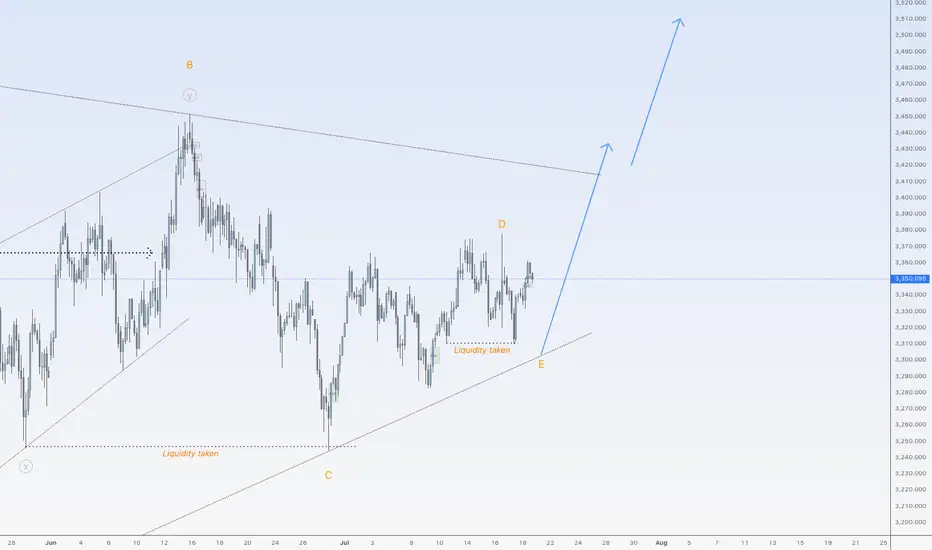
Gold is ready to go upHi traders,
Last week gold made another correction down for Wave E but after that it broke the low again. This could be wave 2 of the next impulsive wave up and gold will continue to rise next week.
Or price makes one more move down for wave E and then start the next impulsive wave up.
Let's see what price does and react.
Trade idea: Wait for a small correction down on a lower timeframe and a change in orderflow to bullish to trade longs.
If you want to learn more about trading FVG's & liquidity sweeps with wave analysis, please make sure to follow me.
This shared post is only my point of view on what could be the next move in this pair based on my technical analysis.
Don't be emotional, just trade your plan!
Eduwave
XAUUSD:Go long
Based on the 4-hour analysis, the short-term support below for today remains focused on the area around 3318-25, while the short-term resistance above focuses on the 3340-45 level. The key resistance above is at 3380. Overall, this range remains the main framework for our participation in the trade, with positions generally being cautious and waiting for key levels to enter. I will provide specific trading strategies during the session, so please stay tuned. Given that the current market has retraced to 3325 and then rebounded, we can go long in the 3325-30 range.
Trading Strategy:
BUY@3325-30
TP:3340-45
More detailed strategies and trading will be notified here ↗↗↗
Keep updated, come to "get" ↗↗↗
Gold is in the Bearish DirectionHello Traders
In This Chart GOLD HOURLY Forex Forecast By FOREX PLANET
today Gold analysis 👆
🟢This Chart includes_ (GOLD market update)
🟢What is The Next Opportunity on GOLD Market
🟢how to Enter to the Valid Entry With Assurance Profit
This CHART is For Trader's that Want to Improve Their Technical Analysis Skills and Their Trading By Understanding How To Analyze The Market Using Multiple Timeframes and Understanding The Bigger Picture on the Charts
