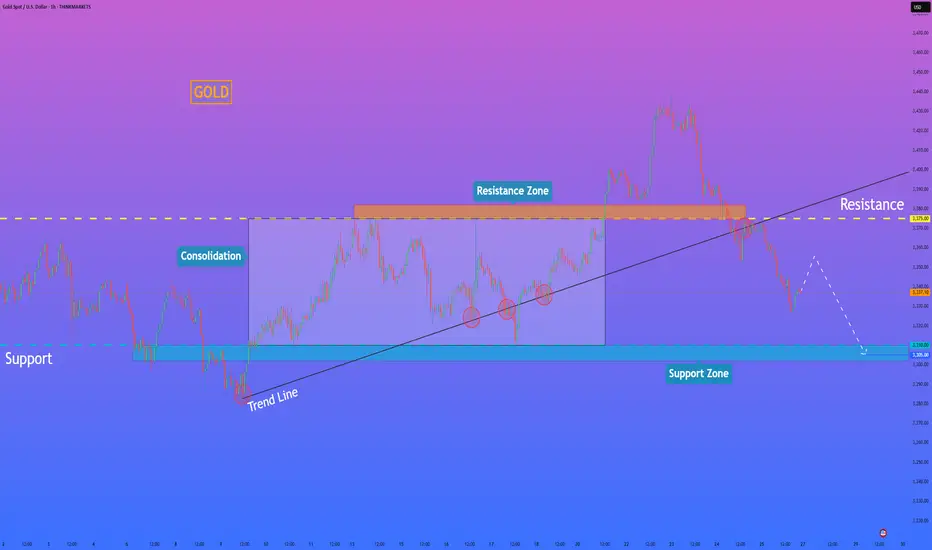
GOLD (XAUUSD): Support & Resistance Analysis for Next Week
Here is my latest structure analysis and important
supports and resistances for Gold for next week.
Consider these structures for pullback/breakout trading.
❤️Please, support my work with like, thank you!❤️
I am part of Trade Nation's Influencer program and receive a monthly fee for using their TradingView charts in my analysis.
XAUUSDK trade ideas

Daily XAUUSD Outlook — Riding the Fed Wave (July 28, 2025)Hey Gold Hunters! 🌟
Today feels like the calm before a storm—ADP whispers tomorrow, the Fed speaks Wednesday, and gold is inching toward its next big move. Let’s weave the macro pulse into our Smart‑Money map, highlight the five real zones, then plot our sniper‑perfect entries. No fluff—just the human beat of the market.
1️⃣ Macro Pulse & Market Mood
US Dollar: Bullish tilt as markets price in another hawkish Fed pause.
Tomorrow (Tue): ADP jobs print could spark an early swing.
Wed PM: FOMC Statement & Powell’s press conference—biggest catalyst this week.
Thu/Fri: Core PCE, Unemployment Claims, then Friday’s NFP + ISM Manufacturing.
Gold is caught in suspense: a squeeze here (into supply) or a slide there (into demand) will come fast once the Fed drops its hint.
🧭 Bias: Neutral‑bearish—looking for lower highs under the 3,345–3,375 supply zone, with a preference to short rallies into that band until price convincingly breaks and holds above 3,375. Once we see a clean weekly‑style close above that level, we’ll flip to neutral‑bullish.
2️⃣ Five Breathing Zones (Top → Bottom)
🛑 Zone 1 “Sky Trap” (3,380 – 3,415)
The final airspace above our daily EMAs (10/50) where stops are hunted. Fib ext’s 127%–161.8% and an unfilled Fair‑Value Gap live here. Any spike that ends in a long upper wick or bearish engulf = short‑trap.
(let price fall clear of this zone before the next)
⚔️ Zone 2 “Premium Supply” (3,345 – 3,375)
The two‑week high order block, hugged by EMA50 and Fib 61.8%. Friday’s rejection candle was born here. Watch for bearish PA after a retest—your core sell zone.
(space down to next)
🌊 Zone 3 “First Demand Cove” (3,290 – 3,320)
Where mid‑June’s buyers piled in: June consolidation OB, filled FVG, and Fib 38.2–50% confluence. SMA100 sits below for extra gravity. A clean drop and bullish reaction here = sniper‑long trigger.
(gap to deep zone)
🚀 Zone 4 “Deep Pullback Bay” (3,240 – 3,270)
Hidden Fair‑Value Gap, BOS origin, and weekly EMA21 converge. If Zone 3 breaks, this is your deep‑dip reload—hunt that D1 reversal wick.
(last space)
🛡️ Zone 5 “Macro Reset Block” (3,000 – 3,140)
The root of 2024’s CHoCH, EMA200/SMA200 cluster, and 78.6–88.6% Fib retrace. Only if gold truly panics on a USD blitz—ultimate accumulation.
3️⃣ Sniper‑Perfect Scenarios
🔴 Short Setup
Where: A thrust into Zone 1 or 2 (3,345+).
Cue: Long upper wick → bearish engulf on D1/M30.
Edge: FVG fill + Fib confluence + RSI rollover.
🟢 Long Setup
Where: A dip into Zone 3 or, if swept, Zone 4.
Cue: Bullish pin‑bar or engulf + reclaim of EMA10/50.
Edge: June OB base + RSI bounce from ~50.
4️⃣ Your To‑Do List
Morning Watch: Does gold flirt with 3,375? Prep your shorts.
Mid‑Day Pull: A drop to 3,300? Hunt your longs.
Avoid: The gaps between zones—those are “no‑man’s land.”
News Trades: Let the daily candle close post‑Fed before committing.
💬 What’s your plan today? Comment below—let’s refine our edge!
👍 Enjoyed this map? Smash that Like & Follow for more pulse‑driven, zero‑fluff outlooks.
Disclosure: Chart powered by Trade Nation’s TradingView feed. I participate in their Influencer Program.
GoldFxMinds 💛
GOLD NEXT MOVE (expecting a bullish move)(18-07-2025)Go through the analysis carefully and do trade accordingly.
Anup 'BIAS for the day (18-07-2025)
Current price- 3350
"if Price stays above 3330, then next target is 3360, 3378 and 3407 and below that 3310 and 3280 ".
-POSSIBILITY-1
Wait (as geopolitical situation are worsening )
-POSSIBILITY-2
Wait (as geopolitical situation are worsening)
Best of luck
Never risk more than 1% of principal to follow any position.
Support us by liking and sharing the post.
XAUUSD M30 BEST SETUP FOR TODAY📉 Gold Analysis:
🔸 Gold is forming an M-pattern – a potential bearish setup.
➡️ We can look for a sell opportunity if we get a strong candle closing below the M-pattern structure.
📈 Buying Setup (Support Zone):
🔹 There's a strong buy zone at the bottom, marked by:
✅ Fair Value Gap (FVG)
✅ Order Block (OB) confirmation
🕵️♂️ Wait for clear price action confirmation before entering any trades.


GOLD | Bullish Bias Amid Fed & Trade Policy UncertaintyGOLD | Bullish Bias Amid Fed & Trade Policy Uncertainty
Gold prices edge higher as markets weigh conflicting signals from the Federal Reserve and renewed trade policy uncertainty. Diverging opinions among Fed officials regarding the inflationary impact of President Trump's proposed tariffs have fueled demand for safe-haven assets.
While some members like Waller and Bowman appear open to rate cuts, others remain cautious about lingering inflation risks, adding to market volatility.
Technical Outlook:
Gold maintains bullish momentum above 3365. A break and hold above this pivot supports continuation toward 3375, and if momentum builds, toward 3385 and 3395.
However, any sustained move below 3365 may trigger a bearish correction toward the support zone between 3355 and 3342.
Pivot Line: 3365
Resistance Levels: 3375 · 3385 · 3395
Support Levels: 3355 · 3342
Bias: Bullish above 3365

GOLD - Price can make correction and then bounce upHi guys, this is my overview for XAUUSD, feel free to check it and write your feedback in comments👊
The price has been developing within a broadening wedge formation for some time.
This pattern began after the asset found strong support in the key zone around the $3305 level.
Within this structure, buyers recently pushed the price upwards in a notable impulse wave.
This impulse culminated in a test of the wedge's upper boundary and the resistance area near $3430.
After being rejected from that resistance, the price is now in a corrective decline towards the lower trendline.
I expect that this correction will find its footing on the lower boundary, leading to a rebound and a new rally towards the $3430 resistance.
If this post is useful to you, you can support me with like/boost and advice in comments❤️
Disclaimer: As part of ThinkMarkets’ Influencer Program, I am sponsored to share and publish their charts in my analysis.

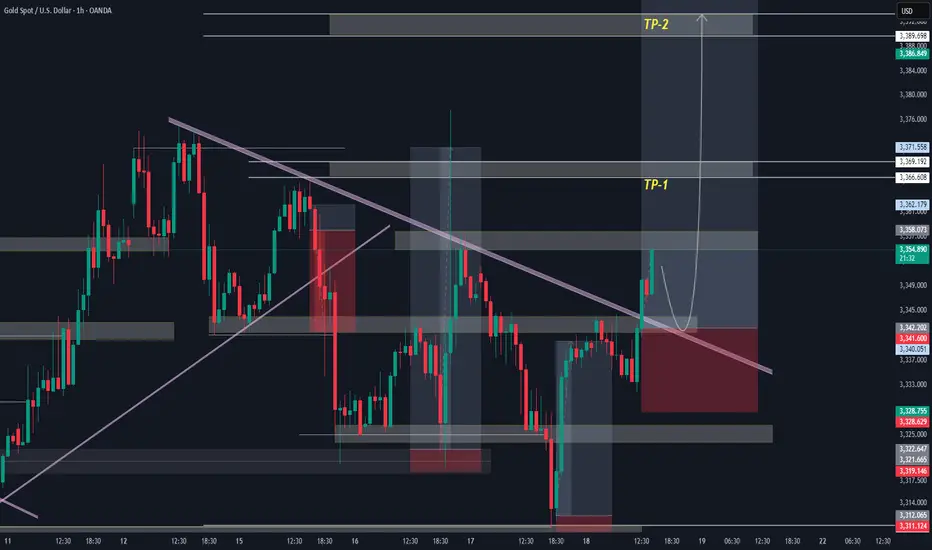
Gold scalp buying opportunity before final dropGold has broken above the mini bull flag formation and is currently sustaining above the structure. The strategy is to patiently await a pullback into the highlighted buy-back zone, where a favorable entry opportunity may present itself. Focus remains on the projected flag targets, as the ongoing momentum suggests promising upside potential. Monitor price action closely.

Continued price increase - gold increased to 3450⭐️GOLDEN INFORMATION:
Gold prices climbed for a second straight session on Tuesday, gaining over 0.9% as sliding US Treasury yields continued to weigh on the US Dollar. Investors remained cautious amid lingering uncertainty over upcoming US trade agreements. At the time of writing, XAU/USD is trading at $3,427, having rebounded from an intraday low of $3,383.
Yields on US government bonds have now declined for five consecutive days, pressuring the Greenback—reflected in the softer US Dollar Index (DXY). Heightened speculation that the US and European Union (EU) may fail to secure a trade agreement before the looming August 1 deadline has intensified demand for safe-haven assets. As a result, gold surged to a five-week high of $3,433.
⭐️Personal comments NOVA:
Gold price continues to increase, FOMO from the market is good and positive. Heading towards 3450
⭐️SET UP GOLD PRICE:
🔥SELL GOLD zone: 3449- 3451 SL 3456
TP1: $3435
TP2: $3422
TP3: $3405
🔥BUY GOLD zone: $3380-$3378 SL $3373
TP1: $3390
TP2: $3400
TP3: $3415
⭐️Technical analysis:
Based on technical indicators EMA 34, EMA89 and support resistance areas to set up a reasonable BUY order.
⭐️NOTE:
Note: Nova wishes traders to manage their capital well
- take the number of lots that match your capital
- Takeprofit equal to 4-6% of capital account
- Stoplose equal to 2-3% of capital account

Gold prices under selling pressure from tariff policy⭐️GOLDEN INFORMATION:
Gold price (XAU/USD) stays under pressure during Thursday's Asian session, extending the sharp pullback from its highest level since June 16 seen the previous day. Optimism surrounding global trade continues to build, fueled by reports that the United States and the European Union (EU) are nearing a tariff agreement, following progress in the US-Japan trade deal. This upbeat sentiment has dampened safe-haven demand and is a major factor weighing on gold prices.
⭐️Personal comments NOVA:
Gold price adjusted down, broke support, faced selling pressure again, accumulated below 3400
⭐️SET UP GOLD PRICE:
🔥SELL GOLD zone: 3400- 3402 SL 3407
TP1: $3390
TP2: $3380
TP3: $3370
🔥BUY GOLD zone: $3356-$3354 SL $3349
TP1: $3365
TP2: $3373
TP3: $3382
⭐️Technical analysis:
Based on technical indicators EMA 34, EMA89 and support resistance areas to set up a reasonable SELL order.
⭐️NOTE:
Note: Nova wishes traders to manage their capital well
- take the number of lots that match your capital
- Takeprofit equal to 4-6% of capital account
- Stoplose equal to 2-3% of capital account

3380 gold price recovered at the beginning of the week⭐️GOLDEN INFORMATION:
Gold prices (XAU/USD) trade with modest gains around $3,350 in early Asian hours on Monday, supported by persistent uncertainty surrounding global trade negotiations as the US tariff deadline approaches. Lingering concerns over fresh levies are likely to sustain demand for the safe-haven metal. Investors now look ahead to comments from Federal Reserve (Fed) Chair Jerome Powell, scheduled for Tuesday, for clearer policy direction.
On Sunday, US Commerce Secretary Howard Lutnick confirmed that August 1 remains the firm deadline for countries to comply with Washington’s tariff demands. While President Trump’s earlier announcements saw shifting deadlines, the White House now insists this date is final. This cloud of uncertainty continues to bolster gold’s appeal as a hedge in volatile markets.
⭐️Personal comments NOVA:
Gold prices continued to recover last weekend, mainly still accumulating above 3300.
⭐️SET UP GOLD PRICE:
🔥SELL GOLD zone: 3380- 3382 SL 3387
TP1: $3370
TP2: $3360
TP3: $3350
🔥BUY GOLD zone: $3322-$3320 SL $3315
TP1: $3333
TP2: $3345
TP3: $3356
⭐️Technical analysis:
Based on technical indicators EMA 34, EMA89 and support resistance areas to set up a reasonable BUY order.
⭐️NOTE:
Note: Nova wishes traders to manage their capital well
- take the number of lots that match your capital
- Takeprofit equal to 4-6% of capital account
- Stoplose equal to 2-3% of capital account

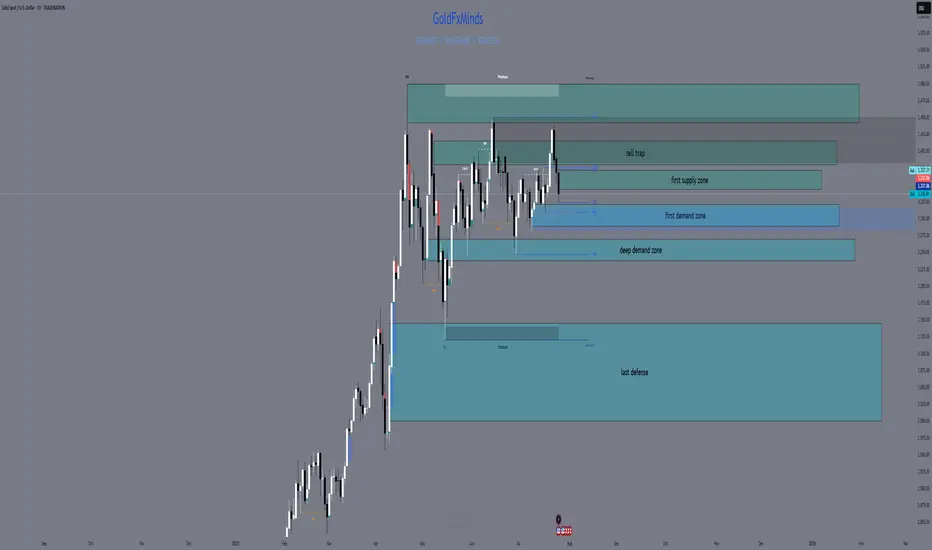
Gold is expected to experience a rebound next week.Gold recently dropped after reacting perfectly inside a higher time frame fair value gap. That zone acted as clean supply, offering a precise close within the imbalance and initiating a strong bearish leg. The move confirmed that buyers were overwhelmed at that level, and price began its descent back into a broader consolidation range.
Support Cluster and Fibonacci Alignment
The current zone being tested holds significant weight. Price has tapped into a clear support region, one that has already caused multiple strong bounces in recent sessions. What adds further confluence is the alignment of this zone with the golden pocket region of the entire upward leg. This kind of technical overlap increases the chances of responsive buying once liquidity is cleared below.
Liquidity Target and Inducement Setup
Just below current price action, there's a clean low that hasn't been taken out yet. This low acts as the inducement, sitting right above deeper Fibonacci levels, especially the 0.702. If price continues lower in the short term, a sweep of that low into the golden pocket would provide the ideal liquidity grab before a reversal. The market often rewards those who wait for that final flush.
Bullish Recovery Path
Once the liquidity is taken and price stabilizes at the golden pocket zone, the path is open for a recovery move back into the midrange and potentially higher. The most likely magnet for price after a successful bounce would be the previous resistance zone, which coincides with the 0.5 retracement of the recent drop. That area should act as the next decision point and could either cap the rally or provide the base for a continuation if buyers show strength.
What I’m Watching
The cleanest scenario would be a sweep of the low just below support, ideally pushing into the lower green box near the 0.702 level, followed by a strong bullish reaction. I’ll be watching for a market structure shift on the lower timeframes at that point to confirm the entry. If that happens, the trade has room to develop back into the prior resistance zone, offering a solid range for intraday or swing setups.
Conclusion
Gold remains in a broader range for now, but the technicals suggest one more drop to clear late long positions before a recovery. The reaction at the support cluster will be crucial. If bulls step in after the sweep, there’s a high-probability path back toward resistance, with the move likely supported by the golden pocket confluence.

XAUUSD (1H Time frame) Read the captionXAU/USD Analysis (1H Timeframe )
This chart represents the XAU/USD (Gold vs US Dollar) price movement on a 1-hour timeframe, showcasing a well-defined ascending channel. The analysis highlights three critical zones:
1. Resistance Level (Upper Blue Zone):
This zone, located around the $3,440 - $3,450 range, marks the potential upper limit of the current bullish channel. A breakout above this level could indicate strong bullish momentum continuation.
2. Key Support Breakout Zone (Middle Purple Zone):
Around the $3,390 - $3,400 range, this area previously acted as resistance and now serves as a key support level. A price retest and bounce from this zone could confirm it as a new support base, potentially triggering a move toward the resistance zone again.
3. Support Level (Lower Purple Zone):
Found near the $3,320 level, this is the broader trendline and horizontal support zone that would be critical if the price breaks below the key support area. It acts as a major demand zone within the ascending channel.
Observations:
The price is currently in a strong uptrend within the rising channel.
A retest of the key support breakout zone is anticipated before potentially pushing higher toward resistance.
A breakdown below the key support could trigger a move toward the lower support level.
Technical Bias:
Bullish as long as the price remains above the key support level.
Bearish reversal may occur on a confirmed breakdown below the ascending channel and lower support zone.

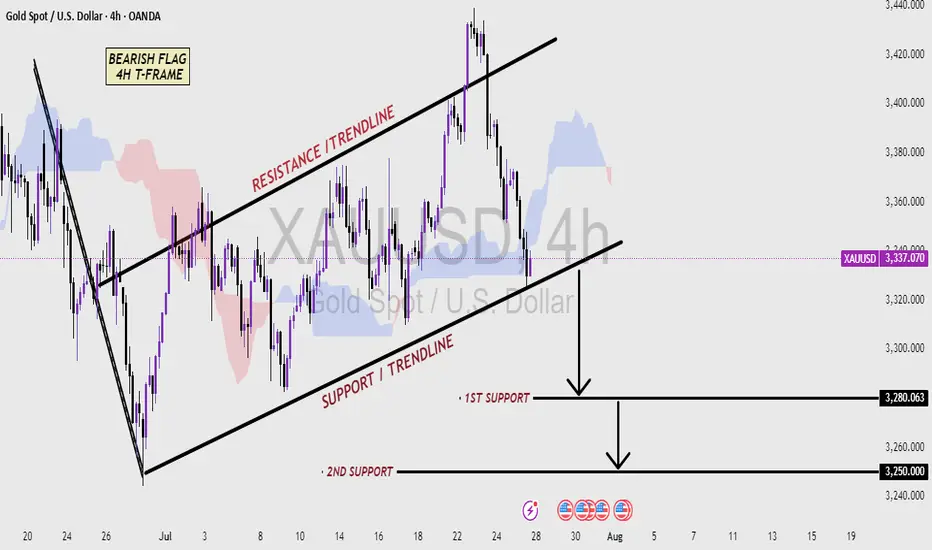
XAUUSD 4H CHART - Bearish pattern Analysis (read the caption)📉 XAUUSD 4H Chart – Bearish Flag Pattern Analysis
This 4-hour chart of Gold (XAUUSD) shows a classic Bearish Flag pattern, which is typically a continuation signal in a downtrend. After a strong bearish move, price entered a consolidation phase inside a rising channel, forming higher highs and higher lows—this creates the flag structure.
The price is currently trading within the Resistance and Support Trendlines of the flag. A break below the Support Trendline would confirm the bearish flag breakout, suggesting a continuation of the downtrend.
Key support levels to watch:
🔻 First Support: 3280.063 – Initial target after breakout
🔻 Second Support: 3250.000 – Extended target if bearish momentum continues
Traders should monitor for a confirmed breakdown with volume and bearish candlestick confirmation to validate short entries. This setup favors sellers if the support breaks decisively.
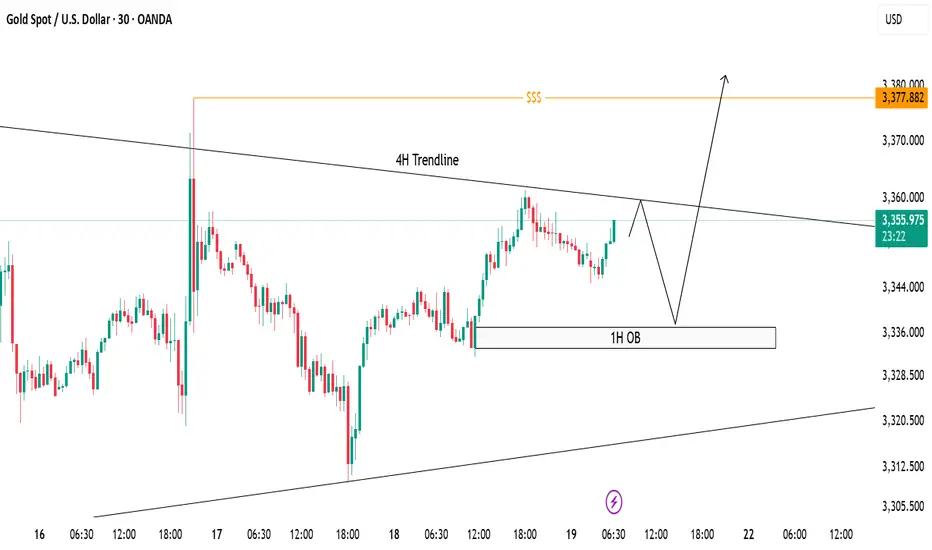
XAUUSD Trade Idea - 30m Structure with 4H ConfluenceCurrently, price is trading below the 4H descending trendline, respecting bearish structure on lower timeframe (30m).
✅ 1H Order Block (OB) marked between 3335-3340 remains a strong demand zone where price can bounce break the trendline to sweep liquidity above around 3377 to form bullish continuation.
📌 Scenarios I'm Watching:
Short-term rejection from the 4H trendline.
Potential reversal towards 1H OB.
Bullish reaction from OB could trigger a breakout above the 4H trendline.
Final upside target remains at the liquidity pool around 3377 zone ($$$).
🟣 Overall Bias: Bullish after liquidity sweep. Watching for bullish confirmation at OB before executing buys.
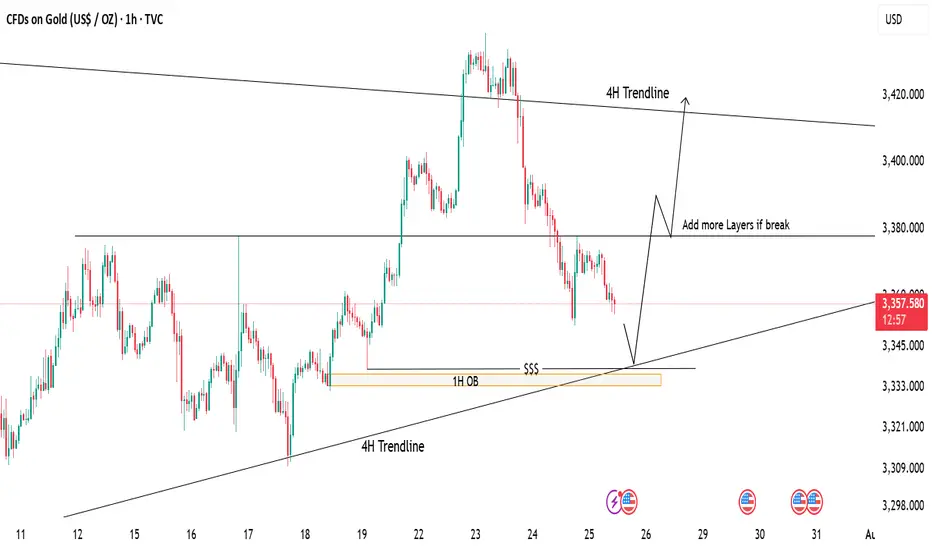
Gold Tapping Into Major Support – Eyes on Bullish ReversalPrice is currently retracing after a strong drop from recent highs. We're now approaching a key demand zone, aligning with:
📍 1H Order Block (OB)
📍 4H Trendline Support
📍 Liquidity Zone ($$$)
📉 If price taps into this area, it may offer a high-probability long setup.
📈 First target: 3380 (mid-range resistance)
🧱 If this breaks, we can look to scale in/add more positions, targeting the 4H trendline zone near 3420.
⚠️ Waiting for price reaction at support – patience is key!
GOLD ( XAUUSD ): Watching For A Short Term Buy ConfirmationIn this Weekly Market Forecast, we will analyze the Gold (XAUUSD) for the week of July 21-25th
Gold has been in consolidation for a couple of weeks now. The price action hasn't allowed for very many FVGs... until last week. There is a +FVG I am keeping an eye on, as it will be very telling how price reacts to it upon contacting this POI.
If it holds, higher prices will ensue.
If it fails, to the lows of the consolidation we go.
We'll soon see how it plays out.
Enjoy!
May profits be upon you.
Leave any questions or comments in the comment section.
I appreciate any feedback from my viewers!
Like and/or subscribe if you want more accurate analysis.
Thank you so much!
Disclaimer:
I do not provide personal investment advice and I am not a qualified licensed investment advisor.
All information found here, including any ideas, opinions, views, predictions, forecasts, commentaries, suggestions, expressed or implied herein, are for informational, entertainment or educational purposes only and should not be construed as personal investment advice. While the information provided is believed to be accurate, it may include errors or inaccuracies.
I will not and cannot be held liable for any actions you take as a result of anything you read here.
Conduct your own due diligence, or consult a licensed financial advisor or broker before making any and all investment decisions. Any investments, trades, speculations, or decisions made on the basis of any information found on this channel, expressed or implied herein, are committed at your own risk, financial or otherwise.

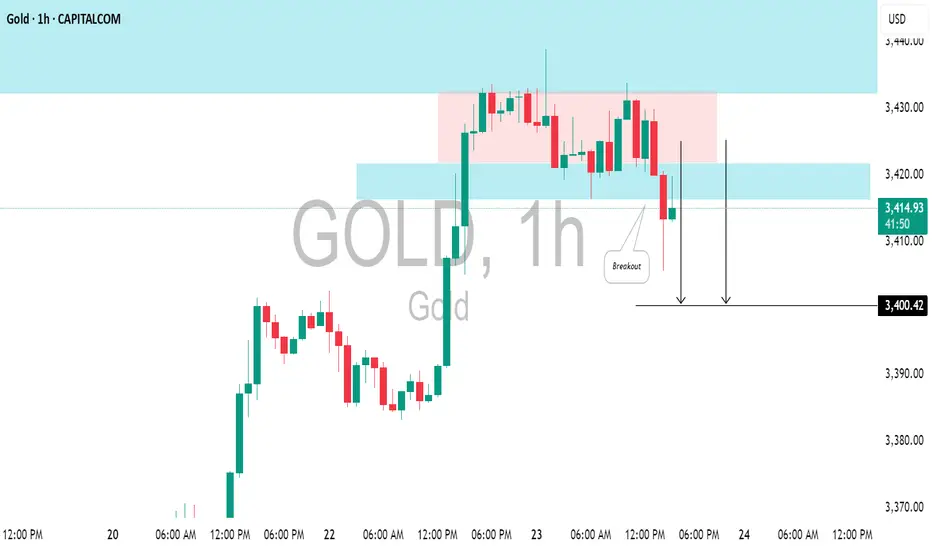
GOLD(#XAUUSD): Pullback From Resistance ConfirmedGOLD could retreat from the highlighted resistance level.
I observed a horizontal trading range pattern following a test of significant intraday resistance, along with a breach of its support level marked by a strong bearish candle.
Target - 3400.
Lingrid | GOLD Weekly Market Outlook: Resistance Zone RejectionOANDA:XAUUSD markets have encountered significant resistance at the $3,450 level, resulting in a notable rejection and subsequent pullback toward support zones. The precious metal is now testing critical technical levels that will determine whether the broader bullish momentum can be sustained or if deeper correction is imminent.
The 4H chart reveals a clear level rejection at the resistance zone, followed by an impulse leg lower that has broken the upward trendline. This development suggests a potential shift in short-term momentum, with gold now trading within the consolidation zone between $3,365 and $3,285. The break of the ascending trendline is particularly significant, indicating that bulls may be losing control of the immediate price action.
The second chart provides valuable context with the weekly and 16-hour timeframe analysis. The pinbar rejection candle on the weekly chart confirms strong selling pressure at these elevated levels. The 16-hour chart shows multiple tests of the upward trendline, with the recent break potentially signaling a bearish impulse leg. However, the overall structure remains within the broader ascending channel, suggesting this could be a healthy correction within the long-term uptrend.
Critical levels to monitor include the $3,285 support zone and the broken trendline at $3,365. A decisive break below $3,285 could trigger a deeper correction toward $3,200, while reclaiming the upward trendline would restore bullish momentum toward new highs.
If this idea resonates with you or you have your own opinion, traders, hit the comments. I’m excited to read your thoughts!

XAUUSD analysis - 1H FVG and OB setupsOn the 1H timeframe, price is reacting as it approaches the HTF high zone (3430-3450) and is currently pulling back.
The 1H FVG zones at:
🔹 3400
🔹 3368
and the 1H OB around 3350 are key areas we are watching for potential long entries.
📌 Plan:
We will wait for price to pull back into one of these 1H FVG/OB zones and look for entry confirmations on the 5M or 3M timeframe to go long.
🎯 Targets: 3430 – 3440 – 3450
❌ No sell setup for now unless a clear structure break happens.

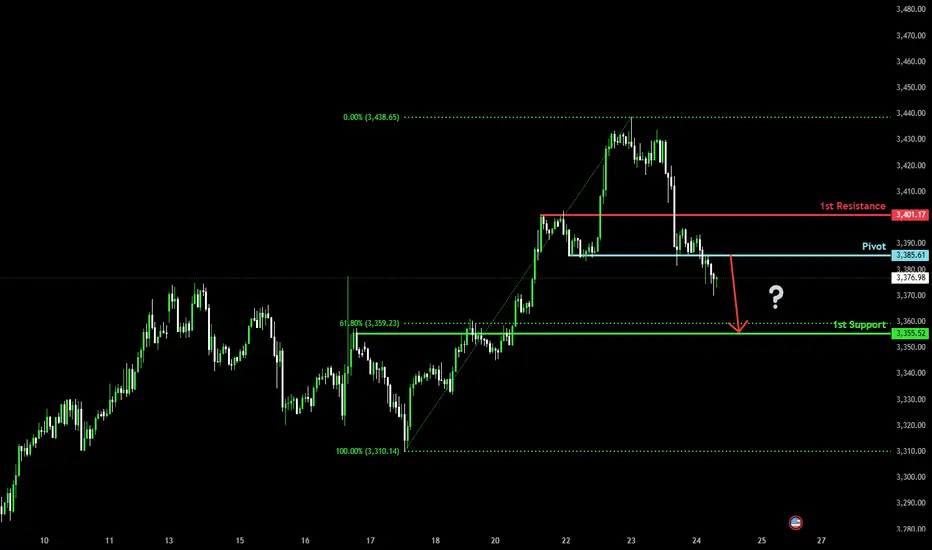
Bearish drop?The Gold (XAU/USD) has reacted off the pivot and could potentially drop to the 1st support, which is a pullback support that is slightly below the 61.8% Fibonacci retracement.
Pivot: 3,385.61
1st Support: 3,355.52
1st Resistance: 3,401.17
Risk Warning:
Trading Forex and CFDs carries a high level of risk to your capital and you should only trade with money you can afford to lose. Trading Forex and CFDs may not be suitable for all investors, so please ensure that you fully understand the risks involved and seek independent advice if necessary.
Disclaimer:
The above opinions given constitute general market commentary, and do not constitute the opinion or advice of IC Markets or any form of personal or investment advice.
Any opinions, news, research, analyses, prices, other information, or links to third-party sites contained on this website are provided on an "as-is" basis, are intended only to be informative, is not an advice nor a recommendation, nor research, or a record of our trading prices, or an offer of, or solicitation for a transaction in any financial instrument and thus should not be treated as such. The information provided does not involve any specific investment objectives, financial situation and needs of any specific person who may receive it. Please be aware, that past performance is not a reliable indicator of future performance and/or results. Past Performance or Forward-looking scenarios based upon the reasonable beliefs of the third-party provider are not a guarantee of future performance. Actual results may differ materially from those anticipated in forward-looking or past performance statements. IC Markets makes no representation or warranty and assumes no liability as to the accuracy or completeness of the information provided, nor any loss arising from any investment based on a recommendation, forecast or any information supplied by any third-party.
HelenP. I Gold can continue to decline to support zoneHi folks today I'm prepared for you Gold analytics. If we look at the price chart, we can observe a significant shift in the market structure, highlighted by the recent decisive break of a long-standing ascending trend line. This event suggests that the previous bullish momentum has been exhausted and that sellers are now taking control. The bearish case is further strengthened by the price trading below the key horizontal zone around 3375, which previously acted as support during the consolidation phase and is now poised to act as strong resistance. My analysis for a short position is built on this structural change. I believe that any attempt by the price to rally back towards the broken trend line or the 3375 resistance zone will likely be met with significant selling pressure, confirming the new downward trend. A rejection from this area would be the key condition validating the bearish bias. Therefore, the primary goal for this developing downward impulse is set at the 3305 level, as this aligns with the next major support zone where the price is likely to find its next pause. If you like my analytics you may support me with your like/comment.❤️
Disclaimer: As part of ThinkMarkets’ Influencer Program, I am sponsored to share and publish their charts in my analysis.
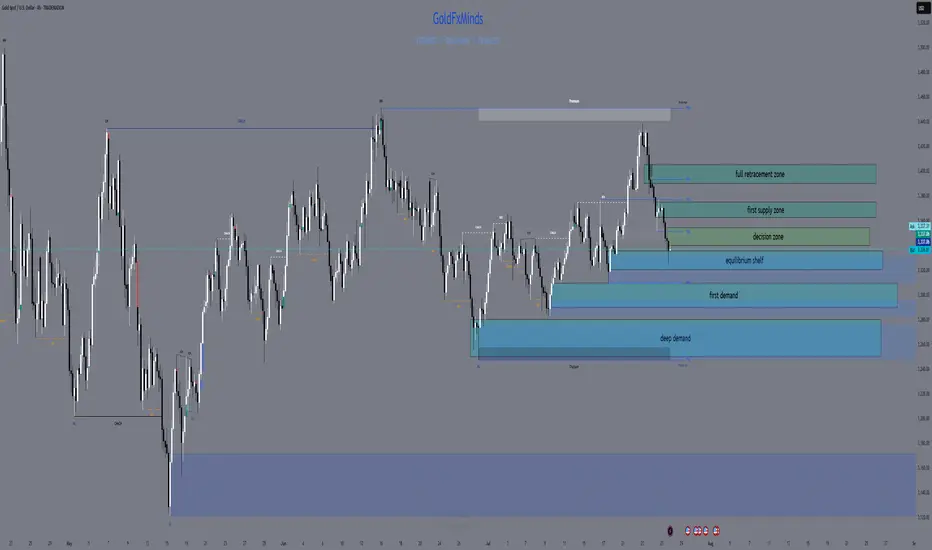
XAUUSD H4 Outlook – “Fed Week: Only the Real Zones”Hello, gold traders!
FOMC week is here, the dollar’s flexing, and gold is stuck under a fortress of supply. No fantasy, no overlaps, just your real, actionable H4 map—zones spaced, logic tight, and all fluff deleted.
⬜Bias:
Neutral to bearish while price is capped under 3,355 and the EMA cluster.
Only flip bullish if price closes and holds above 3,375 with strong confirmation after news.
Current Price: 3,336.81
Summary for your audience:
Neutral–bearish: All the EMAs (21/50/100/200) are overhead, and the primary supply and decision zones are blocking any upside.
No reason to flip bullish unless gold breaks out and holds above both the decision zone and the full supply ceiling after major news.
All bounces into supply are likely to get faded, unless the structure changes dramatically post-FOMC.
🟥 ULTRA SUPPLY ZONE: 3,390 – 3,405
127–161.8% Fib extension—liquidity grab and stop-hunt target for news-driven spikes
Only short if you see a monster upper wick and hard rejection
🟥 PRIMARY SUPPLY: 3,365 – 3,375
All EMAs (21/50/100/200) are stacked overhead; unfilled FVG at 3,370–3,375
Short on a clear rally rejection or bearish engulfing candle—this is where most breakouts get trapped
🔶 DECISION ZONE: 3,340 – 3,355
EMA100/200 straddle this level; small FVG at 3,350–3,352
Market “decides” here—fade unless price closes decisively above 3,355
🔵 EQUILIBRIUM SHELF: 3,320 – 3,335
50% Fib at 3,327; filled FVG at 3,325–3,330; SMA50 just below
Bounce/fake-break zone—wait for a clean H4 reversal, not a guess
🟢 FIRST DEMAND BASE: 3,290 – 3,310
H4 Order Block, hidden FVG (3,300–3,305), Fib 38.2% around 3,295
Longs only with strong pin-bar/engulf and quick EMA50 reclaim
🔵 DEEP PULLBACK BAY: 3,250 – 3,280
Weekly EMA21 and 61.8% Fib (~3,260), strong volume
Only consider a long on a panic flush and a powerful reversal wick
⚡️ MACRO CONTEXT
USD: On fire into ADP and FOMC; gold moves will be explosive, not logical
Events:
Tue: ADP
Wed: FOMC + Powell
Thu: Core PCE
Fri: NFP, ISM
Bias: Neutral-bearish under 3,355; only bullish if we close and hold above 3,375
EMAs: Clustered tightly overhead—bulls get no respect until this ceiling is crushed
🎯 TRADE LOGIC
Shorts:
3,390–3,405 (big wicks and clear rejection only)
3,365–3,375 (news spike or failed breakout with bearish candle)
Longs:
3,340–3,355 (only on a confirmed close above)
3,320–3,335 (strong reversal only—don’t front run)
3,290–3,310 (classic H4 pin-bar/engulf + EMA50 reclaim)
3,250–3,280 (deep panic flush and major reversal only)
NO TRADE: In the gaps—let the gamblers get chewed up, not you.
💬 Which zone will you snipe? Drop a comment and show you’re here for structure, not noise!
👍 Like & Follow for high-value, real-time sniper maps every day.
Disclosure: Chart via Trade Nation’s TradingView feed. Influencer Program participant.
GoldFxMinds 💛