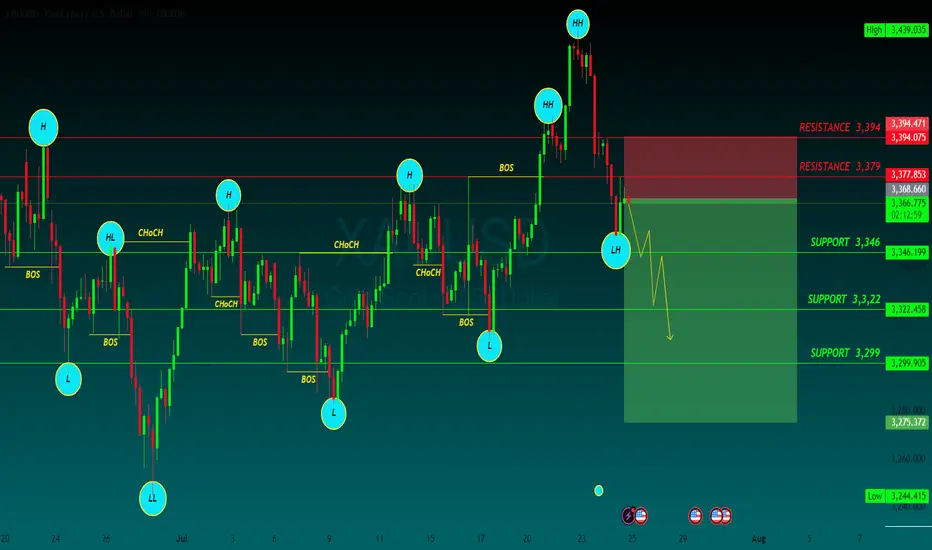
GOLD SELLGold price bears retain control amid fading safe-haven demand, rebounding USD
US President Donald Trump announced late Tuesday that his administration had reached a trade deal with Japan. Furthermore, reports that the US and the European Union are heading towards a 15% trade deal boost investors' confidence and weigh on the safe-haven Gold price for the second straight day on Thursday.
The markets do not expect an interest rate cut from the US Federal Reserve in July despite Trump's continuous push for lower borrowing costs. In fact, Trump has been attacking Fed Chair Jerome Powell personally over his stance on holding rates and repeatedly calling for the central bank chief's resignation.
Moreover, Fed Governor Chris Waller and Trump appointee Vice Chair for Supervision Michelle Bowman have advocated a rate reduction as soon as the next policy meeting on July 30. This keeps the US Dollar depressed near a two-and-a-half-week low and could offer some support to the non-yielding yellow metal.
Traders now look forward to the release of flash PMIs, which would provide a fresh insight into the global economic health and influence the safe-haven commodity. Apart from this, the crucial European Central Bank policy decision might infuse some volatility in the markets and drive the XAU/USD pair.
Meanwhile, the US economic docket features Weekly Initial Jobless Claims and New Home Sales data, which, in turn, would drive the USD and contribute to producing short-term trading opportunities around the commodity. Nevertheless, the fundamental backdrop warrants caution for aggressive traders.
SUPPORT 3,346
SUPPORT 3,322
SUPPORT 3,399
RESISTANCE 3,394
RESISTANCE 3,379
XAUUSDK trade ideas
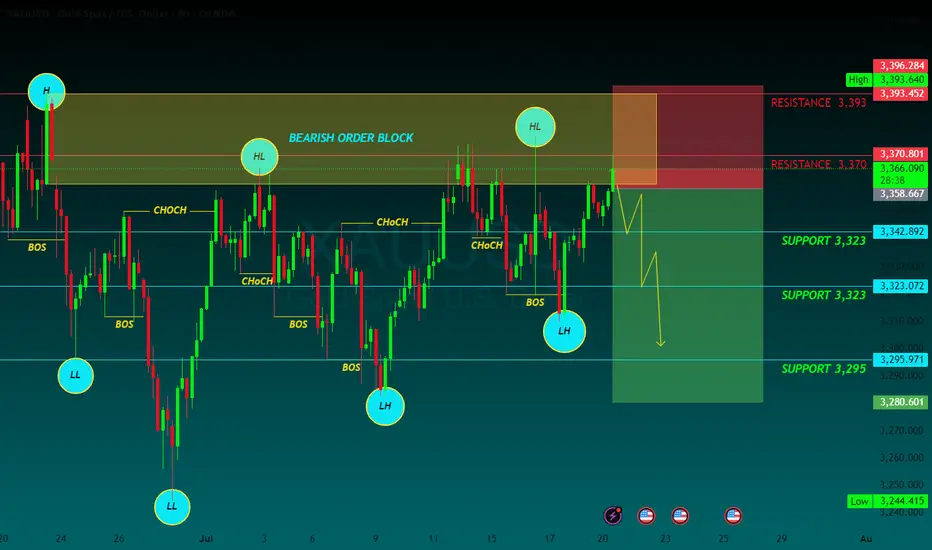
GOLD SELLGold price remains confined in a multi-week-old range as bulls seem reluctant
Gold price attracts some safe-haven flows amid persistent trade-related uncertainties. Mixed Fed rate cut cues keep the USD depressed and further benefit the XAU/USD pair. The range-bound price action warrants some caution before placing fresh bullish bets.
In the Forex market, Gold functions as a currency. The particularity of Gold is that it is traded against the United States Dollar (USD), with the internationally accepted code for gold being XAU.
Known as a safe-haven asset, Gold is expected to appreciate in periods of market volatility and economic uncertainty. Gold is also widely seen as a hedge against inflation and against depreciating currencies as it doesn’t rely on any specific issuer or government.
Central banks are the biggest Gold holders. In their aim to support their currencies in turbulent times, central banks tend to diversify their reserves and buy Gold to improve the perceived strength of the economy and the currency. The United States is the country that holds the biggest resources of Gold in the world.
1 SUPPORT 3,323
2 SUPPORT 3,323
3 SUPPORT 3,295
1 RESISTANCE 3,370
2 RESISTANCE 3,393
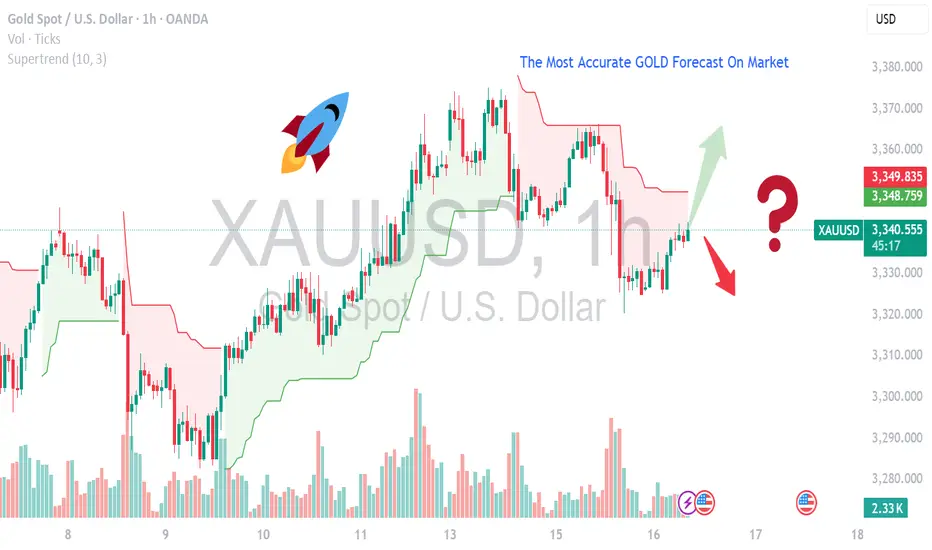
GOLD BULLISH IN 1HR TIME FRAME GOLD followed the same pattern from its previous data and will be going for the ATH

MOST ACCURATE XAUUSD GOLD FORECAST ANALYSIS MARKETCurrent Setup & Technical Outlook
Consolidation & Pennant Formation: Gold is building a bullish pennant and trading above its 50‑day MA — a classic continuation pattern suggesting a breakout toward new highs if momentum resumes .
Key Levels:
Support: $3,330–3,340 — confirmed by multiple technical sources .
Resistance/Breakout Zone: $3,360–3,375 — clearing this could trigger a rally toward $3,400+ .
Upside Targets: $3,390, then possibly $3,500–$3,535 per weekly forecast .
Alternate Bearish Scenario: A failure around the 0.618 Fibonacci resistance (~$3,374) and overbought RSI could spark a pullback to $3,356 or lower .
---
🧠 Fundamental Drivers
Inflation & U.S. Macro Data: Market awaits June CPI/PPI and Fed commentary — cooler inflation could boost gold via dovish expectations, while hotter data may strengthen the USD and weigh on bullion .
Geopolitical & Safe-Haven Demand: Trade tensions (e.g., tariffs) are keeping gold elevated near $3,350–$3,360 .
Central Bank & Real Yields Watch: Continued gold purchases and lower real rates are supportive, although mid-term easing in risks (like global trade) could curb momentum .
XauusdThe price enters the supply zone and the possibility of the gold price falling to the specified range

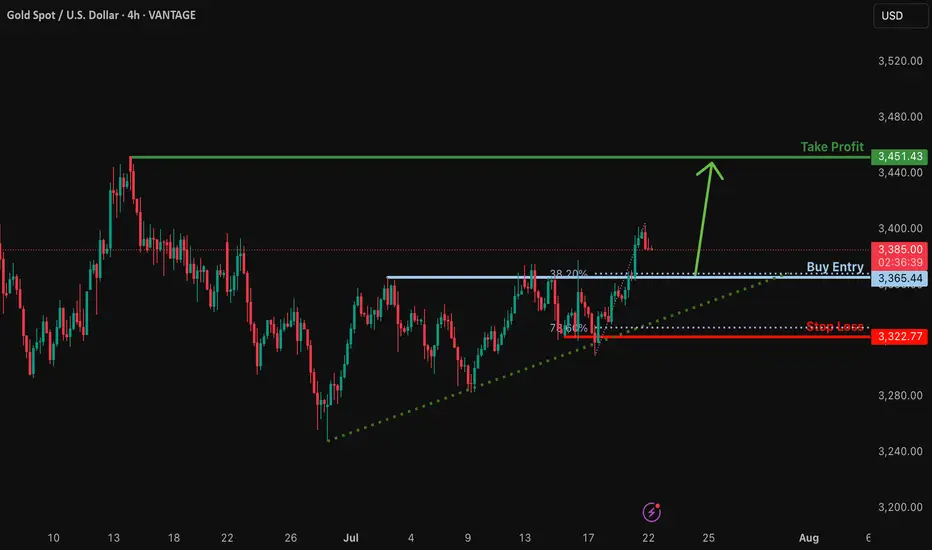
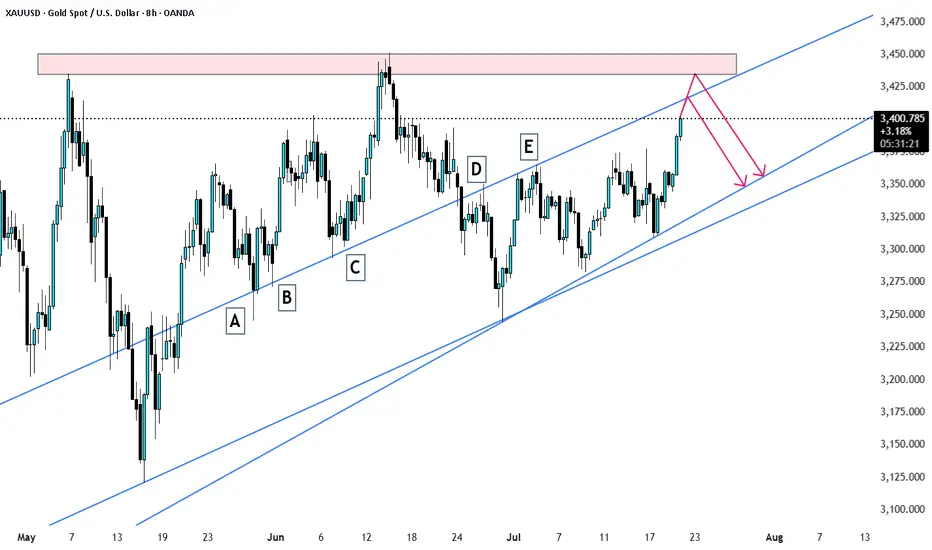
Bullish bounce off major support?The Gold (XAU/USD) is falling towards the support level which is a pullback support and could bounce from this level to our take profit.
Entry: 3,365.44
Why we like it:
There is a pullback support that lines up with the 38.2% Fibonacci retracement.
Stop loss: 3,322.77
Why we like it:
There is a pullback support that is slightly below the 78.6% Fibonacci retracement.
Take profit: 3,451.43
Why we like it:
There is a pullback resistance.
Enjoying your TradingView experience? Review us!
Please be advised that the information presented on TradingView is provided to Vantage (‘Vantage Global Limited’, ‘we’) by a third-party provider (‘Everest Fortune Group’). Please be reminded that you are solely responsible for the trading decisions on your account. There is a very high degree of risk involved in trading. Any information and/or content is intended entirely for research, educational and informational purposes only and does not constitute investment or consultation advice or investment strategy. The information is not tailored to the investment needs of any specific person and therefore does not involve a consideration of any of the investment objectives, financial situation or needs of any viewer that may receive it. Kindly also note that past performance is not a reliable indicator of future results. Actual results may differ materially from those anticipated in forward-looking or past performance statements. We assume no liability as to the accuracy or completeness of any of the information and/or content provided herein and the Company cannot be held responsible for any omission, mistake nor for any loss or damage including without limitation to any loss of profit which may arise from reliance on any information supplied by Everest Fortune Group.
XAUUSD Expecting bullish Movement Gold is currently testing a strong demand zone between 3340 to 3335, which previously acted as a support area. The price action indicates potential for a bullish reversal from this zone, supported by oversold conditions and historical reaction levels.
Entry Zone: 3340 to 3335
First Target: 3375
Second Target: 3390
Two potential scenarios are highlighted:
A direct bullish reversal from the 3340–3335 zone
A slight consolidation before continuation to the upside
This setup offers a favorable risk-to-reward opportunity for intraday or short-term swing traders. Monitor price action confirmation signals before entering

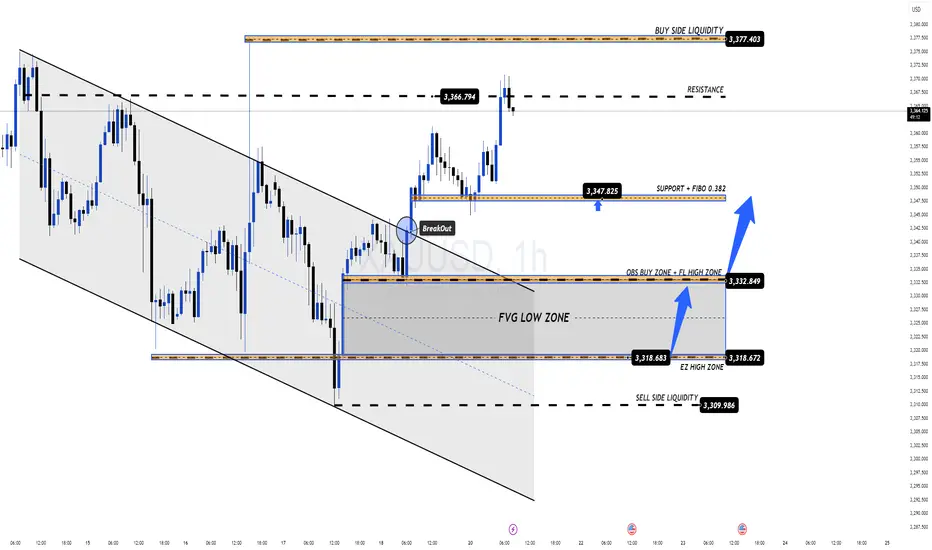
QUIET START TO THE WEEK, WATCH OUT FOR KEY RESISTANCE!🔔 GOLD PLAN 21/07 – QUIET START TO THE WEEK, WATCH OUT FOR KEY RESISTANCE!
🌍 Market Overview
Gold has bounced back strongly following a brief pullback late last week. The move comes as geopolitical tensions and global conflicts continue to escalate.
While this week may not feature high-impact economic data, macroeconomic risks and global uncertainty remain the primary drivers of price action.
📊 Technical Outlook
Price is currently approaching a strong resistance zone between 3377–3380, which aligns with a Buy Side Liquidity region.
💡 Sellers may step in here to push the price lower, aiming to fill FVG zones (Fair Value Gaps) left behind during the previous bullish rally.
⚠️ Entering SELL positions at this level is risky — only act upon confirmed reversal signals (candlestick rejection or volume-based confirmation).
🎯 Trade Setup
🟢 BUY ZONE: 3331 – 3329
Stop Loss: 3325
Take Profits:
3335 → 3340 → 3344 → 3348 → 3352 → 3358 → 3364 → 3370
🔴 SELL ZONE (confirmation required): 3377 – 3379
Stop Loss: 3383
Take Profits:
3372 → 3368 → 3364 → 3360 → 3350
📌 Key Notes
The 3347 zone acts as short-term support for bulls. If this level breaks, a move toward lower FVG liquidity zones becomes more likely.
Keep an eye on EU session volume for clearer short-term direction and better trade timing.
✅ Final Thoughts
Discipline is key. Stick to your TP/SL strategy to manage risk effectively during early-week volatility.
🛡️ Wishing everyone a successful start to the week. Stay patient, stay focused.
GOD BLESS ALL!
XAUUSD swing is ready Gold is currently still holding rising channel we were on sell throughout today and achieved with 180 PIPs TP Hit now I'm going to take Buy trade at 3350-3340 zone
What's possible scanarios we have?
▪️I'm gonna take buy trade from 3340-3350 area by following our rising Trend along with structural liquidity sweeps strategy, my target will be 3365 then 3378 in extension.
▪️if H4 candle closing below 3335 this Parallel moves will be invalid and don't look for buy till confirmation

Gold Buys - Swing TradingGold is projected to retrace to 3340 and later push up to clear the buy side liquidities above, which are the monthly highs. Trade with good risk management

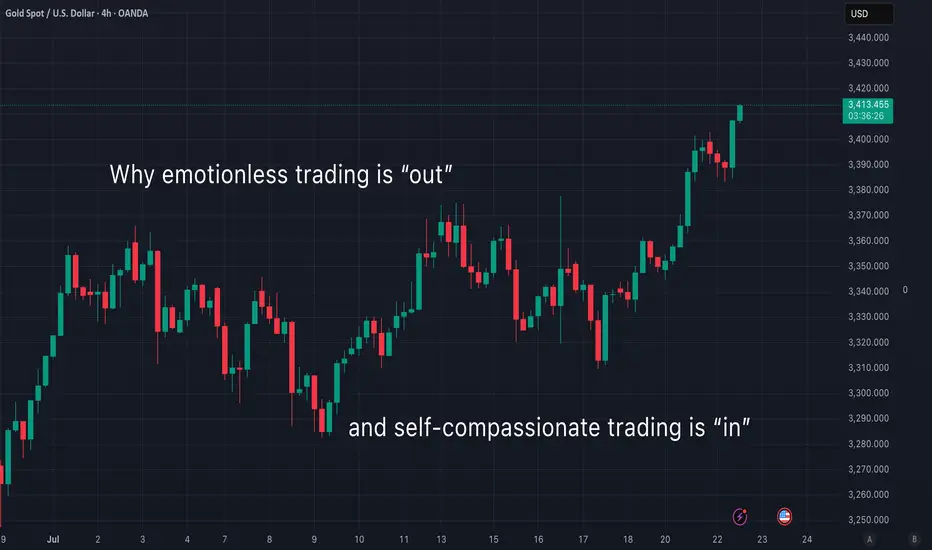
Why emotionless trading is out (and what to do instead)Curious about what self-compassionate trading really means?
Let’s do a little thought experiment together. Imagine you just closed a losing trade. You’re feeling disappointed and unmotivated. You invite two friends over to your home and tell them what happened. Which friend would you rather talk to?
🙋🏽♀️ Friend 1 says:
"What a failure you are. Why were you even stressed out? That’s so silly. Couldn’t you see this trade was going to be a loss? You should just give up—what’s the point of trying? I don’t understand how you could mess up the way you did. Let’s spend the afternoon going through everything you did wrong."
...Or would you prefer:
🙋🏽♀️ Friend 2 who says:
"I can see you’re feeling sad and disappointed about that last trade. I’m really sorry it didn’t go your way. But you know what? Losses are a part of trading—we all go through them. You’ll have another chance tomorrow. I can tell you’re doing your best. Let’s do something kind for ourselves today, and tomorrow you’ll get back to it. Don’t give up—I’m proud of you for chasing your dreams."
🤔 So, who would you choose?
I know this little experiment might sound a bit dramatic—but be honest, wouldn’t we all prefer Friend 2 ? And isn’t Friend 1 sounding suspiciously like that inner critic of yours?
For the longest time, trading advice has told us to "get rid of emotions" and stay completely “stress-free.” I wish it were that simple…
The truth is, trying to trade without emotions is like talking to yourself like Friend 1 . Not only is it impossible —it also builds a harsh, critical inner dialogue that damages both your confidence and motivation.
The reality is: we don’t have full control over our thoughts and emotions. They show up whether we want them to or not. If we could choose our emotional state, we’d all stay calm and focused every time we trade. But that’s not how the human mind works.
Instead of fighting our emotions, we can learn to open up to them—without judgment.
Self-compassionate trading means treating yourself like Friend 2 . It’s about acknowledging when things are tough, and being kind to yourself when stress or anxiety shows up. It’s about replacing harsh self-talk with encouragement, warmth and understanding.
👩🏽🔬 Some people think self-compassion is soft, ”girly”, or even “too emotional.” But guess what? It’s backed by tons of solid research. Studies show that self-compassion helps reduce self-criticism and improve motivation. It’s also an effective tool for managing tough emotions and reducing stress and anxiety.
Self-compassionate trading is a win-win approach—it helps you stay grounded and resilient while building a meaningful trading journey. So why not give it a try? 👇
💡 Pro Tip:
Next time you close a losing trade, find yourself in a losing streak, or just feel anxious about your performance—ask yourself:
“What would I say to a good friend who’s going through the same thing?”
Then offer that same kindness and support to yourself.
Happy (self-compassionate) trading! 💙
/ Tina the Trading Psychologist
Gold Takes Flight, But Will Support Hold? Watch This Zone!Gold has broken its key resistance level in the New York session and, at the same time, has taken support from the trend line, which is pushing it upward. Currently, however, gold has also broken through another minor support level, and we can now observe that it is pulling back and moving downward.
It is advisable to remain patient at this stage. Wait for the market to come down to the zone where the previous resistance has now turned into support. If the price reacts positively at that level and shows signs of holding, we could potentially see a good buying opportunity from there.
As always, please conduct your own research (DYOR) before making any trading decisions. This is not financial advice.

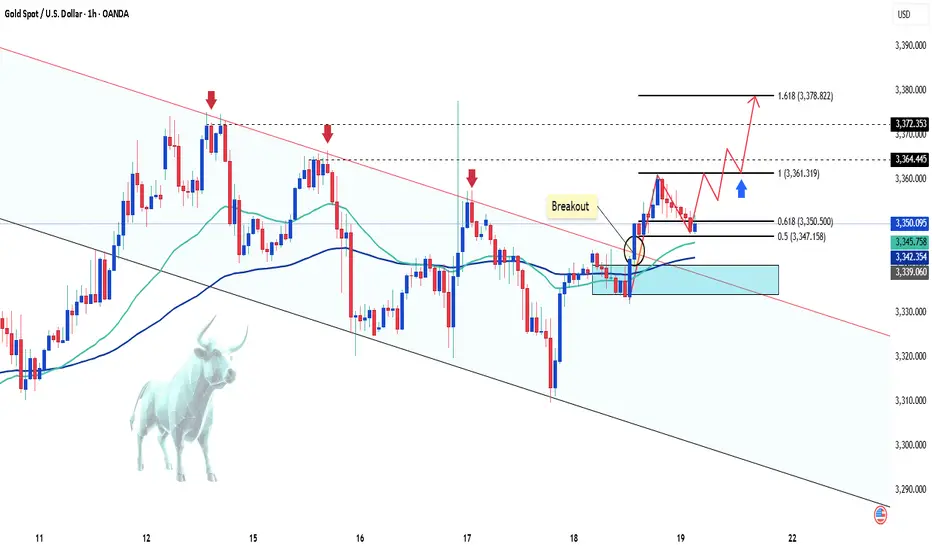
Gold Sees Mild Increase as USD WeakensGold ended Friday's session with a slight increase, regaining the 3350 USD level and recovering over 100 pips by the end of the day.
The weakening of the US Dollar (USD) allowed XAU/USD to rise modestly. Concerns about US President Donald Trump's erratic trade policies and their potential impact on the global economy further supported the precious metal.
In the short term, the technical chart shows gold breaking out of the downward channel and starting an upward wave. The price is currently adjusting at 3350 USD, which coincides with the 0.618 Fibonacci retracement level and the EMA zone, suggesting the potential for further price increases from this level, with targets towards key resistance levels.
Key resistance levels: 3160, 3172, and 3378 USD.
Support zones: 3350, 3340, 3331 USD.

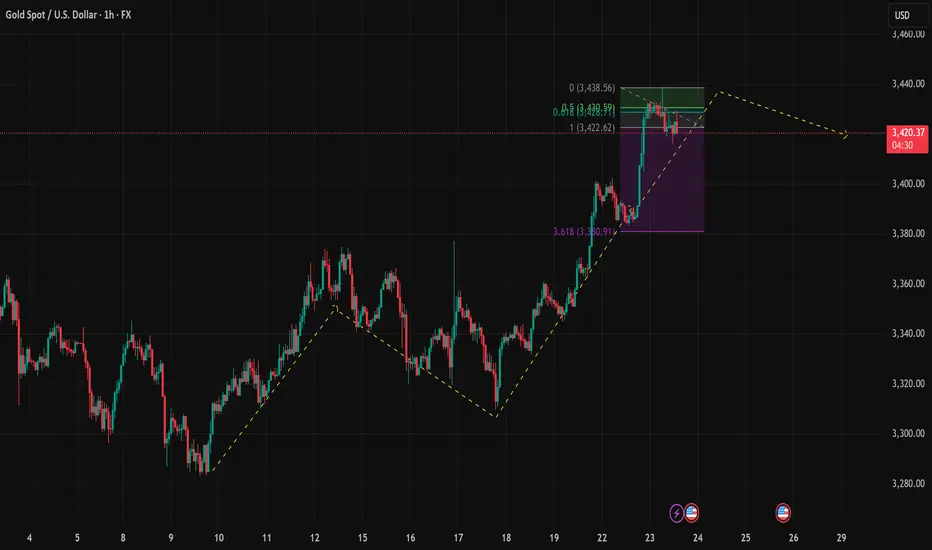
Gold Faces Key Fibonacci Resistance Is the Bullish Momentum FadiTrend Structure: Gold remains in a short-term bullish structure, with a clear series of higher highs and higher lows. However, price action shows signs of hesitation near a critical Fibonacci extension zone.
Key Resistance Zone:
$3,428 – $3,438: This area aligns with the 0.618 Fibonacci extension at 3,428.59 and the 0.0 level at 3,438.56, forming a confluence resistance zone that has started to trigger selling pressure.
Immediate Support Levels:
$3,422.62: The 1.0 Fibonacci extension, serving as the first support on a minor pullback.
$3,408 – $3,410: A potential bounce zone combining short-term trendline support and prior consolidation structure.
Fibonacci & Price Waves: The recent bullish leg from $3,330 to $3,438 has completed a 3.618 extension (noted at $3,330.91 on the purple projection). This increases the probability of a corrective retracement.
EMA & RSI (suggested for confirmation): EMA20 (not shown) should act as a dynamic support. Watch RSI for potential overbought signals or bearish divergence if it crosses above 70.
Trade Setups to Watch: Scenario 1 – Short Setup at Fibonacci Resistance Entry: $3,428 – $3,432, only if price action confirms rejection (e.g., bearish engulfing, pin bar)
Stop Loss: Above $3,438
Take Profit 1: $3,422
Take Profit 2: $3,410 (if trendline breaks)
Scenario 2 – Buy Setup on Pullback Entry: Around $3,408 – $3,410 upon bullish price action confirmation
Stop Loss: Below $3,400
Target: $3,428
Final Thoughts: Gold is approaching a strong resistance zone, and short-term pullback is likely unless bulls break through $3,438 with momentum. Traders should stay patient and wait for confirmation signals before entering. Remember: discipline beats impulse.
Follow for more updated strategies during the US session. Save this idea if you find it helpful! Let’s discuss your view in the comments below.
GOLD NEXT MOVEGold reached the resistance area around 3420 and 3440 and from here a rejection for the correction is possible with target around 3360-3380 before it resume further growth. let us see
Gold - The clear top formation!🪙Gold ( TVC:GOLD ) just created a top formation:
🔎Analysis summary:
Over the past four months, Gold has overall been moving sideways. Following a previous blow-off rally of about +25%, this cycle is very similar to the 2008 bullish cycle. Bulls are starting to slow down which will most likely result in the creation of at least a short term top formation.
📝Levels to watch:
$3.000
🙏🏻#LONGTERMVISION
Philip - Swing Trader

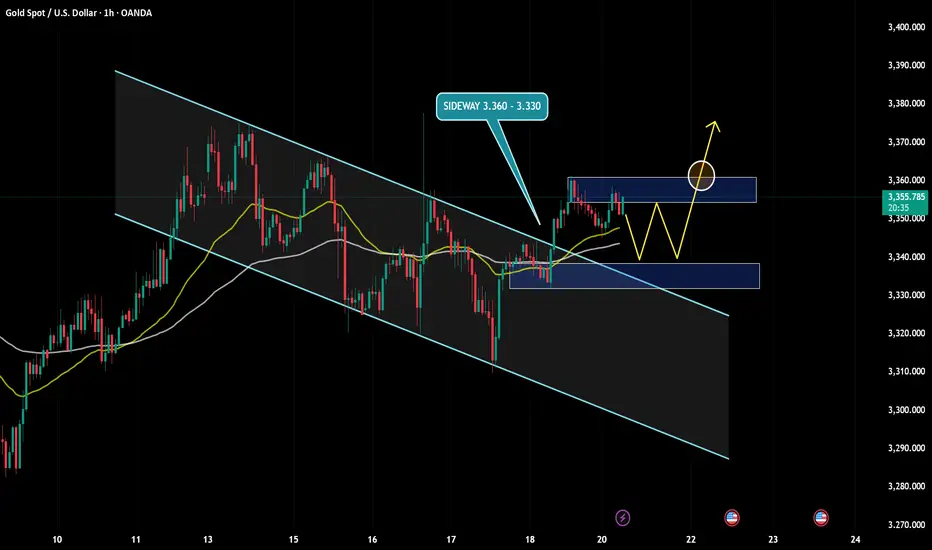
Gold holds steady near resistance – Is a breakout coming?Hello everyone, let’s explore today’s gold market together!
Overall, during the Asian session on Monday, gold traded cautiously, consolidating just below the nearest resistance level at $3,360, with minimal price movement. The uptrend remains strong, primarily driven by a sharp momentum shift last Friday following key news, as the weakening USD reignited investor interest in gold.
Current market sentiment suggests that major institutional funds and retail traders alike are showing renewed attention. As long as the previous support level around $3,330 holds firm, the next move could be a break above the $3,360 resistance, which would likely open the door for further upside expansion.
However, if price breaks below that support zone, I would consider the bullish setup invalid and shift to a wait-and-see approach until clearer signals emerge.
Feel free to share your thoughts in the comments — your perspective could contribute tremendous value to the global TradingView community!
Today's US market focus is 3350
Gold prices continued their decline from the previous session on Thursday, July 24, slipping further below the 3,400 mark as trade tensions eased and risk sentiment rose. Gold's decline today means a second consecutive day of decline as investors turned their attention to more positive trade progress since yesterday. However, gold still received buying support earlier this week, breaking through $3,400 at one point. This round of gains tested key resistance levels on the gold daily chart, but in the end the bears held their ground.
Risk data interpretation!
Investors are currently waiting for U.S. Purchasing Managers Index (PMI) data for new trading instructions. If any PMI index falls below 50.0, indicating a contraction in economic activity in related industries, the dollar may face pressure and help gold prices rise.
The market will also pay close attention to developments surrounding the ongoing discord between U.S. President Trump and Federal Reserve Chairman Powell. The White House announced Trump's schedule, and Trump will visit the Federal Reserve at 4 p.m. Eastern Time on Thursday.
Views on the trend of gold!
The trend of gold is directly reversed from that of Monday and Tuesday this week. At the beginning of this week, gold rose slowly and continuously without giving a chance to retrace, while today it retreated continuously and did not give a rebound. Does it look familiar? The trend is bearish and I want to short but I can't do it. In fact, we are still bullish in the morning today, and the watershed is actually at the 3375 line. After the frequent breakouts in the European session, it means that the current bulls are suppressed again.
And the K-line on the hourly line is more obvious. There is no positive line in the continuous negative retracement, so the weakness will continue. After all, the Asian session is weak today, and the European session is also continuously weak. The current market has reached the 3363 line, which is actually not far from our second support of 3350. So the US session needs to focus on this position. If the US session can hold, there is still hope for a rebound. Otherwise, it will fall continuously today!
Gold: Long around 3350, defend 3340, and target the 3385-93 line

gold view today (july 22, 2025📊 Market Context
🕰️ Daily & 4H: Bullish BOS (Break of Structure) formed.
📉 Retracement may occur to retest BOS levels before bullish continuation.
⚠️ Be aware: Price might dip lower before buying resumes.
🟢 For BUYS:
✅ Scenario 1: No retracement
1️⃣ Wait for a 15M 🟢 bullish CHOCH with body close to form BOS.
2️⃣ On 3M, get a 🟢 CHOCH with body close.
3️⃣ Retest the 🟨 FVG that forms.
🎯 Target: 3398.332
✅ Scenario 2: Retracement first
1️⃣ Let price fall to 🔵 3368.9480 – 3362.888 (near Daily BOS).
2️⃣ Wait for 🔁 1M/3M CHOCH confirmation.
3️⃣ Retest BOS zone.
📈 Buy towards:
• 🎯 Partials: 3383.518
• 🎯 Final TP: 3398.242
✅ Scenario 3: Breakout
1️⃣ Break above 3398.242 with strong 15M 🟢 body close.
2️⃣ Retest the level.
📈 Enter short-term BUYS targeting:
🎯 3412.172
🔴 For SELLS (if BOS fails):
⚠️ If 15M BOS is broken by 🟥 strong momentum candle:
1️⃣ Retest the BOS zone.
2️⃣ Look for bearish entry.
🎯 Target: 3369.557

SMC Strengths of the Analysis
• ✔️ Clear bearish structure (ChoCH + BOS + fake out)
• ✔️ Mitigation target (1H FVG not yet closed)
• ✔️ SL well protected outside the manipulation zone
• ✔️ Logical entry right where the imbalance begins

Clear way to shoot up and touch atleast 3500.Clear way to shoot up and touch atleast 3500, Keep your support and resistance in place and take trades on order blocks making sure the breakouts are strong enough.
----------------------------------------------------------------------------------------------
Disclaimer:
Trading foreign exchange (Forex) on margin involves a high level of risk and may not be suitable for all investors. The use of leverage can work both for and against you. Before deciding to participate in the Forex market, you should carefully consider your investment objectives, level of experience, and risk tolerance.
There is a possibility that you may incur a loss of some or all of your initial investment, and therefore, you should not invest money that you cannot afford to lose. Be fully aware of all the risks associated with foreign exchange trading, and seek advice from a licensed and independent financial advisor if you have any doubts.
Past performance is not indicative of future results. Always trade responsibly.

XAUUSD
XAUUSD Updated in 15M :
The gold signal is marked on the chart based on the latest price changes and the supply and demand in the market. These points include the entry point, stop loss, and take profit
