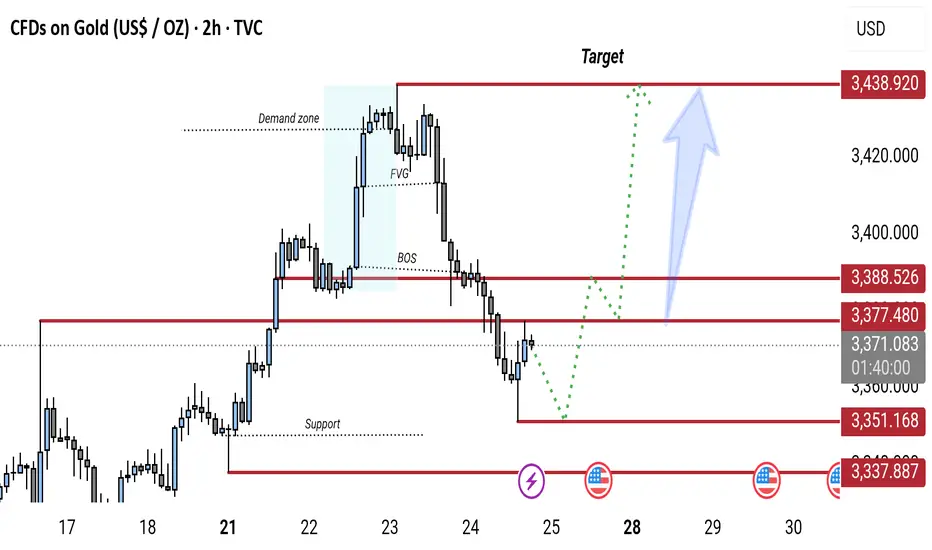
Gold 2H Chart: Bullish Reversal Expected from Key Support ZoneGold (XAU/USD) 2H chart shows a bearish break of structure (BOS) followed by a pullback toward a key support zone (around 3,337–3,351). A potential bullish reversal is expected from this zone, targeting the 3,438 resistance level. The chart highlights a demand zone, FVG (Fair Value Gap), and possible retracement before continuation to the upside.
XAUUSDK trade ideas
Gold Hits Five-Week High as Trade Tensions MountGold reversed early losses to rise above $3,420 per ounce, hitting its highest level since June 16, as US Treasury yields and the dollar continued to weaken amid persistent uncertainty over trade negotiations.

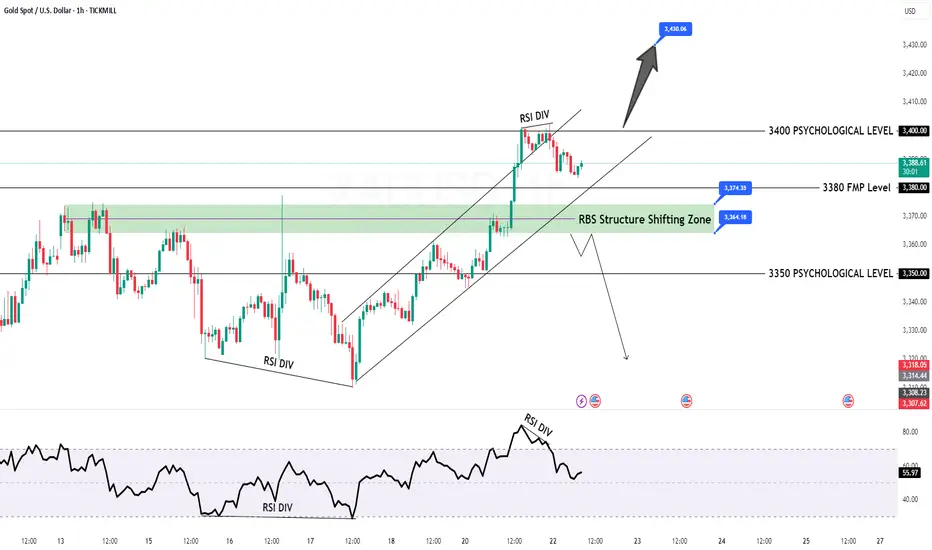
GOLD Intraday H1 Chart Update For 22 July 2025Hello Traders,
Today we have FED Chair Powell Speech ahead
all eyes on 3400 Psychological Level Break for now, if market successfully breaks 3400 then it will move towards 3435
below 3400 it will move back towards 3350 level
Disclaimer: Forex is Risky
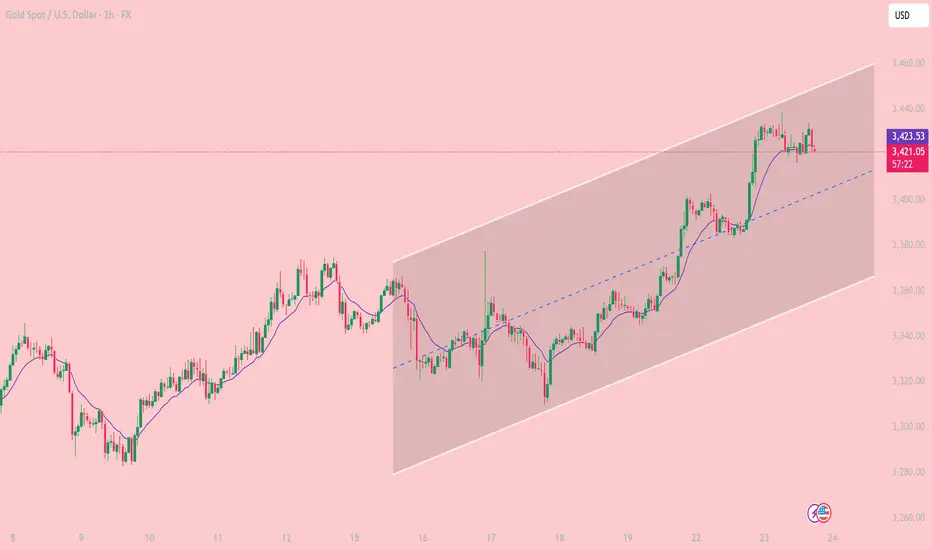
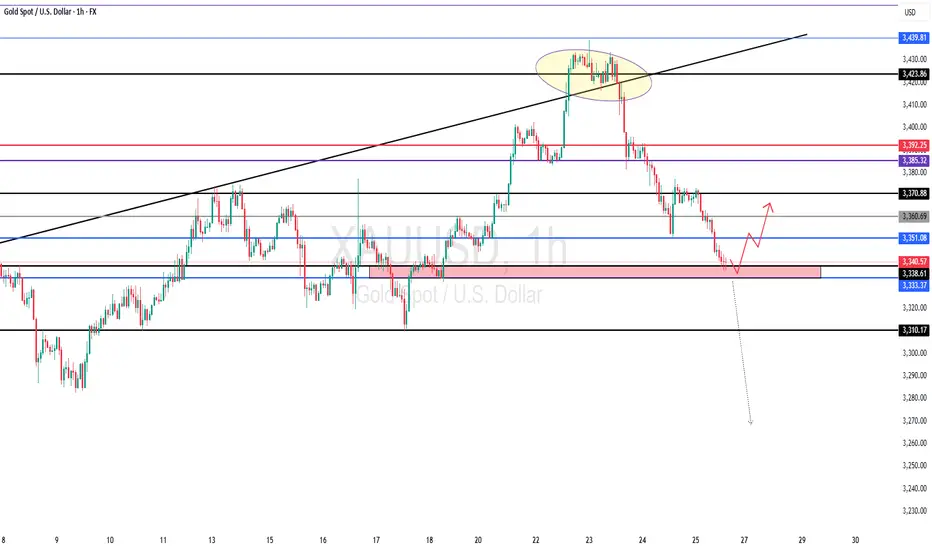
Bullish Channel in Play Key Trading Zones and Strategy for JulyOn the 1-hour chart, XAUUSD is clearly moving inside a well-defined ascending price channel, with price respecting both the channel boundaries and the midline as dynamic support/resistance. The pair continues to print higher highs and higher lows, confirming short-term bullish structure.
Trend Channel: Since July 18, gold has been steadily climbing within an ascending channel, bouncing off the lower boundary and riding above the midline.
EMA Support: The 10-period EMA (purple) has been acting as a dynamic support. Price has yet to close below it during this bullish swing.
Candle Behavior: Recent bullish candles with strong bodies show that buyers still have control, although price is stalling near the upper boundary of the channel.
Technical Level
3,459 USD. Major Resistance. Top of the channel – potential reversal or take-profit zone
3,423 USD.Immediate Support. EMA10 and current consolidation area
3,400 USD. Mid-Channel Support. Key pullback zone if price rejects near highs
3,360 – 3,365 USD. Major Support. Bottom of the ascending channel – break may invalidate bullish setup
Scenario 1 – Buy the Dip (trend continuation):
Wait for price to retest the 3,400 – 3,410 USD area or EMA10.
Look for bullish confirmation (e.g., pin bar, bullish engulfing).
Target: 3,445 – 3,459 USD
Stop loss: below 3,395 USD
Scenario 2 – Short at Channel Top (mean-reversion setup):
Monitor price behavior near 3,455 – 3,459 USD resistance.
If bearish reversal candles appear (e.g., shooting star, bearish engulfing), consider shorting.
Target: 3,420 – 3,410 USD
Stop loss: above 3,465 USD
As long as price remains inside the rising channel, buying pullbacks is the preferred strategy.
Stay alert to macroeconomic catalysts (Fed comments, PMI data, labor market releases) that could increase volatility.
Gold remains in a strong short-term uptrend on the 1H chart. Trading in the direction of the trend with proper risk management continues to offer the best opportunities for intraday traders.
If you found this analysis useful, don’t forget to follow for more trading strategies and ideas!
Mean Reversion Risk & Short Trap ?Analysis :: XAU/USD – July 21, 2025
🧩 Scenario Expansion – Mean Reversion Risk & Short Trap Variant
🧠 FLOW STATUS (Reassessment for MR scenario):
Order book shows replenishment at 3401.50–3403.00, forming a liquidity ceiling.
CVD diverging slightly on 1M–5M as price presses upward—distribution signal rising.
VWAP bands stretched: price outside 1.5x STD (mean reversion trigger zone).
🕳️ Low effort on buyer continuation despite printing highs.
📉 ALTERNATE SIGNAL: 🔃 MEAN REVERSION TO VWAP
🔹 Confidence Band: CONSERVATIVE → CONFIRMED if 3393 fails
📍 Break Trigger Zone:
Breach of 3393.00 on delta + seller reclaim → validates reversal logic
Watch for bid collapse or sustained negative delta below 3391
📉 Expected Pullback Targets:
TP1: 3387.80–3386.20 = VWAP + 1 STD reversion
TP2: 3383.00 = HLQ + CVD shelf
🛡️ Stop Zone for Mean Reversion Entry:
Above 3397.20 or on full absorption at 3395.50 (failure = trap scenario invalid)
🧮 Probability Estimate – Mean Reversion:
46–55% over next 6–12 hours
↑ Strengthens to 65–70% if price fails to reclaim 3394.50 after sweep + delta shift
📈 Trap Reversal Setup (Short trap flipped into long):
If price fakes below 3391.00 then spikes back above 3393.50 with aggressive tape → strong trap confirmation
In that case:
✅ Re-entry LONG with confirmation
📍 Entry: 3393.40–3394.20
🎯 TP: New highs at 3402.50+, then 3406.00
📚 NARRATIVE (Alt Scenario):
Market extended into premium zone without strong continuation. Liquidity overhead, delta divergence, and VWAP stretch suggest potential for correction. If bulls fail to defend 3393–3391, price likely seeks VWAP center and HLQ for rebalancing. Conversely, any reclaim of broken bids post-sweep flips scenario into a reactive long on trap fuel.
📦 MODULE TRACE (Alt Path):
🧠 Disciplined Entry Logic: Rule 3 (bias must adjust if liquidity contradicts setup)
💧 HLQ under VWAP (~3384–3387) aligned with pullback
🔄 Delta divergence + DOM ceiling = soft rejection
📦 Shadowcode ST3/ST5 if price forms mirror wick rejection
🧠 Trap Narrative Active only after flush + reclaim with flow shift

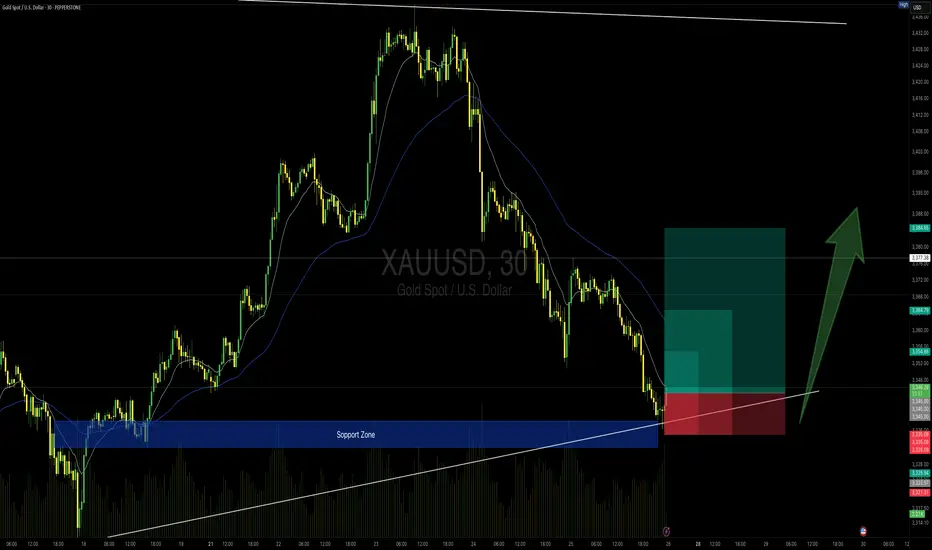
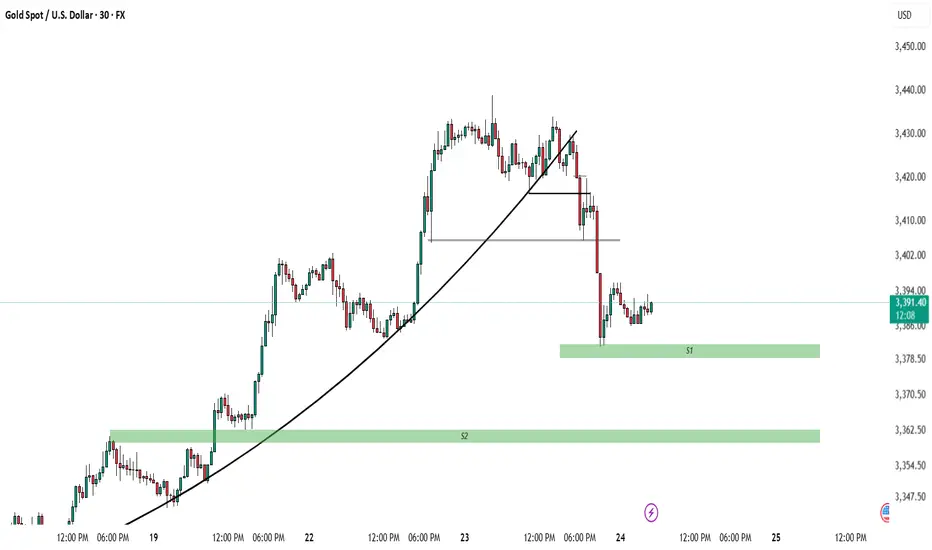
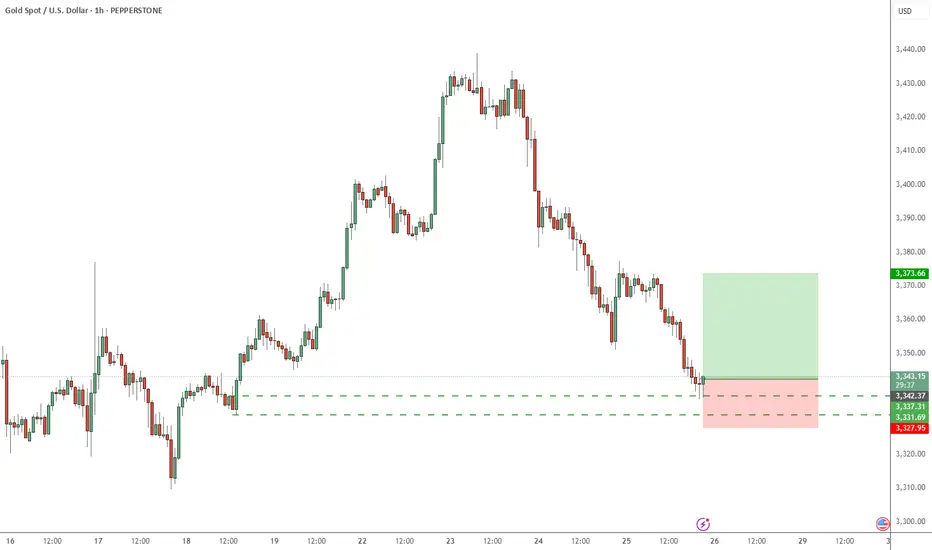
GOLD 30min Buy Setup (High Risk - High Reward)📍 TVC:GOLD 30min Buy Setup – MJTrading View
After an extended bearish leg, price has tapped into a strong support zone that previously acted as a launchpad. Also touching the main Uptrend...
We now see initial signs of absorption with potential reversal setup forming just above the ascending trendline.
🔹 Entry Zone: 3344–3346
🔹 SL: Below 3335 (under structure & wick base)
🔹 TP1: 3355
🔹 TP2: 3365
🔹 TP4: 3385+ (if momentum sustains)
🔸 RR: Up to 1:4 depending on target selected
🧠 Context:
– Still inside broader bullish structure (macro HL)
– Support zone coincides with rising trendline
– Potential for bullish reaccumulation after sharp drop
– Volume spike near zone suggests active buyers
Stay sharp and manage your risk please...
See the below Idea for full concept:
"Support isn't just a level — it’s a battlefield. If buyers win, they don’t look back."
#MJTrading #Gold #BuySetup #PriceAction #SmartMoney #ChartDesigner #ReversalSetup #MarketStructure
Psychology Always Matters:
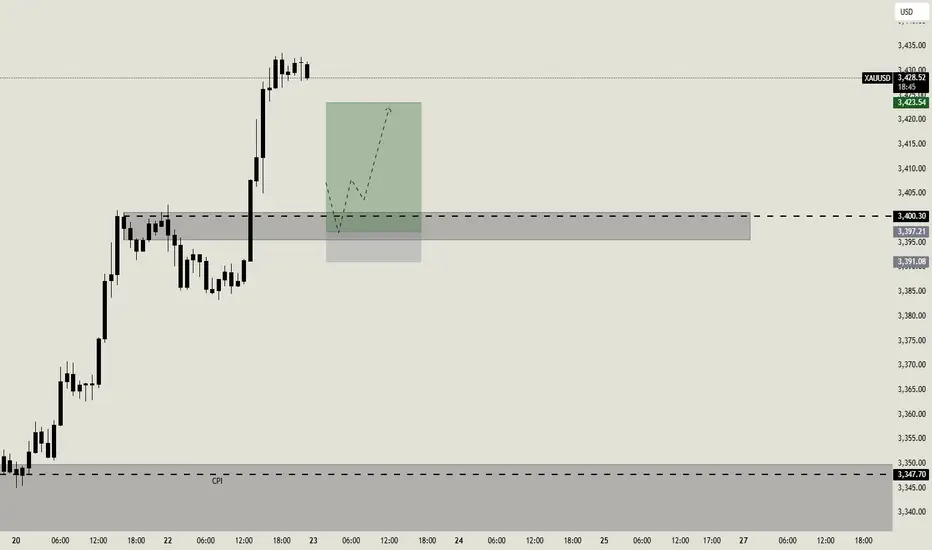
XAUUSD Entry PossibilityFX:XAUUSD
🔥 Clean S&R + Previous FVG Confluence 🔥
30M sniper setup with high R:R 📈
Let me know your thoughts! 🧠👇
Possibilities For Entries!
1) If market Sweep Liquidity below 3382-3380 then wait for Bullish formation to Enter in Market
2) If Liquidity didn't sweep instead market close below these then wait for Retracement to go in sell side until 3360 Support
3) When Entry is place take 1:2 as partial Close and Let other position with breakeven SL. Open Until 3401 if get rejection then close.
IF NOT then keep it 3414-3430.
Thursday Analysis (24/7/2025)Hey guys today is looking pretty good for us. My swing sell has gone more than 600 pips and my buy is also looking pretty good. let's see how it goes from here. I will update in the notes if I found anything.

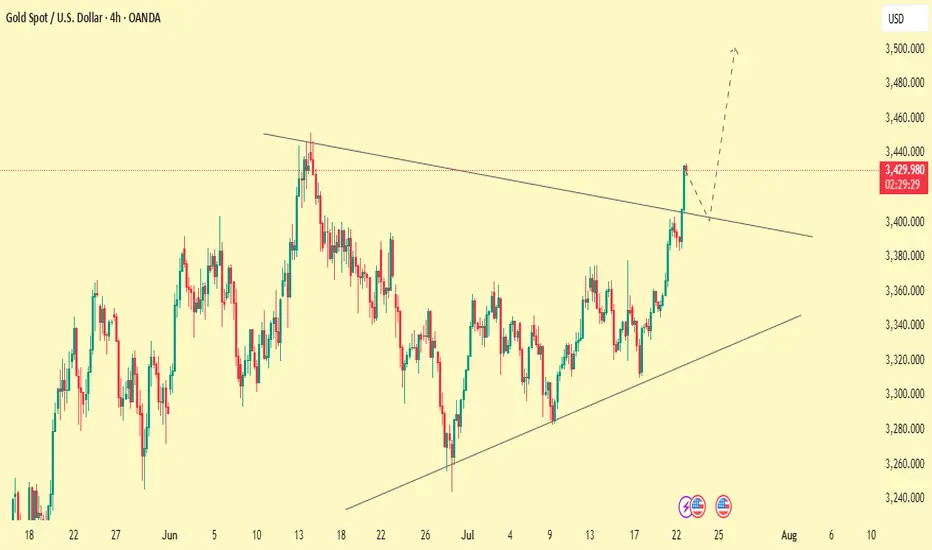
GOLD gartely , XAUUSD ShortLooks like a perfect gartely pattern here on 4h frame , gold might go bearish to 3260

GOLD - at Cut n Reverse Region, whats next ??#GOLD - market just reached at his ultimate area and keep in mind that if market break his current region than it will go further and nose dive..
NOTE: cut n reverse below our mentioned region..
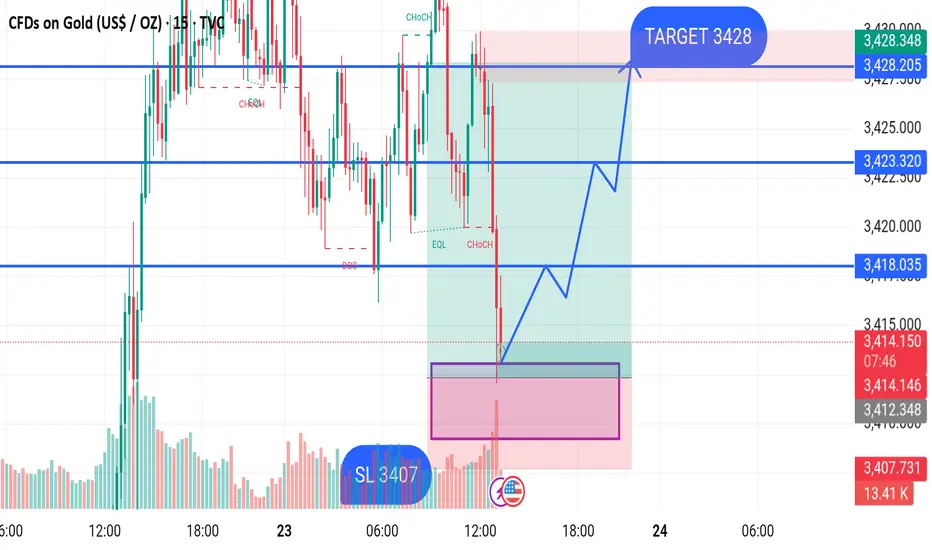
GOLD BUY M15 Gold (XAUUSD) Analysis – 15-Minute Timeframe
Price has recently shown a strong bearish move after a CHoCH (Change of Character) confirmation. The market has entered a demand zone (highlighted in pink), where a potential bullish reversal is expected.
Entry Zone: Around 3407–3408 level (within the demand area)
Stop Loss (SL): 3407 (just below the demand zone)
Target: 3428 (major resistance and supply zone)
The expected move shows price reacting from the demand zone, forming higher highs and higher lows, with bullish confirmation. If price holds above the 3407 level, buyers may take control and push price toward the 3428 target.
Key Levels:
Demand Zone: 3407 – 3408
Support Level: 3418.035
Resistance Levels: 3423.320 and Final Target 3428
Gold Analysis and Trading Strategy | July 24✅ Fundamental Analysis
🔹The European Union and the United States are reportedly close to reaching an agreement to standardize tariffs on goods exported to the U.S. at 15%, aiming to avoid a potential increase to 30% starting August 1. Modeled after the U.S.–Japan trade framework, this deal eases global trade tensions significantly, boosts risk sentiment in financial markets, and leads to a notable decline in safe-haven demand for gold.
✅ Technical Analysis
🔸On Wednesday, gold formed a bearish engulfing pattern, signaling a potential trend reversal. The price also broke below the 5-day moving average, suggesting weakening short-term momentum.
🔸4-Hour Chart: Wednesday’s decline broke below the middle Bollinger Band, confirming the start of a corrective structure. The current price action suggests a bearish consolidation, with a continued search for support likely.
🔸If the 3365–3360 support zone is broken, the downtrend may extend toward 3350.
🔴Resistance Zone : 3400–3405–3410
🟢Support Zone : 3365–3360–3350
✅ Trading Strategy Reference:
Today's gold short-term strategy remains selling on rebounds as the primary approach, and buying on dips as a secondary strategy, depending on whether the market continues the corrective trend seen since Wednesday.
🔻 Short Position Strategy:
🔰Consider entering short positions in batches if gold rebounds to the 3405–3408 area. Target: 3390–3380;If support breaks, the move may extend to 3370.
🔺 Long Position Strategy:
🔰Consider entering long positions in batches if gold pulls back to the 3365–3370 area. Target: 3380–3390;If resistance breaks, the move may extend to 3400.
🔥Trading Reminder: Trading strategies are time-sensitive, and market conditions can change rapidly. Please adjust your trading plan based on real-time market conditions. If you have any questions or need one-on-one guidance, feel free to contact me🤝

XAU/USD LONG XAU/USD LONG " break of a resistance area and retest it + 61.8 % fib retracement + 50 ema dynamic support "

The general trend is to go long after the retracementFrom the 4-hour analysis, the short-term support below is 3370, the important support is 3350-55, and the upper resistance is 3400-05. The overall support range is maintained in this period to maintain the main tone of high-altitude low-multiple cycle participation. In the middle position, watch more and do less, be cautious in chasing orders, and wait patiently for key points to enter the market. I will provide specific operation strategies in the link prompts, please pay attention in time.
Gold operation strategy:
1. Go long on gold when it falls back to 3370, and add more positions when it falls back to 3350-55, stop loss 3344, target 3395-3400, and continue to hold if it breaks;

Trend breakout towards master(ATH) trend line Purely from a trend line POV and HTF (M, W,D) POCs, which have been tested multiple times confirming their validity, best case scenario is a retest of the upper trend line that originates from the all time high.
The lower trend line has been tested and defended @ 3311. The continuation of this leg has faced initial resistance from a level @3360 where price closed below decisively after news event.
Favourite scenario is a pull back to last weeks VAL where the weekly candle closed above signalling buyers were keen on such level @3300, clear support formed to confirm validity of the level and upside target to 3400

XAUUSD Bearish from bearish ob need new breakdown from side line📊XAUUSD 1D Forecast
Gold is currently showing bearish signs after reacting from the order block level at 3450.
Now trading around 3355, which is near the sideways resistance zone.
We're watching for confirmation before entering — targeting entry near 3350.
📌Key Levels to Watch:
Resistance Zone: 3355 (current price)
Entry Zone: 3350 (with confirmation)
Next Demand Zone: 3250 (major level)
Support Level: 3180
Strategy:
Waiting for a strong bearish 4H candle to confirm momentum.
Only then we’ll consider short entries from 3350 zone.
Patience is key. No confirmation = no trade.
📊 #XAUUSD #Gold

GOLD Buy limit targetGold is preparing a possible retracement till the $3400 area. My plan is wait the price there and enter long if this level will get a rejection. This is a high volume area where price could catch some volatility to bounce
Uptrend, currently trading in ascending channel. Ascending Trend channel: Gold is currently in a bullish channel, with recent support bounce near $3,315–$3,320, aligning well with the technical uptrend .
Gold XAUUSD Sell in trendline completion stageGold XAUUSD Sell in trendline completion stage - short term trade. now in 4th touch. bounce back to test previous level testing and return back to support again and it will break to test the sellers.

In-depth analysis of gold price trends this week!Market news:
During the Asian morning session on Monday (July 21), the London gold price rose slightly to above $3,350 and is currently trading around $3,356/ounce. The weakening dollar and continued geopolitical and economic uncertainties have boosted demand for safe-haven spot gold, supporting international gold prices, but the rebound in the University of Michigan survey index may limit gold's gains.Although gold prices may face correction pressure in the short term, international gold has limited room to fall. Factors such as economic slowdown, lower interest rates and rising inflation will attract more buyers to enter the market. The continued purchases by central banks over the past two and a half years have also provided solid support for gold prices. The tension between Trump and Powell is the main reason why gold prices remain high.Looking ahead, the market focus will shift to this week's ECB monetary policy meeting. Economists generally expect the ECB to keep interest rates unchanged, and preliminary manufacturing data released this week may also trigger some market fluctuations. This week's economic data and Fed dynamics will be key variables in the trend of gold prices. No matter how the market fluctuates, the long-term value of gold cannot be ignored, and investors need to pay close attention to macroeconomic changes and political events.
Technical Review:
Technically, the daily chart of gold still maintains the adjustment of the middle track of the Bollinger Band, forming a yin-yang alternating shock consolidation. However, on Friday, the gold price closed with a small positive K, and the price MA10/7-day moving average closed above 33/42. From the indicator point of view, the MACD indicator momentum column shortened, and the RSI indicator ran around 50, indicating that the market buying and selling forces were balanced.The 4-hour chart shows that the gold price fluctuated and tended to buy and consolidate at 3330-3360. At present, the moving average system opened upward. As long as gold does not lose 3320, it is expected to continue to sprint upward to 3375/3400. On the contrary, if it loses the support of 3320/10 again, it is regarded as a short-term weak shock downward. On the whole, the current trend of gold is oscillating and tending to buy and consolidate. Today's trading idea is mainly to buy at a low price and sell at a high price.
Today's analysis:
Since there is no major economic data this week, in the absence of geopolitical risks and emergencies, it is expected that gold will still see a small range of shocks and consolidation this week, and the range can be focused on 3400-3300. The daily Bollinger Bands continue to close, with the upper track at 3375 and the lower track at 3288. The short-term moving averages are intertwined near the middle track, suggesting that gold will still be dominated by fluctuations in the short term. In terms of operation, keep the idea of selling at high prices and buying at low prices. Do not chase the rise and sell at the fall. Wait for the breakthrough signal to be confirmed before following the trend. Today’s support is at 3340. You can use this as a key point to arrange buy orders during the day. The key point above is 3361, which is the high point of last Friday. 3361 is a short-term pressure point. If there is no correction today and it directly breaks 3361, we can follow the trend directly. If there is a correction, pay attention to the bottom structure above 3340 and buy at the bottom!
Operation ideas:
Buy short-term gold at 3340-3343, stop loss at 3332, target at 3370-3390;
Sell short-term gold at 3377-3380, stop loss at 3388, target at 3340-3320;
Key points:
First support level: 3340, second support level: 3332, third support level: 3320
First resistance level: 3375, second resistance level: 3388, third resistance level: 3410

XAUUSDGold is trading inside a rising wedge on the 4H chart — typically a bearish reversal pattern but often bullish during strong trends. Price consistently respects this zone during retracements, offering reliable bounce setups. Each Golden Pocket bounce aligns with a rising trendline, strengthening the support zone.
Price is hovering below upper wedge resistance — suggesting a possible pullback to the lower trendline. Another bounce at Golden Pocket + trendline could offer a long entry. A breakdown below trendline support could shift sentiment toward a deeper correction.
If You Fallow our analysis and enjoy from this analysis
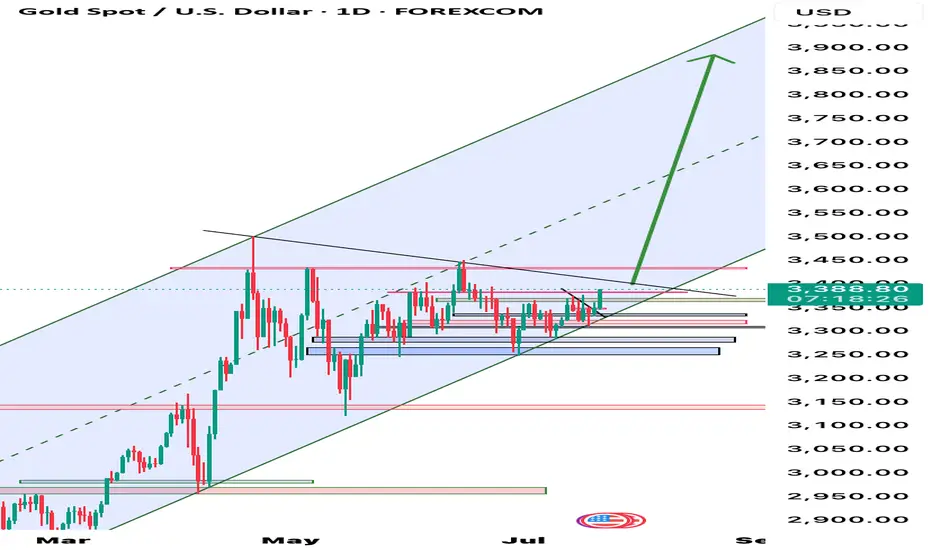
GOLD Cup and Handle target of $3800+ $GOLD. - Target in Reach? 💛
The cup-and-handle measured target of $3800 - $4000 will be reached eventually.
$2600 - $2800 would be an amazing buying opportunity if we get it.
