XAUUSD 1 HOUR CHART PATTERN(XAU/USD 1H timeframe), there are two target points clearly marked on the screen:
1. First Target Point:
~3,380,000 (as shown on the chart).
2. Second Target Point:
~3,420,000 (higher target marked at the top).
The chart shows a breakout above a descending trendline, with price retesting the breakout zone (light blue area). The arrows suggest an expected bullish continuation towards these targets.
Suggest stop loss zones.
Analyze further timeframes.
XAUUSDK trade ideas

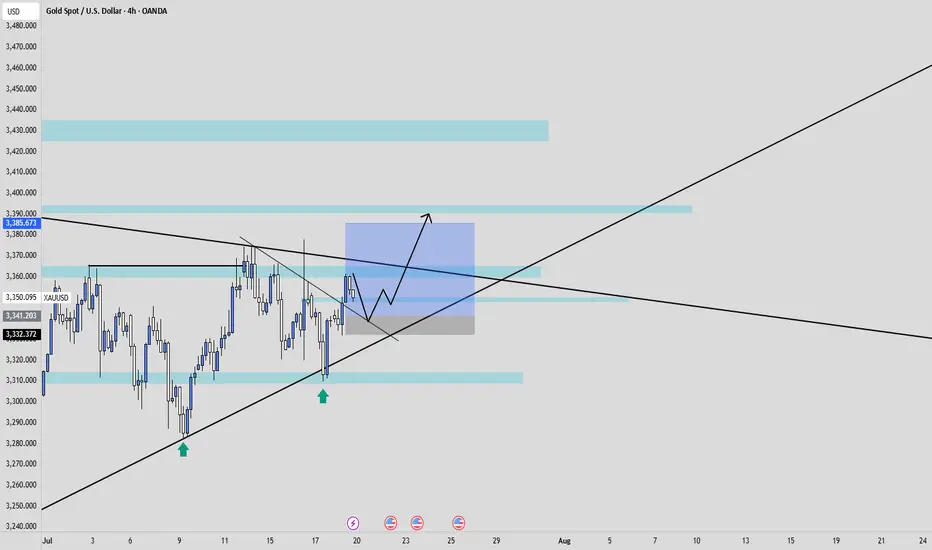
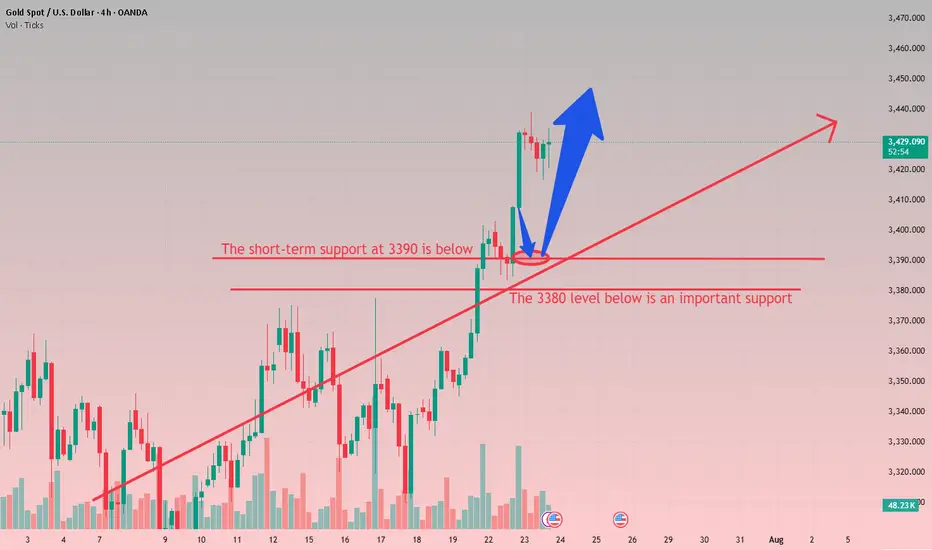
XAUUSD potential scenarioTake away points :
- XAUUSD has been in a good uptrend for the last couple of months, mainly driven by Central banks demand for Gold.
- We had a break of structure to the upside on the left followed by a trendline bullish break, which indicate strength to the upside.
- Price is currently retesting a minor H4 zone, monitor this area for bearish exhaustion and wait for bullish candlestick formation.
Here is my trade idea, it's not a financial advice, just for entertainment purpose.
XAUUSD GOLD H1 TARGETThere we have declared if market break 3380 then it's going to take bullish way so stay tune with us
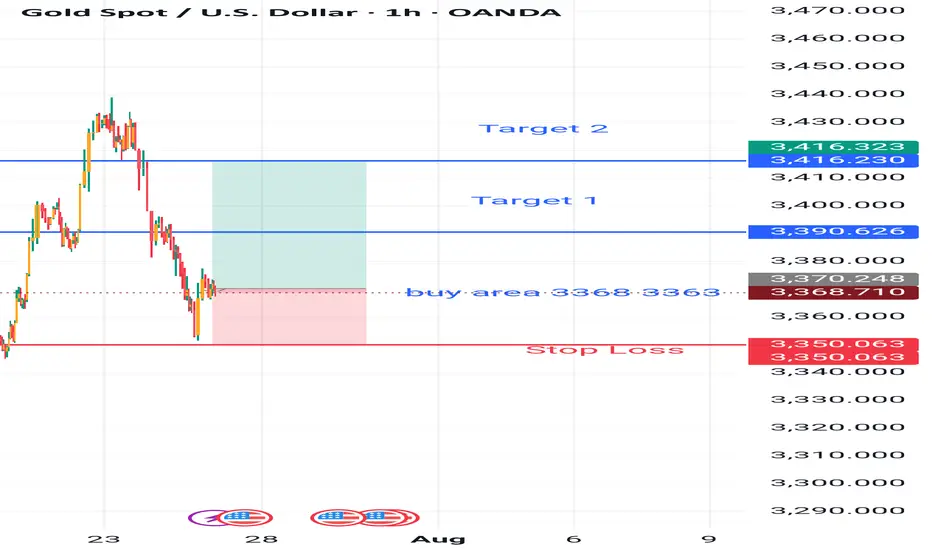
XAUUSD _ Gold Buy Setup from Key Support ZoneGold has pulled back into a key support area between 3,362, a level that has held strong in the past. I'm watching this zone closely for a potential long entry, expecting a bullish reaction and possible reversal.
Buy Entry Zone: 3,362
Stop Loss: Below 3,348
Take Profit Target: 3,412
Risk/Reward: Favorable setup with clear invalidation level
If price holds above support and shows bullish momentum, this could offer a clean bounce toward the previous high zone.
Waiting for confirmation before entering. Will update if setup invalidates.
This is not financial advice.

The real target of gold is more than 3400
💡Message Strategy
The United States has recently made frequent moves in global tariff policies. Treasury Secretary Bensont has clearly set August 1 as a hard deadline for tariff negotiations among countries. At present, EU trade negotiations have been decoupled from the issue of sanctions against Russia and Ukraine, while Japan's negotiations are progressing smoothly.
These dynamics reflect that the United States is reshaping the global trade pattern through differentiated strategies, and countries are forced to adjust their economic and trade policies under the pressure of tariffs. As the deadline approaches, gold is facing a test of long and short positions.
The White House's pressure on the Federal Reserve is still fermenting. The US Treasury Secretary said that the Federal Reserve should cut interest rates now, but at the same time said that there is no sign that Powell should resign now. If he wants to leave early, he should do so. Powell gave a public speech yesterday, but to the disappointment of the market, he did not mention monetary policy and the possibility of resignation. However, Trump's pressure on the Federal Reserve has taken effect, and the market has turned its attention to interest rate cuts.
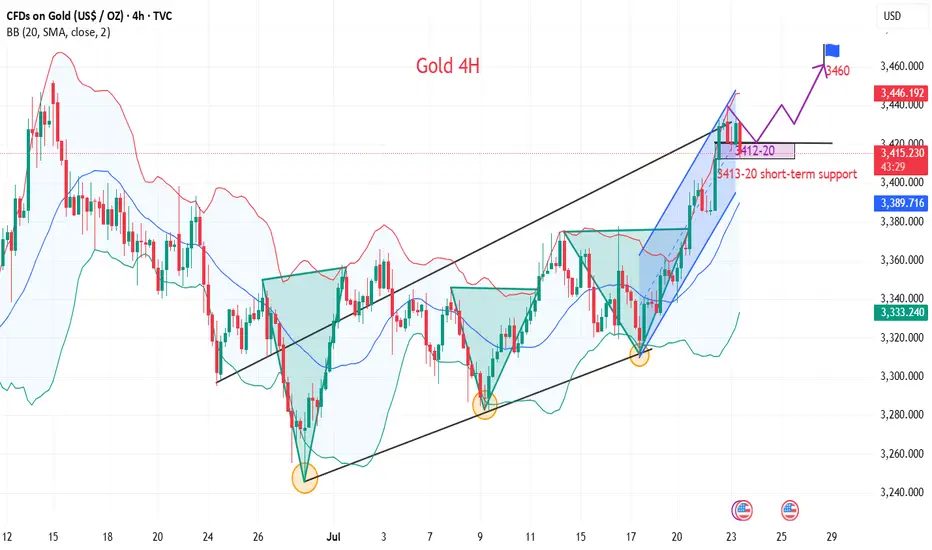
📊Technical aspects
Yesterday, Tuesday, we believed that the trade negotiations between Europe and the United States were on the verge of breaking down, which led to a rise in risk aversion in the market, boosted gold safe-haven buying, and supported the price of gold to a one-month high.
Therefore, we suggest that you take a bullish approach in terms of operation. Pay attention to the support below at $3,380, and pay attention to the breakthrough of $3,402 above. As expected, it broke through to $3,440, reaching our expected profit target.
From the 4H trend structure, gold has been climbing rapidly along the upward channel recently. It broke through yesterday and took the 3400 mark in one fell swoop, reaching our expected target of 3440. At present, gold is blocked and falls back on the channel boundary support.
At the same time, the 1-hour RSI broke through the upward trend line support and tested the resistance again, releasing a callback signal in the short term. It is necessary to pay attention to the possibility of short-term adjustments. Today, we can focus on the key resistance around 3415 and try long opportunities.
💰Strategy Package
Long Position:3410-3420,SL:3390,Target: 3440,3460
Well I made my first Million Dollar Trade (even in DEMO)This was a calculated excercise to see what would happen if I brought real money to the table for actual successful outcomes. I had traded the 10K, 50K and 100K. Then I traded the 100K, 200K and 500K levels successfully during trading capital increases. But today I earned a 1M Trade over the capital interests that I could accumulate. This was an excercise, but I ask you to do it. Good, thanks for watching, FLB.

xauusd ideaposible buy At the confluence of additional Fibonacci extensions, we have an institutional price that can be visited before rising through those highs.

Gold (XAU/USD) Technical Analysis:Gold is currently retesting the $3,440 zone — a key level for the next move.
🔹 Bullish Scenario:
If the price breaks and holds above $3,440, we may see a continuation toward $3,455, where a pullback or bearish correction could occur.
🔹 Bearish Scenario:
If selling pressure increases and the price breaks below $3,420 with confirmation, a move down to retest the $3,385 area is likely.
⚠️ Disclaimer:
This analysis is for educational purposes only and does not constitute financial advice. Always do your own research before making any trading decisions.

XAUUSD LONG Here are reasons to buy gold,
1.Ascedig triangle formed and clear when you look at daily and h4 time frames.
2.At 3410.42 support truns in to resistance
3.Be on the look out of tend in trends on the smaller time frames

XAUUSD: A Perfect Storm - Multi-Decade Pattern. Gold is currently at one of the most significant inflection points in decades. A powerful, multi-year bull run is showing clear signs of exhaustion, and technical signals across four distinct timeframes are aligning to suggest a major corrective move is imminent. This analysis lays out the evidence from the multi-decade macro view down to the immediate intraday catalyst, culminating in a high-probability scenario.
The foundation for this thesis begins on the highest possible timeframe. On the multi-decade chart, gold's price action has been supported by a parabolic curve, or "dome," originating from the 1970s. While the price is currently extended from this support, suggesting a need to cool off, the fundamental picture has shifted. Unprecedented central bank accumulation and a surge in public awareness are providing a powerful underlying bid, making a full reversion to the distant parabolic curve unlikely in the current environment.
Zooming into the monthly chart reveals a classic and powerful warning sign: a severe multi-year bearish divergence. While the price of gold has been pushing to new all-time highs, key momentum indicators have been making lower highs. This shows that the underlying strength behind the immediate rally is fading, making the trend fragile and highly susceptible to a reversal.
This weakness is now being confirmed on the daily chart. The 20-day and 50-day moving averages are on the verge of a bearish crossover, a classic technical signal that confirms short-term momentum has officially shifted from bullish to bearish, adding another layer of evidence that a correction is taking hold.
The entire scenario culminates on the 8-hour chart, where we find the immediate trigger. Gold is coiling into a tight symmetrical triangle, with the apex converging perfectly with the timing of Fed Chair Jerome Powell's speech on Tuesday, July 22nd. This is a "moment of truth" setup where the speech will act as the catalyst to release the pent-up energy and force a decisive breakout.
Given the context of persistent inflation, the baseline expectation is for a hawkish speech from Chairman Powell, which is fundamentally bearish for gold in the short term. This makes a downside break the most likely scenario. The primary and most logical target for this healthy correction is the major breakout zone and multi-year Fibonacci 1.0 support level at ~$2,800. This level represents a necessary reset, not the start of a bear market. A pullback to this zone would shake out leverage and establish a formidable base for the coming capital rotation event, where gold is expected to enter a hyperbolic, stratospheric upward trajectory. The strong fundamental floor provided by central banks and retail interest should hold this ~$2,800 level firmly.
Disclaimer: This is a technical and fundamental analysis for educational and discussion purposes only and does not constitute financial advice. Please conduct your own due diligence.

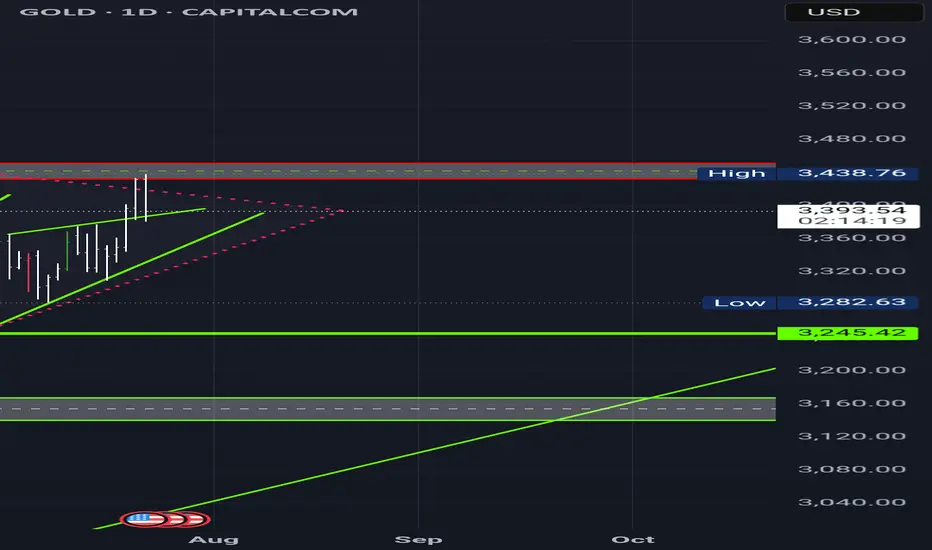
XAUUSD 4H Technical Outlook The current market structure on the 4H timeframe shows a clear sweep of a liquidity pool near the recent highs (~3,348), followed by a strong bearish reaction. Price action suggests a short-term shift in momentum toward downside targets.
🔻 Bearish Scenario
After liquidity was grabbed above the recent highs (highlighted in the orange circle), price rejected sharply. The next critical level lies at the Bullish OB (LTF) around the 3,325–3,337 zone. A break below this could lead to a deeper retracement into the Fair Value Gap (FVG) and demand zone at 3,150–3,244.
📍 Key Levels:
Resistance: 3,347 – 3,439
Support: 3,244 – 3,150 (watch for reaction in the FVG zone)
Intermediate target: 3,244.41 (Low)
🟢 Bullish Case
If price finds support at the OB and respects the ascending trendline, we could see a reversal back to re-test the upper resistance near 3,438.
📈 Bias: Bearish until price confirms support above 3,337 and reclaims liquidity zone.
🔔 Watch for:
Price reaction at OB (3,325–3,337)
Break and close below 3,244 could accelerate selling
Potential long setup from FVG with bullish confirmation

XAUUSD 5M DEMAND SETUPSpotted a clear 5M demand zone aligned with a bullish trend and previous higher highs. Noted a break of structure before the zone was tapped, with a fair value gap confirming the setup. Entered after a strong rejection and break of candle , targeting a 1:2 R:R. Trade hit take profit, ending the session with a solid result.

Gold testing SIGNIFICANT DAILY TRENDLINEGold is testing a key ascending trendline support around 3,340. If price holds this level, we could see a strong bullish reaction targeting 3,367 and potentially 3,400+. A break below 3,328 invalidates this setup.”

GOLD: Strong Bullish Sentiment! Long!
My dear friends,
Today we will analyse GOLD together☺️
The in-trend continuation seems likely as the current long-term trend appears to be strong, and price is holding above a key level of 3,392.264 So a bullish continuation seems plausible, targeting the next high. We should enter on confirmation, and place a stop-loss beyond the recent swing level.
❤️Sending you lots of Love and Hugs❤️

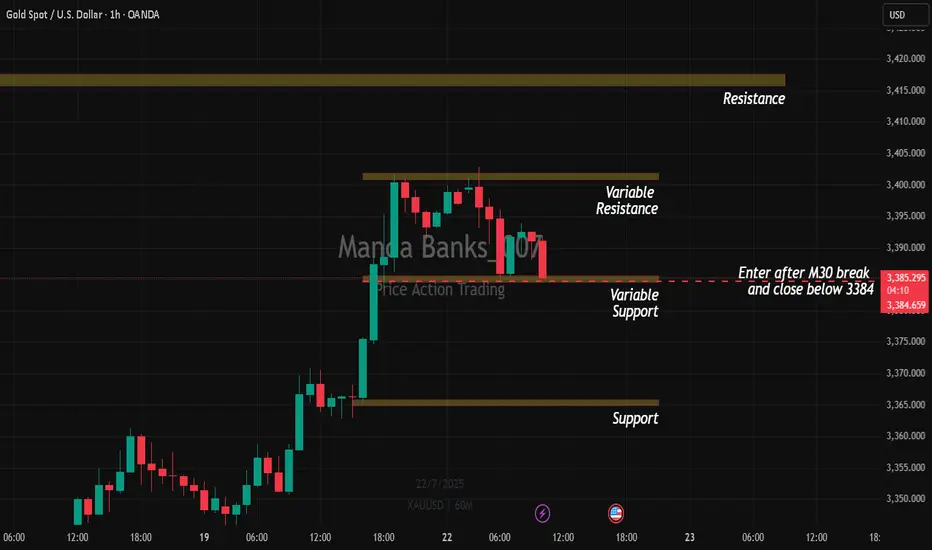
Impulse Sells on Gold/ Pre-London SetupI'll take a sell on Gold if price break and close below 3384.
It's simple price action strategic entry based on volume in Pre-London Session.
1st TP always 15-25 pips.
Manage risk dynamically by trailing SL to the high of the previous candle high.
Is Smart Money Selling Gold? A VSA LookHey Traders,
Let's take a look at the Gold (XAU/USD) 1-hour chart using Volume Spread Analysis (VSA). The price made a strong run-up to a new high around $3,438, but the volume is telling us a story of potential weakness.
Here’s a simple breakdown of what I'm seeing.
The Trap at the Top (Signs of Weakness)
Think of the market as being moved by "smart money" (professionals) and "herd money" (the crowd).
Climax Volume: See that huge volume spike right at the peak on July 23rd? While it looks like strong buying, this is often a classic sign of a Buying Climax. This is where smart money starts selling their positions to the excited crowd who are buying at the top, fearing they'll miss out.
No Real Buyers Left: After the peak, notice how the price tried to push higher a few times but on much lower volume? This is a "No Demand" signal. It’s like a car trying to rev its engine, but it's out of gas. It shows there isn't enough buying power to push the price any higher.
Sellers Take Control: As the price started to fall from the top, look at the volume on the down bars. It got bigger. This tells us that supply (selling pressure) is now in control, and they are pushing the price down with force.
Where Are We Now?
The price has dropped and is now hovering around the $3,330 area. The volume has dried up for now, which means the market is taking a pause and deciding where to go next.
What to Watch For Next
Based on the VSA story, here are two possible scenarios:
Scenario 1 (Bearish 📉): The weakness continues. If we see the price try to rally from here but the volume is very low, it would be another major red flag. It would suggest sellers are still in control, and we could see a break below the recent low of $3,320 for another leg down.
Scenario 2 (Bullish 📈): This is a bear trap. For this to happen, we would need to see a strong sign of buying returning. For example, a sharp drop on massive volume that is quickly bought back up. This would signal that the sellers have been absorbed and smart money is starting to buy again.
Conclusion:
For now, the evidence points more towards weakness. The action at the top suggests that smart money was distributing (selling) their gold.
Key Takeaway: Be cautious of any weak-looking bounces. The sellers appear to have the upper hand until we see a clear sign of strength with high buying volume.
This is not financial advice. This is just my interpretation of the chart using VSA. Always do your own research and manage your risk. Good luck trading!

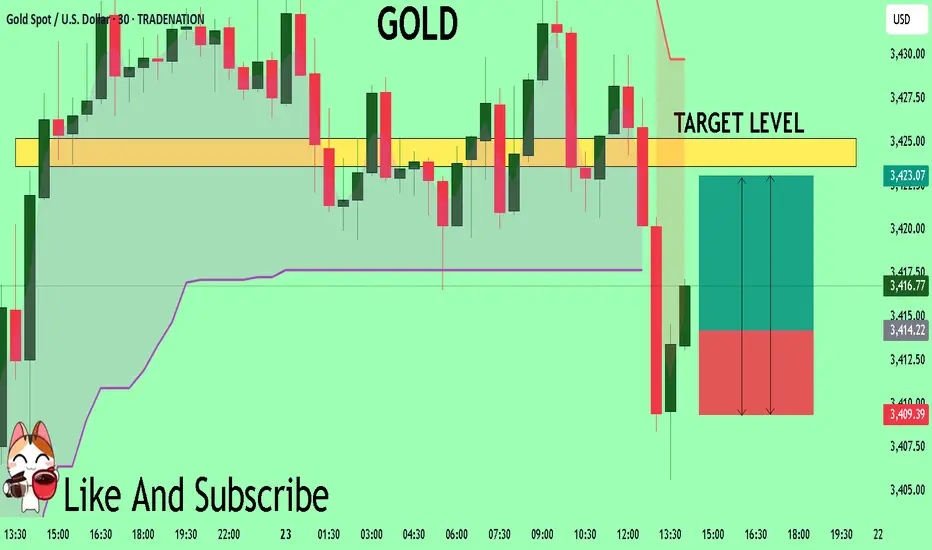
GOLD The Target Is UP! BUY!
My dear friends,
Please, find my technical outlook for GOLD below:
The price is coiling around a solid key level - 3414.2
Bias - Bullish
Technical Indicators: Pivot Points Low anticipates a potential price reversal.
Super trend shows a clear buy, giving a perfect indicators' convergence.
Goal - 3423.6
Safe Stop Loss - 3409.3
About Used Indicators:
The pivot point itself is simply the average of the high, low and closing prices from the previous trading day.
Disclosure: I am part of Trade Nation's Influencer program and receive a monthly fee for using their TradingView charts in my analysis.
———————————
WISH YOU ALL LUCK
Don't chase gold at high levels, buy more when it falls back to From the 4-hour analysis, today's support is around 3400-10. If the intraday retracement relies on this position, the main bullish trend remains unchanged. The short-term bullish strong dividing line focuses on the 3380 mark. If the daily level stabilizes above this position, the rhythm of retracement will continue. Short positions against the trend should be cautious.
Gold operation strategy:
Gold retracement to 3400-10 line to go long, retracement to 3390-95 line to cover long positions, stop loss 3379, target 3435-3440 line, continue to hold if it breaks;
XAUUSD BUYS EXPECTATIONS I'm expecting buys from the marked demand zone(OB) as indicated from the graph above... Who is in ☝🏾 let me see your hands up 😎

Gold could be an changing hand area False break for cemeterycal triangle. Could lead to to start a down trend for a medterm investment
Why Swing Trading and Scalping Are Opposite Worlds"It's not about the strategy. It's about who you are when the market puts pressure on you."
Most traders fail not because they don’t learn “strategies” — but because they pick a style that doesn't match their temperament.
And nothing creates more damage than confusing swing trading with scalping/intraday trading.
Let’s break them down. For real...
________________________________________
🔵 1. Swing Trader – Chasing Direction, Not Noise
A swing trader does not touch choppy markets.
He’s not here for the sideways grind. He wants momentum.
If there’s no clear trend, he doesn’t trade.
He shifts between assets depending on where real movement is.
• USD weakens → he buys EUR/USD and waits
• Gold breaks → he enters and lets the move develop
Swing trading means positioning with the macro flow, not chasing bottoms and tops.
✅ He trades based on H4/Daily or even Weekly charts
✅ He holds for hundreds of pips.
✅ He accepts contrarian candles in the process.
________________________________________
🔴 2. Scalper/Intraday Trader – The Asset Specialist
A true scalper doesn’t chase trends.
He hunts inefficiencies — quick spikes, fakeouts, liquidity grabs.
✅ Loves range conditions
✅ Lives inside M5–M15
✅ Often trades only one asset he knows like the back of his hand
He doesn’t care what EUR/USD will do this week.
He cares what it does in the next 30 minutes after a breakout.
Scalping is not chaos. It's cold execution with a sniper mindset.
📡 He reacts to news in real time.
He doesn’t predict — he exploits.
________________________________________
🧾 Key Differences – Swing Trader vs. Scalper
________________________________________
🎯 Primary Objective
• Swing Trader: Captures large directional moves over several days.
• Scalper/Intraday: Exploits short-term volatility, aiming for quick, small gains.
________________________________________
🧭 Market Conditions Preference
• Swing Trader: Needs clean, trending markets with clear momentum.
• Scalper/Intraday: Feels comfortable in ranging markets with liquidity spikes and noise.
________________________________________
🔍 Number of Instruments Traded
• Swing Trader: Monitors and rotates through multiple assets (e.g. XAUUSD, EURUSD, indices, BTC, he's going where the money is).
• Scalper/Intraday: Specializes in 1–2 instruments only, knows their behavior in every session.
________________________________________
⏰ Time Spent in Front of the Charts
• Swing Trader: Waits for clean setups, may hold positions for days or weeks.
• Scalper/Intraday: Constant screen time, executes and manages trades actively.
________________________________________
📰 Reaction to News
• Swing Trader: Interprets the macro/fundamental impact and positions accordingly.
• Scalper/Intraday: Reacts live to data releases, wicks, and intraday volatility.
________________________________________
📉 When They Struggle
• Swing Trader: Fails in choppy or directionless markets.
• Scalper/Intraday: Loses edge when the market trends explosively.
________________________________________
🧠 Psychological Requirements
• Swing Trader: Needs patience, confidence in the big picture, and acceptance of drawdown.
• Scalper/Intraday: Needs absolute discipline, emotional detachment, and razor-sharp focus.
________________________________________
✅ Bottom line: They are two different games.
Don’t try to play both on the same chart with the same mindset.
________________________________________
✅ Final Thoughts – Your Edge Is in Alignment, Not Imitation
You don’t pick a trading style because it “sounds cool.”
You pick it because it aligns with:
• Your schedule
• Your attention span
• Your tolerance for uncertainty
If you hate watching candles all day – go swing.
If you hate waiting for days – go intraday.
If you keep switching between both – go journal your pain and come back later.
P.S. Recent Example:
I'm a swing trader. And this week, Gold has been stuck in a range.
What do I do? I wait. No rush, no overtrading. Just patience.
Once the range breaks, I’m ready — in either direction.
But I don’t close after a quick 50–100 pip move. That’s not my game.
I aim for 700+ pips whether it breaks up or down,because on both sides we have major support and resistance levels that matter.
That’s swing trading:
📍 Enter with structure, hold with confidence, exit at significance.
Not every move is worth trading — but the big ones are worth waiting for.
Disclosure: I am part of TradeNation's Influencer program and receive a monthly fee for using their TradingView charts in my analyses and educational articles.
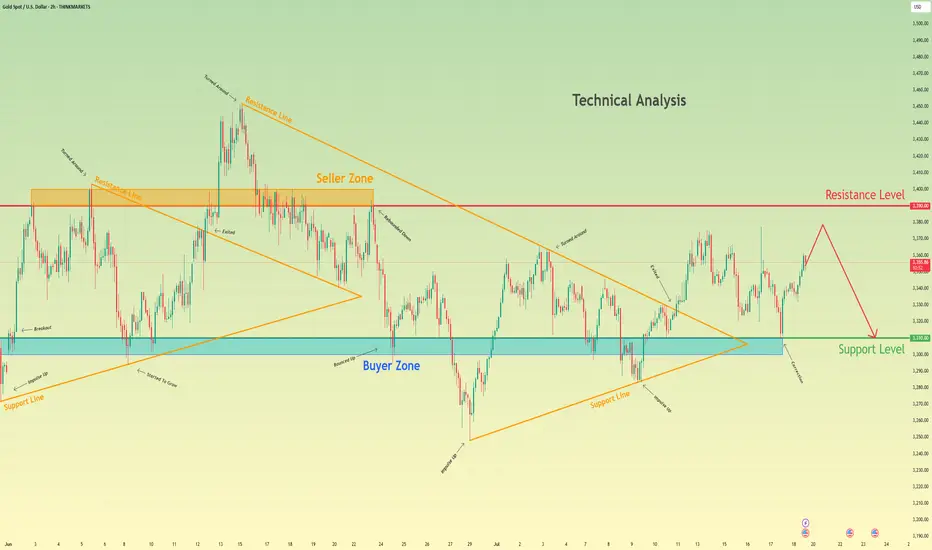
Gold may rise a little and then drop to support levelHello traders, I want share with you my opinion about Gold. Initially, gold was trading within a large consolidating pennant, showing both upward and downward impulses as it moved between the converging trend lines. The price eventually saw a breakout from this pattern, followed by a strong impulse up, but this momentum stalled as it approached the major horizontal resistance level at 3390. This level, which corresponds with the upper seller zone, has proven to be a significant barrier for buyers, rejecting the price and confirming a strong seller presence in that area. Currently, the market is in a corrective phase after being rejected from the highs. The price is drifting upwards once again in what appears to be a final retest of the aforementioned seller zone. This slow upward movement lacks the impulsive strength of the previous trend, suggesting that buyers are losing control and sellers are preparing to defend the 3390 resistance level once more. I expect this corrective move to fail upon reaching the seller zone around 3390. After this retest, I anticipate a sharp reversal and the beginning of a new downward trend. The logical target for this move is the major support level at 3310, an area that has historically acted as a strong buyer zone. That is why my TP is set at 3310. Please share this idea with your friends and click Boost 🚀
Disclaimer: As part of ThinkMarkets’ Influencer Program, I am sponsored to share and publish their charts in my analysis.