XBR/USD Chart Analysis: Oil Price Declines Towards Key SupportXBR/USD Chart Analysis: Oil Price Declines Towards Key Support
As the XBR/USD chart shows, Brent crude oil has made two significant moves recently:
Last week’s price increase (A) followed President Donald Trump’s intentions to impose tariffs on India due to its purchases of Russian oil. This could have disrupted established oil supply chains.
The price decline (B) may have been driven by both the decision of OPEC+ countries to increase production and reports of a weakening US labour market.
Thus, there is reason to believe that the more than 4.5% decline in Brent crude oil prices since the beginning of August reflects market participants’ scepticism about sustained high oil prices:
→ this has a negative impact on the US economy (JP Morgan analysts raised concerns about recession risks this week);
→ increased activity from oil producers may offset supply chain disruption risks.
Technical Analysis of the XBR/USD Chart
From a technical analysis perspective, Brent crude oil has dropped to a key support level (marked in blue), which was previously active in July. A rebound from this line could happen – in such a case, the price might face resistance at the Fair Value Gap area (marked in orange), formed between:
→ $70.81 – a support level active in late July, which was broken;
→ the psychological level of $70.00.
Attention should also be paid to price behaviour around the $69.00 level (indicated by arrows) – it quickly switched roles from support to resistance, indicating aggressive bearish sentiment. Given this observation, a potential bearish breakout attempt below the blue support line cannot be ruled out.
However, whether this scenario materialises will largely depend on developments in geopolitical risks and tariff agreements.
This article represents the opinion of the Companies operating under the FXOpen brand only. It is not to be construed as an offer, solicitation, or recommendation with respect to products and services provided by the Companies operating under the FXOpen brand, nor is it to be considered financial advice.
XBRUSD trade ideas

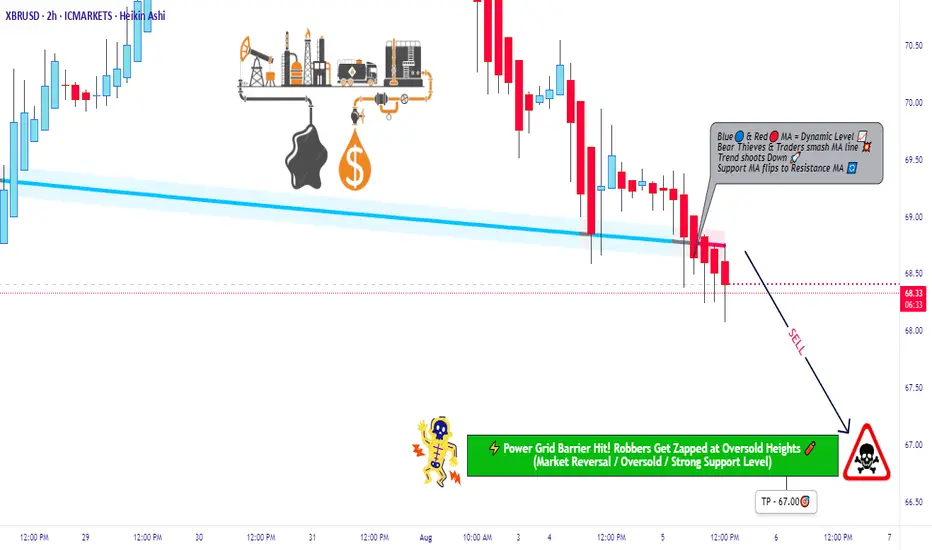
XBRUSD Robbery Setup: Thief's Bear Trap is Active! 🔥💰BRENT BEARISH HEIST PLAN💰🔥
🎯 Asset: XBRUSD / UK Oil Spot / BRENT
🧠 Strategy: Layered Limit Orders | Bearish Robbery in Progress
💼💣💼
Yo Money Movers & Market Jackers!
It’s time to load up the truck and roll out — the BRENT vault is cracked open and dripping with bearish loot! 🐻💵🔓
🎩 This isn’t just trading — this is Thief Trading Style™.
We don’t chase candles. We layer the loot, wait in the shadows, and strike on the pullback. No mercy. Just money. 💸🕶️
🚨 THIEF'S TRADE SETUP 🚨
🕵️ Entry Point:
Any Price Level – we’re everywhere.
Place layered Sell Limits like tripwires on the chart 🎯💣 — 15m or 30m candle nearest swing highs. The trap is set.
🛑 Stop Loss:
🔒 Locked @ 69.50 — right above resistance
This is a tactical retreat, not a failure. Every heist needs an escape route. 📉🔁
🎯 Target Zone:
💥 Aim for 67.00 — smash and grab style.
Get in, take profit, disappear into the shadows.
🧠 WHY THE HEIST?
The BRENT market looks ready for a rug pull —
🧊 Demand slowing
📉 Bearish structure unfolding
🎭 Bull traps getting exposed
🔥 Perfect time for thieves to cash out while the herd dreams green
Before pulling the trigger, check:
📰 Fundamentals 📦 Inventory Data 🧭 Intermarket Analysis 📊 COT Reports
Do your homework — then rob it like a professional. 🧠💼🔎
⚠️ MISSION WARNING ⚠️
Avoid new trades during news drops!
Use trailing SLs to protect loot. This market doesn’t play fair — but we don’t either. 🛑📰📉
💥 Hit BOOST if you're riding with the robbers!
Let’s show this market how Thief Traders steal gains like legends.
Every like = one more gold bar in the van 💰🚚💨
Stay sharp. Stay shadowed.
See you on the next job. 🐱👤💸📉
🔗 #Brent #XBRUSD #UKOil #ThiefTrader #BearishSetup #EnergyMarket #LayeringStrategy #MarketRobbery #SellThePump #RobTheChart
WTI short in OPEC production hike and technical breakout Interesting chart for WTI with a nice daily downtrend and 4hr counter trendline + support level for a breakout. This is further supported by the OPEC production hike, would like to see a higher inventories reading too.
Things that could negatively effect this position are sanctions being put on Russia or countries buying oil from Russia as well as continued geopolitical tensions support price.
BRENT: OPEC+ Reacts as a New Geopolitical Chapter LoomsIon Jauregui – Analyst at ActivTrades
The oil market is bracing for a new episode of high tension. With Brent stabilizing around $70 per barrel, OPEC+ has made a decisive move: starting in September, it will increase production by 547,000 barrels per day—a decision that could significantly alter the global supply-demand balance. The announcement comes at a critical moment, marked by political pressure, conflicting interests, and an increasingly uncertain geoeconomic backdrop. September 7 is shaping up to be the next major turning point for the market.
Fundamental Analysis
OPEC+’s decision to increase output effectively erases its largest remaining production cut, implemented during the height of the pandemic. The group is not only restoring supply but has also granted the United Arab Emirates an additional quota equivalent to 2.4% of global demand—an internal rebalancing that could create tension within the cartel.
Meanwhile, diplomatic pressure continues to mount. The United States, maintaining a firm stance inherited from the Trump era, keeps urging India and other major consumers to reduce their dependence on Russian oil. This dynamic complicates the outlook for countries that have benefited from discounted Russian crude in recent years and reopens the debate over strategic energy alliances.
The current environment is defined by increasing supply, sustained demand, and growing political pressure on certain trade flows. All these factors suggest a more volatile market, highly sensitive to any disruption in the balance.
Technical Analysis
From a technical perspective, Brent remains stuck in a downward-sloping sideways structure. Prices are fluctuating between key support at $67.50 and strong resistance at $79. Volume has declined in recent sessions, indicating trader caution ahead of upcoming OPEC+ decisions.
A clear breakout above the $72.74 resistance could pave the way for a bullish move toward the next target zone at $75–76, while a drop below $67.50 would activate a corrective scenario targeting the $64–65 area. Both RSI and MACD indicators are showing neutral signals with no clear trend, reinforcing the short-term consolidation outlook.
The next move will largely depend on how events unfold around September 7, a date that could redefine the market balance.
*******************************************************************************************
The information provided does not constitute investment research. The material has not been prepared in accordance with the legal requirements designed to promote the independence of investment research and such should be considered a marketing communication.
All information has been prepared by ActivTrades ("AT"). The information does not contain a record of AT's prices, or an offer of or solicitation for a transaction in any financial instrument. No representation or warranty is given as to the accuracy or completeness of this information.
Any material provided does not have regard to the specific investment objective and financial situation of any person who may receive it. Past performance and forecasting are not a synonym of a reliable indicator of future performance. AT provides an execution-only service. Consequently, any person acting on the information provided does so at their own risk. Political risk is unpredictable. Central bank actions can vary. Platform tools do not guarantee success.

BRENT Robbery Setup: Thief's Bear Trap is Active!🔥💰BRENT BEARISH HEIST PLAN💰🔥
🎯 Asset: BRENT/ XBRUSD / UK Oil Spot
🧠 Strategy: Layered Limit Orders | Bearish Robbery in Progress
💼💣💼
Yo Money Movers & Market Jackers!
It’s time to load up the truck and roll out — the BRENT vault is cracked open and dripping with bearish loot! 🐻💵🔓
🎩 This isn’t just trading — this is Thief Trading Style™.
We don’t chase candles. We layer the loot, wait in the shadows, and strike on the pullback. No mercy. Just money. 💸🕶️
🚨 THIEF'S TRADE SETUP 🚨
🕵️ Entry Point:
Any Price Level – we’re everywhere.
Place layered Sell Limits like tripwires on the chart 🎯💣 — 15m or 30m candle nearest swing highs. The trap is set.
🛑 Stop Loss:
🔒 Locked @ 69.000 — right above resistance
This is a tactical retreat, not a failure. Every heist needs an escape route. 📉🔁
🎯 Target Zone:
💥 Aim for 65.000 — smash and grab style.
Get in, take profit, disappear into the shadows.
🧠 WHY THE HEIST?
The BRENT market looks ready for a rug pull —
🧊 Demand slowing
📉 Bearish structure unfolding
🎭 Bull traps getting exposed
🔥 Perfect time for thieves to cash out while the herd dreams green
Before pulling the trigger, check:
📰 Fundamentals 📦 Inventory Data 🧭 Intermarket Analysis 📊 COT Reports
Do your homework — then rob it like a professional. 🧠💼🔎
⚠️ MISSION WARNING ⚠️
Avoid new trades during news drops!
Use trailing SLs to protect loot. This market doesn’t play fair — but we don’t either. 🛑📰📉
💥 Hit BOOST if you're riding with the robbers!
Let’s show this market how Thief Traders steal gains like legends.
Every like = one more gold bar in the van 💰🚚💨
Stay sharp. Stay shadowed.
See you on the next job. 🐱👤💸📉
🔗 #Brent #XBRUSD #UKOil #ThiefTrader #BearishSetup #EnergyMarket #LayeringStrategy #MarketRobbery #SellThePump #RobTheChart

Oil surges on Russia sanction threats but long-term risks remainOil prices have climbed around 6% this week, driven by two key developments: a trade deal between the EU and the US, and Donald Trump’s warning that the US may impose sanctions on Russian oil buyers within 10 days unless progress is made toward ending the Russia-Ukraine war.
Russia accounts for about 10.5% of global oil production. Major buyers like China and India, which take 47% and 38% of Russia’s crude exports respectively, are still negotiating their trade deals with the US. That gives Washington leverage to pressure them into cutting back without fully banning imports, which would risk triggering a much sharper price surge.
If China, India, the EU, and Turkey shift away from Russian oil, demand would rise elsewhere, supporting prices. Still, while the short-term technical picture remains bullish above 67.28, prices face resistance between 75.43 and 77.80. This range marks the upper bound of a multi-year downward channel.
OPEC+ also meets this weekend. The group has been increasing production to align with Trump’s promise to lower oil prices, a move that weighs on the long-term outlook. Add to that the impact of new tariffs—15% on EU and Japan exports, 10% on UK goods, and likely more to come for China and India—and global GDP growth could slow, further capping oil’s upside.
Unless prices break convincingly above 77.80, the broader trend remains bearish.
This content is not directed to residents of the EU or UK. Any opinions, news, research, analyses, prices or other information contained on this website is provided as general market commentary and does not constitute investment advice. ThinkMarkets will not accept liability for any loss or damage including, without limitation, to any loss of profit which may arise directly or indirectly from use of or reliance on such information.


Brent: Crude Loses Its Shine Amid Mass Selloffs and Global FearsBy Ion Jauregui – Analyst at ActivTrades
Bearish pressure is intensifying in the oil market, with Brent crude leading the liquidation among major investment funds. The expiration of U.S. tariff exemptions on August 1st, combined with a global economic slowdown, has triggered a wave of risk aversion across energy commodities.
Funds Exit Oil: Alarming Figures
According to the latest data from the CFTC and ICE, hedge funds cut their net long positions in Brent by 11,352 contracts, bringing the total down to 227,393, the lowest level since April. For West Texas Intermediate (WTI), the decline was even sharper—over 10,000 contracts, reducing the net exposure to 86,088.
The bearish trend extends to refined products. U.S. diesel net positions fell to 38,945 contracts, although pure long positions reached 54,053, the highest level since February. In contrast, European gasoil showed relative strength as a safe haven, with long contracts increasing by 7,632 to 132,133—the highest level in more than three years.
Brent Technical Analysis: Critical Zone Under Pressure
From a technical perspective, Brent failed to break through the key $80 resistance level on June 23rd, which intensified selling pressure. Throughout July, prices have consolidated within an accumulation zone around $68, close to current levels. The year’s lows, recorded in May at $58.16, suggest a structural support around $62.41.
The loss of the 50- and 100-day moving averages reinforces the bearish bias. Should the current support break, Brent could swiftly move toward $64, a key technical support zone. Conversely, if prices hold above this level, a rebound toward the control zone around $72 could follow.
Technical indicators support the pessimistic outlook: the RSI stands at 48.32, in neutral territory but lacking upward momentum, while the MACD shows a bearish expansion, potentially signaling further downside unless strong buying emerges in the short term.
Valuations in Question
Despite the recent correction, the energy sector within the S&P 500 maintains an estimated P/E ratio of 15, above its historical average of 11–12, though still below the broader index average (~26×). This raises the classic dilemma: is this a value opportunity or a value trap in a structurally weakening demand cycle?
Conclusion
The oil market is facing a double challenge: weakened fundamentals and bearish technical signals. With institutional flows pulling back, macro uncertainty rising, and momentum indicators flashing red, caution is warranted.
The current levels may mark a strategic inflection point—or simply the prelude to deeper declines.
*******************************************************************************************
La información facilitada no constituye un análisis de inversiones. El material no se ha elaborado de conformidad con los requisitos legales destinados a promover la independencia de los informes de inversiones y, como tal, debe considerarse una comunicación comercial.
Toda la información ha sido preparada por ActivTrades ("AT"). La información no contiene un registro de los precios de AT, o una oferta o solicitud de una transacción en cualquier instrumento financiero. Ninguna representación o garantía se da en cuanto a la exactitud o integridad de esta información.
Cualquier material proporcionado no tiene en cuenta el objetivo específico de inversión y la situación financiera de cualquier persona que pueda recibirlo. La rentabilidad pasada y las estimaciones no sinónimo ni un indicador fiable de la rentabilidad futura. AT presta un servicio exclusivamente de ejecución. En consecuencia, toda persona que actúe sobre la base de la información facilitada lo hace por su cuenta y riesgo. Los tipos de interés pueden cambiar. El riesgo político es impredecible. Las acciones de los bancos centrales pueden variar. Las herramientas de las plataformas no garantizan el éxito.

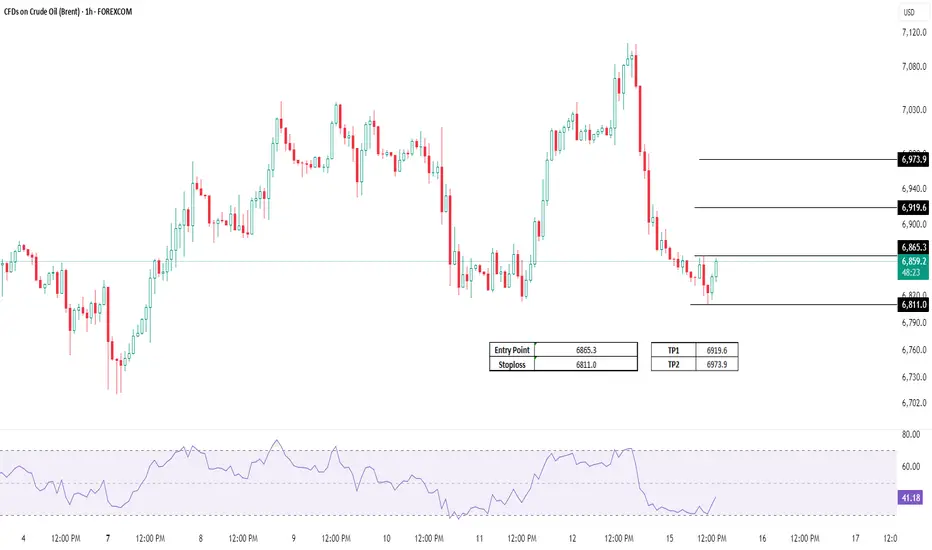
Brent Crude key support zone at 6800The Brent Crude Oil remains in a neutral trend, with recent price action showing signs of a corrective pullback within the broader uptrend.
Support Zone: 6800 – a key level from previous consolidation. Price is currently testing or approaching this level.
A bullish rebound from 6800 would confirm ongoing upside momentum, with potential targets at:
7095 – initial resistance
7200 – psychological and structural level
7317 – extended resistance on the longer-term chart
Bearish Scenario:
A confirmed break and daily close below 6800 would weaken the bullish outlook and suggest deeper downside risk toward:
6680 – minor support
6580 – stronger support and potential demand zone
Outlook:
Neutral bias remains intact while the Brent trades around pivotal 6800 level. A sustained break below or above this level could shift momentum.
This communication is for informational purposes only and should not be viewed as any form of recommendation as to a particular course of action or as investment advice. It is not intended as an offer or solicitation for the purchase or sale of any financial instrument or as an official confirmation of any transaction. Opinions, estimates and assumptions expressed herein are made as of the date of this communication and are subject to change without notice. This communication has been prepared based upon information, including market prices, data and other information, believed to be reliable; however, Trade Nation does not warrant its completeness or accuracy. All market prices and market data contained in or attached to this communication are indicative and subject to change without notice.

Brent Crude Oil Wave Analysis – 5 August 2025- Brent Crude Oil broke support zone
- Likely to fall to support level 66.00
Brent Crude Oil recently broke the support zone between the key support level of 68.00 (which reversed the price multiple times in July) and the two support trendlines from May.
The breakout of this support zone accelerated the active impulse wave iii of the higher order impulse wave 3 from the middle of June.
Brent Crude Oil can be expected to fall to the next support level 66.00 (former resistance from May and the low of the earlier impulse wave i).

UKOIL Short UKOIL prices may decline from the $73.7 level within the Fair Value Gap (FVG) zone, targeting a lower FVG zone as the next potential objective.

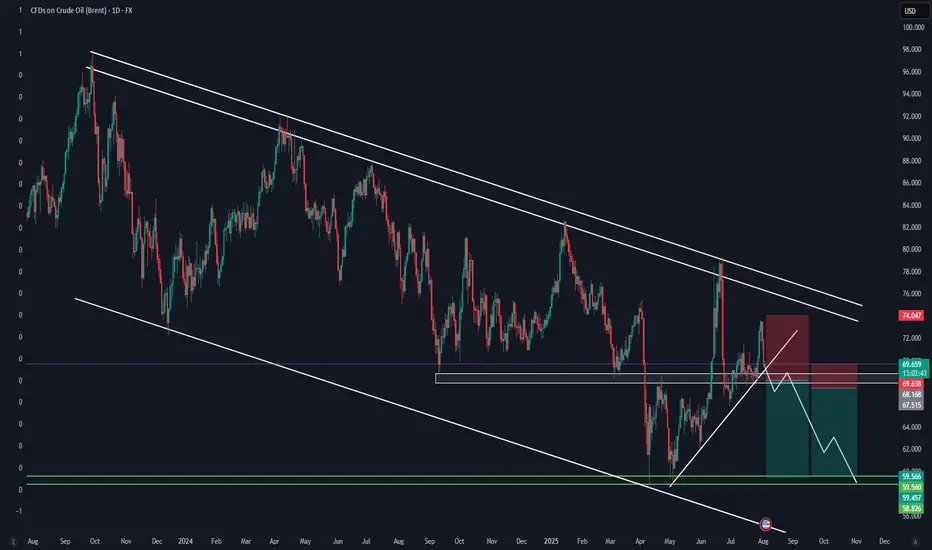
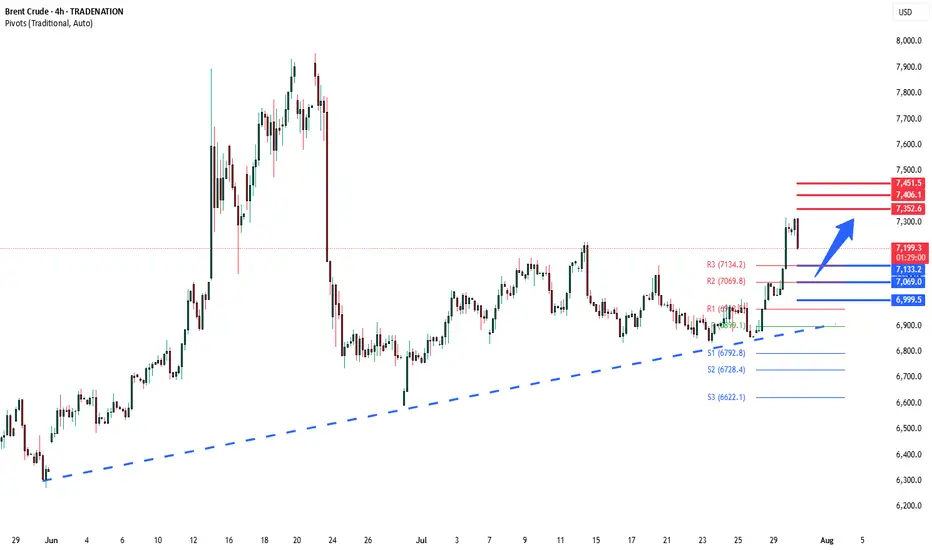
Brent Crude corrective pullback support at 7133The Brent Crude remains in a bullish trend, with recent price action showing signs of a corrective pullback within the broader uptrend.
Support Zone: 7133 – a key level from previous consolidation. Price is currently testing or approaching this level.
A bullish rebound from 7133 would confirm ongoing upside momentum, with potential targets at:
7352 – initial resistance
7406 – psychological and structural level
7451 – extended resistance on the longer-term chart
Bearish Scenario:
A confirmed break and daily close below 7133 would weaken the bullish outlook and suggest deeper downside risk toward:
7069 – minor support
7000 – stronger support and potential demand zone
Outlook:
Bullish bias remains intact while the Gold holds above 7133. A sustained break below this level could shift momentum to the downside in the short term.
This communication is for informational purposes only and should not be viewed as any form of recommendation as to a particular course of action or as investment advice. It is not intended as an offer or solicitation for the purchase or sale of any financial instrument or as an official confirmation of any transaction. Opinions, estimates and assumptions expressed herein are made as of the date of this communication and are subject to change without notice. This communication has been prepared based upon information, including market prices, data and other information, believed to be reliable; however, Trade Nation does not warrant its completeness or accuracy. All market prices and market data contained in or attached to this communication are indicative and subject to change without notice.
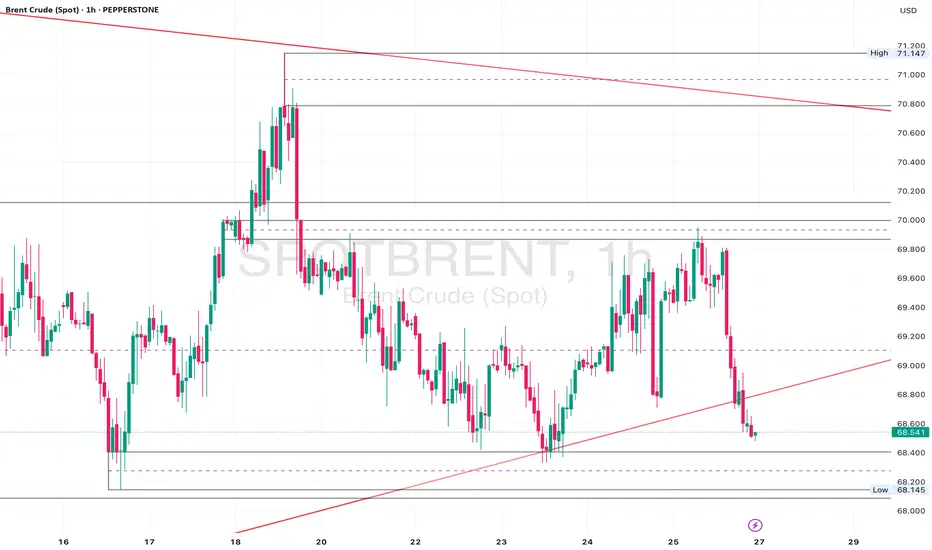
Brent Crude Sitting at Key Support – 69.20 Hold for a Rebound?Daily Analysis:
Price is holding above the ascending trendline and forming higher lows. Multiple rejections from the 68.00 region suggest strong demand. As long as we remain above the trendline, bulls stay in control.
4H Analysis:
Pullback after rejecting 71.00. Now sitting inside the 69.60–69.20 demand area. Bullish channel is still valid unless we break below 68.50.
1H Analysis:
Price broke the rising channel but is now hovering near key support. Bullish re-entry possible if lower timeframe aligns around 69.60.
Confirmation & Entry:
If we see bullish engulfing or pin bar at 69.60–69.20, this could signal a long setup back to 71.00. Invalidated on clean break below 68.50.
Brent Oil H4 | Heading into a swing-high resistanceBrent oil (UKOIL) is rising towards a swing-high resistance and could potentially reverse off this level to drop lower.
Sell entry is at 70.39 which is a swing-high resistance that aligns closely with the 78.6% Fibonacci retracement.
Stop loss is at 71.90 which is a level that sits above the 127.2% Fibonacci extension and a swing-high resistance.
Take profit is at 66.39 which is a swing-low support.
High Risk Investment Warning
Trading Forex/CFDs on margin carries a high level of risk and may not be suitable for all investors. Leverage can work against you.
Stratos Markets Limited (tradu.com ):
CFDs are complex instruments and come with a high risk of losing money rapidly due to leverage. 66% of retail investor accounts lose money when trading CFDs with this provider. You should consider whether you understand how CFDs work and whether you can afford to take the high risk of losing your money.
Stratos Europe Ltd (tradu.com ):
CFDs are complex instruments and come with a high risk of losing money rapidly due to leverage. 66% of retail investor accounts lose money when trading CFDs with this provider. You should consider whether you understand how CFDs work and whether you can afford to take the high risk of losing your money.
Stratos Global LLC (tradu.com ):
Losses can exceed deposits.
Please be advised that the information presented on TradingView is provided to Tradu (‘Company’, ‘we’) by a third-party provider (‘TFA Global Pte Ltd’). Please be reminded that you are solely responsible for the trading decisions on your account. There is a very high degree of risk involved in trading. Any information and/or content is intended entirely for research, educational and informational purposes only and does not constitute investment or consultation advice or investment strategy. The information is not tailored to the investment needs of any specific person and therefore does not involve a consideration of any of the investment objectives, financial situation or needs of any viewer that may receive it. Kindly also note that past performance is not a reliable indicator of future results. Actual results may differ materially from those anticipated in forward-looking or past performance statements. We assume no liability as to the accuracy or completeness of any of the information and/or content provided herein and the Company cannot be held responsible for any omission, mistake nor for any loss or damage including without limitation to any loss of profit which may arise from reliance on any information supplied by TFA Global Pte Ltd.
The speaker(s) is neither an employee, agent nor representative of Tradu and is therefore acting independently. The opinions given are their own, constitute general market commentary, and do not constitute the opinion or advice of Tradu or any form of personal or investment advice. Tradu neither endorses nor guarantees offerings of third-party speakers, nor is Tradu responsible for the content, veracity or opinions of third-party speakers, presenters or participants.

Possible Bullish Setup on 1Hr Brent Crude.Possible bullish setup on the 1hr Brent.
A break below setup triggers a bearish position to target price area.
Best of luck in all your trades.

Oil Brent I think Brent oil will make another low and then rise again to the $90 range and then have a sharp correction.
Majidbabaeiasl Tehran iran
1404 / 05/02

Brent Crude Oil capped by resistance at 7050 Key Support and Resistance Levels
Resistance Level 1: 7050
Resistance Level 2: 7130
Resistance Level 3: 7220
Support Level 1: 6800
Support Level 2: 6700
Support Level 3: 6590
This communication is for informational purposes only and should not be viewed as any form of recommendation as to a particular course of action or as investment advice. It is not intended as an offer or solicitation for the purchase or sale of any financial instrument or as an official confirmation of any transaction. Opinions, estimates and assumptions expressed herein are made as of the date of this communication and are subject to change without notice. This communication has been prepared based upon information, including market prices, data and other information, believed to be reliable; however, Trade Nation does not warrant its completeness or accuracy. All market prices and market data contained in or attached to this communication are indicative and subject to change without notice.

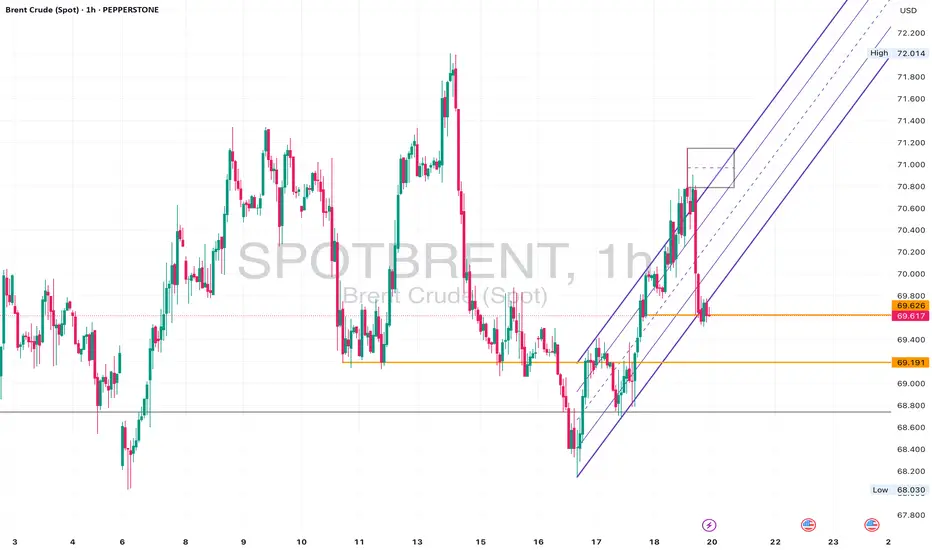
Brent UKOil - Neutral Slightly Bearish • Daily: Price is sitting above long-term trendline support, but momentum is waning.
• 4H: Structure looks indecisive with constant failures near 71.00.
• 1H: Recent break of the upward channel. Now retesting that zone from below.
⚠️ Watch For:
• Retest of 69.60–70.00 as resistance.
• Break and close below 69.20 could signal deeper downside.
• If it holds above 70.20 again, bullish bias resumes.
Crude Oil Setup in ProgressOil is in an uptrend, and I expect it to continue.
At the moment, the stop-loss would be too wide — around 3.5%, which is a bit too much for my portfolio, especially considering I already have a wide stop on palladium.
On the 1-hour chart, I’m watching for a possible entry slightly below the current level. For now, just observing.

BCOUSD Long Swing Setup – Holding Support with Upside PotentialNYSE:BCO is currently sitting on a key support level, offering a potential long spot entry as buyers defend the $69.50 zone. A bounce from here could open the way for a move toward higher resistance levels.
📌 Trade Setup:
• Entry Zone: Around $69.50
• Take Profit Targets:
o 🥇 $73.50 – $76.00
o 🥈 $79.00 – $83.00
• Stop Loss: Daily close below $67.00

Brent Crude Oil loss of support now resistance at 7050Key Support and Resistance Levels
Resistance Level 1: 7050
Resistance Level 2: 7130
Resistance Level 3: 7220
Support Level 1: 6800
Support Level 2: 6700
Support Level 3: 6590
This communication is for informational purposes only and should not be viewed as any form of recommendation as to a particular course of action or as investment advice. It is not intended as an offer or solicitation for the purchase or sale of any financial instrument or as an official confirmation of any transaction. Opinions, estimates and assumptions expressed herein are made as of the date of this communication and are subject to change without notice. This communication has been prepared based upon information, including market prices, data and other information, believed to be reliable; however, Trade Nation does not warrant its completeness or accuracy. All market prices and market data contained in or attached to this communication are indicative and subject to change without notice.

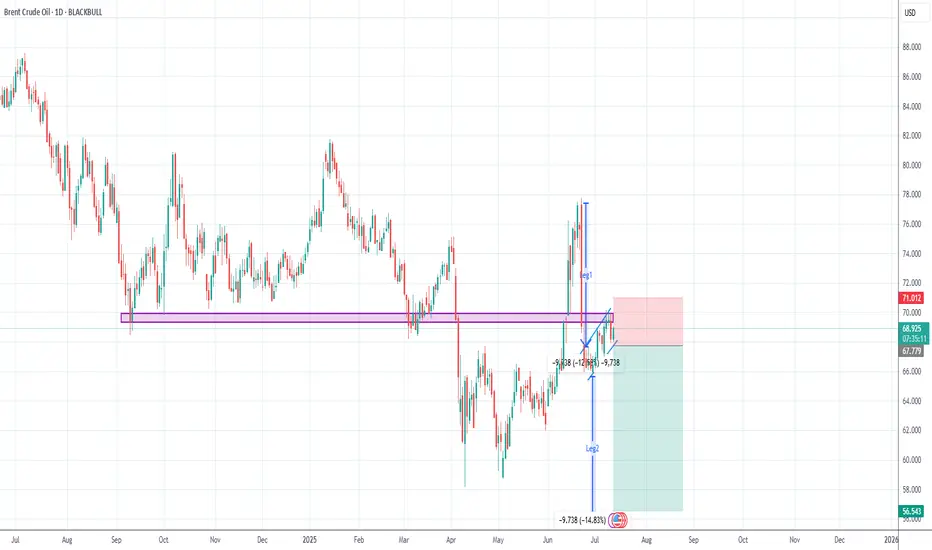
Wajani Investments analysis of BRENT AND WTI BRENT has formed a bearish flag. 80% of the time Leg1 always moves to equate Leg 2. The purple rectangle support turns resistance clarifying to false breakout of BRENT to the upside. However, if it breaks the flag to the upside, treat it as a change in trend.
Trading always carries risk, and this IS NOT A FINANCIAL ADVICE but only for EDUCATIONAL PURPOSES.
Let me know your thoughts.
Thank you.