Rally on BrentBrent is still inside its long-term descending channel and has not yet broken out of this range. And there is a price corrective movement that is formed in the form of a rally base rally pattern that can be profited from the second rally movement.
XBRUSD trade ideas


BCOUSD#Brent crude oil - H1
📣 Based on the chart structure on the 1-hour timeframe, if the downtrend is broken around 75.84, there is an expectation for price growth towards the range of 78.00.
⛔ Stop Loss: 74.30
On the other hand, with a break below the range of 74.30, one can consider selling with a target of 72.40.
⛔ Stop Loss: 75.84

what next for oilChart good looking for Rise after A correction Wait for the flag in the down time to confirm the promotion

DeGRAM | UKOIL short from the kill zoneUKOIL is trading in the descending channel, making lower lows.
It pulled back following the divergence at the support level.
Price is testing the resistance level, which creates a kill zone to short the market.
We anticipate a trend-continuation trade.
-------------------
Share your opinion in the comments and support the idea with a like. Thanks for your support!

Brent Oil - 1HIf the range of 75.5 units is broken downwards and the price stabilizes below it, the price may fall to the range of 74.0 units, and in case of strength, the range of 73.0 units
Otherwise, the possibility of price increase up to the range of 79.5 units

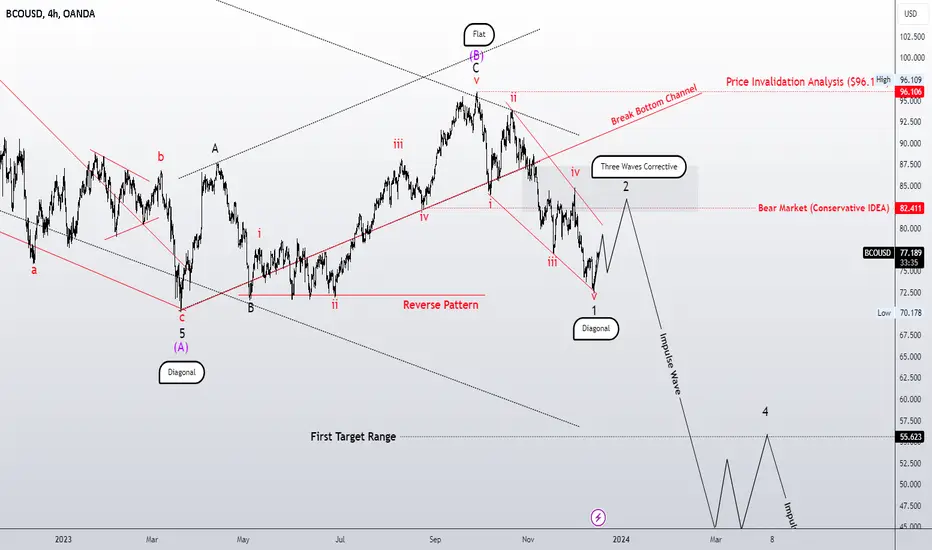
First Wave Leading Diagonal, Three Waves Corrective NowHello!
I am a big fan of the Elliott wave principle, which I find very interesting and useful for market analysis. I have developed my analytical approach by combining this principle with my personal experience and considering various scenarios that could occur in the market.
While I would like to share my analysis with you, please note that I am not providing a buy or sell signal. My primary intention is to share my unbiased analysis so that you can utilize it as a guide to make an informed decision.
To build your confidence in my analysis, I always share my previous analysis from the same market so that you can compare and see the progress. All the details of my analysis are clearly labeled, which should make it easy for you to understand.
I hope that my analysis is useful to you in your business journey, and I wish you all the best.
I am looking forward to hearing from you. Lastly, I would like to mention that like-mindedness and support, comments, and likes are the most important pillars of progress, just like support points in the financial markets. They give me the energy to continue and share more ideas with you.
Sincerely,
Sideway Correction For Wave BHello!
I am a big fan of the Elliott wave principle, which I find very interesting and useful for market analysis. I have developed my analytical approach by combining this principle with my personal experience and considering various scenarios that could occur in the market.
While I would like to share my analysis with you, please note that I am not providing a buy or sell signal. My primary intention is to share my unbiased analysis so that you can utilize it as a guide to make an informed decision.
To build your confidence in my analysis, I always share my previous analysis from the same market so that you can compare and see the progress. All the details of my analysis are clearly labeled, which should make it easy for you to understand.
I hope that my analysis is useful to you in your business journey, and I wish you all the best.
I am looking forward to hearing from you. Lastly, I would like to mention that like-mindedness and support, comments, and likes are the most important pillars of progress, just like support points in the financial markets. They give me the energy to continue and share more ideas with you.
Sincerely,

Brent Cash Analysis 14/12/2023The entry, exit and stop loss points are on the chart, please make sure of them and do not risk, this is our analysis and ideas.
Please observe the capital carefully and do not risk more than 1% of your capital
Good luck to everyone

Oil: Head & Shoulders Pattern,Heading Back to the $60 Territory?Hi Fellow Realistic Traders. Here's my latest price action analysis on Oil!
The oil market has recently witnessed a significant head and shoulders pattern breakout, signaling a clear shift towards a bearish reversal scenario. Subsequently, the price has persistently descended below the EMA200 line, affirming the establishment of a robust downtrend. Further underscoring this trend, the Stochastic indicator revealed a bearish divergence, suggesting a potential sustained downward movement towards our target area.
It is essential to note that the analysis will no longer hold validity once the target/resistance area is reached.
Disclaimer:
"Please note that this analysis is solely for educational purposes and should not be considered a recommendation to take a long or short position on $UKOIL."

Brent Crude Oil - Possible reversal upwardsTaking a shot at a possible bottom in Brent Crude Oil.
Price is currently at support zone (grey area). I am taking a long with SL at 71, which is below support.
Basis of this trade is purely from an Elliott Wave perspective.
5 waves of two degrees are done, and I take this as a C wave.
Minimum target is 84.50, with a possibility to reach Wave B at 93.80.

Brent oil sell opportunity Sell opportunity on Brent oil
There is Fibonacci cluster and tick volume node at specified price that possible to make second sell off opportunity


Weekly Price Prediction: $78.00 (Min) and $87.50 (Max)Projected Price Range
The anticipated weekly price range for Brent Crude Oil is expected to fluctuate between $75.62 (Min) and $81.93 (Max).
Contended Price Levels
$81.00 - $78.00 High Volume Node - potential support
$81.73 Resistance Line - potential resistance
$75.62 Support Line - potential support
Technical Analysis
Fibonacci Retracement Breakout:
The price has gone below the 0.5 Fibonacci level. This level is currently just a dollar above the blue resistance line.
Volume Profile Analysis:
High Volume Nodes (HVM):
Bottom HVM: Signifying an area of good liquidity and a potential support region. The price has stalled in this area over the last few weeks. If the price breaks downwards it could carry on.
MACD and Stochastic RSI:
Stoch RSI (Bottom Indicator): It has crossed over at the bottom and now has just about crossed over at the top. Showing overbought pressure and a potential downturn.
MACD (Top Indicator): This indicator has maintained just below the negative region and has refused to move out over the last few weeks. I don't see it going anywhere this week. I believe it will stay and we won't see a bullish signal this week from this indicator.
Additional Factors
Prior Resistance ( Top Blue Line):
Just above the Bottom HVM, a blue line represents a prior resistance level.
The blue line just crosses over the current price bar. Could be a potential resistance area as well.
Prior Support (Bottom Blue Line):
This represents a support level for the price. This may be crucial if broken as the HVM is just above it.
The blue line just crosses over the current price bar. Could be a potential support area as well.
Geopolitical Events:
Given the volatile nature of the commodities market, traders are advised to stay vigilant regarding any geopolitical events in the upcoming week, as these events can significantly impact oil prices.
Conclusion
To conclude we see the price range being between $75.62 (Min) and $81.93 (Max). This is due to the price staying within the HVM and seeing support with also a support line just below the HVM. However, there is a resistance line just above the HVM as well. These two support and resistance lines make our price range for this week. The Stoch RSI is showing a bearish sentiment so this will be crucial to watch out for. Also, something else which is crucial to watch out for is the blue line that has already crossed the current price bar. This will form new support/resistance. The MACD is effectively null this week.

Brent (ICE) may rise to 76.90 - 77.50Pivot
75.85
Our preference
Long positions above 75.85 with targets at 76.90 & 77.50 in extension.
Alternative scenario
Below 75.85 look for further downside with 75.35 & 75.00 as targets.
Comment
The RSI shows upside momentum.
Supports and resistances
78.20
77.50
76.90
76.54 Last
75.85
75.35
75.00
Number of asterisks represents the strength of support and resistance levels.

Pump and dumpLooking to speculate oil prices to hit the mainstream news causing interest in the OIL prices before investors dump the oil.
Since The Russian oil price cap no longer works (people buying Russian oil for more than $60 a barrel). OPEC will continue trading business as usual no longer putting a cap on oil reducing prices down to actually hit $60 a barrel for general consumers.
Going into 2024 everyone will be in good trading relations

Brent (ICE) may fall to 74.45 - 75.10Daily and weekly charts are also bearish.
Pivot
76.30
Our preference
Short positions below 76.30 with targets at 75.10 & 74.45 in extension.
Alternative scenario
Above 76.30 look for further upside with 76.80 & 77.50 as targets.
Comment
The RSI is bearish and calls for further downside.
Supports and resistances
77.50
76.80
76.30
75.59 Last
75.10
74.45
73.60
Number of asterisks represents the strength of support and resistance levels.


DeGRAM | UKOIL pullback tradeUKOIL is in the bearish trend. It's trading in the descending channel.
Price dropped below the significant level at 80.00 , which creates a confluence zone to short the market.
We anticipate a trend-continuation trade from the resistance and 50% fibo retracement.
-------------------
Share your opinion in the comments and support the idea with a like. Thanks for your support!

Brent Oil spot Buy n Sell zones.I love trading Brent oil spot. I have marked Buy n Sell zones. I will try to trade only on these levels.
Target will be at least 300-500 points from zone.
Please like and share.
Thanks.

Brent (ICE) may rise to 76.20 - 76.80Pivot
74.75
Our preference
Long positions above 74.75 with targets at 76.20 & 76.80 in extension.
Alternative scenario
Below 74.75 look for further downside with 74.20 & 73.60 as targets.
Comment
The RSI advocates for further advance.
Supports and resistances
77.50
76.80
76.20
75.57 Last
74.75
74.20
73.60
Number of asterisks represents the strength of support and resistance levels.

Crude Oil , Brent, getting ready for near bullish reversal Crude Oil , Brent, per US dollar , is getting ready for near bullish reversal ,
Go long when you the price failing to break below 76.6 .
So try to trade a divergence , reversal pattern , change of character , first breakout or bullish break of structure and so on
