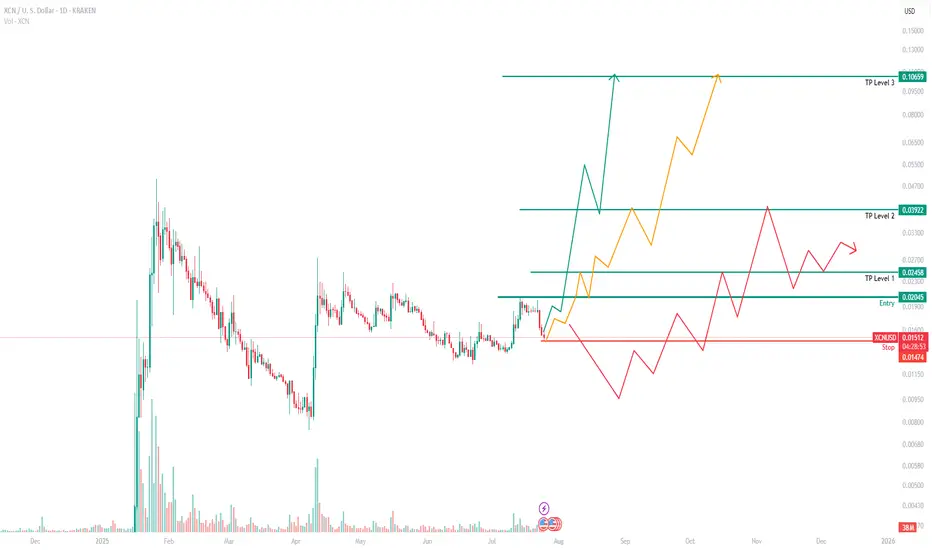
XCN: A potential 4x returnAt Ralfetto, we see so many charts daily, but few remind us of XRP. XCN is just that. XCN reminds us of XRP in its early days when you could purchase 1 XRP for under 1c.
As a project, we are unaware of the fundamentals, only what the chart is telling us, and its showing bullishness against BTC, XRP, XLM and other currencies we feel have a long strong future forward.
In short:
Buying range, between 0.012 and 0.019
Latest entry - 0.02
Target Price 1 = 0.024
Target Price 2 = 0.038
Target Price 3 = 0.10
There could be overperformance given how small the market cap and cost is, but XCN has all the ingredients to give traders some healthy returns.
XCNUSD trade ideas
XCN targets breakout above .02There are a confluence of indicators suggesting this pullback is reversing back to the upside.
I use the 30 minute chart to look for these indicators.
Double Bottom at the area of support from multi-month support trend line
There is a crossover of 50/200 M.A.'s
Stoch RSI reached oversold while price holds above the 200 M.A.
Higher High has been made and Higher Low is currently being tested.
Higher low looks to be forming within the FVG from the previous Higher High move.
I have big expectations from XCN within the next year. This is only the beginning.


ONYX🟩 Demand Zone & Institutional Order Flow (Bullet Format)
Demand Zone 1: $0.01984 – $0.02051
↳ Active accumulation zone with visible order flow support
Strong Support: $0.01859
↳ Critical price defense for sustaining bullish structure
Demand Zone 2: $0.01754 – $0.01294
↳ Long-term high-demand area with historical buy-side interest
Price is currently hovering above the first demand zone, signaling interest from buyers and a possible continuation toward higher resistance levels.
📌 Important Support and Resistance Levels (Bullet Format)
Support Levels:
S1: $0.02034 – Immediate micro-support
S2: $0.01800 – Strong support at Fib 38.2%, often acts as a base for bouncebacks
S3: $0.01500–$0.01600 – Deeper support range near Fib 23.6%, ideal for dip-buy strategies
Resistance Levels:
R1: $0.02245 – First key resistance at Fib 50%, a breakout zone to watch
R2: $0.02573 – Major trend resistance at Fib 61.8%, breakout here confirms bullish momentum
R3: $0.03061 – Fib 78.6% level, high-confidence upside target for May–June 2025

NC HAMMER CRYPTOOn my videos posted on another platform that starts with a Y. You can see once it breaks the wedge it typically has a bullish outcome. Good luck and have fun with it.

XCNDon’t give up
I feel we are almost there we already had the first pump now i believe we are close to the grand finale .

XCN/USD Triangle Breakout – Bullish Momentum Loading!🟢 Trade Type: Long (Buy Setup)
Pair: XCN/USD (Onyxcoin vs US Dollar)
Current Price: $0.02007
Timeframe: 30-Minute Chart
🔍 Technical Setup
Pattern: Symmetrical triangle breakout (bullish bias confirmed)
Entry Point: Just after breakout (highlighted with a yellow circle)
Price Action: Clean breakout above triangle resistance + bullish candle close
Volume: Starting to rise – a good sign for momentum
🎯 Targets & SL
Take-Profit (TP):
TP1: $0.02088 (minor resistance)
TP2: $0.02202 (major resistance zone)
Stop-Loss (SL):
Below recent swing low support: $0.01935
⚖️ Risk-to-Reward (R:R)
Estimated R:R: Over 2:1, offering solid reward if breakout holds
Support Zone: Strong horizontal support at $0.01935 and rising trendline
🧠 Trade Logic
Breakout from consolidation triangle → continuation likely
Tight stop below structure → limited downside
Profit zones clearly defined with historical resistance

XCN Cup and Handle on the weekly Could this be the biggest cup and handle we’ve ever seen?
Pretty wild idea. But nothing is really impossible in crypto is it?
What do you think traders??

Elliott Impulse Wave Completion?If I were to ask someone to show me a chart of what an Elliott Impulse Wave looked like, it would probably look a lot like this. Just a little hope-ium for you SEED_DONKEYDAN_MARKET_CAP:XCN fanboys, and me too.

XCN Savvy?XCN is a speculative play, and in my opinion, speculative plays should never exceed more than 15% of your overall portfolio, as they can be very risky. That said, as far as speculative plays go, XCN is my top spec pick.
Good luck, and always use a stop-loss!

ONXYCOIN XCN may be in peril…..We know OXN now is in its 2nd break out from the .01771 position but it has broke support at .0214. In its retracement, we may potentially see a test of .01819 to even .01641 is it wants to find support from the existing 1st pump. Only time will tell.

Bullish outlook Can will probably be one of those ones this cycle.
Nice retest if price remains stable today I think we pump back to .04 in no time.

ITS A SIMPLE CHART AS YOU SEE..EASY MONEY !just wait to buy ...simple and easy to get some money :))

$XCN Spiked 70% Today Becoming the Only Top Performing AltcoinThe price of Onyxcoin ( SEED_DONKEYDAN_MARKET_CAP:XCN ) saw a noteworthy uptick in price today- surging nearly 80% amidst crypto market dip becoming the top performing altcoin today.
The price of Bitcoin ( CRYPTOCAP:BTC ) loses the $80k Support reverting to the $70k Zone, so as its compatriot Ethereum ( CRYPTOCAP:ETH ) dipping to the $1500 price zone.
As of the time of writing, SEED_DONKEYDAN_MARKET_CAP:XCN is up 35%. The 4-hour price chart depicts a bullish symmetrical triangle with the ceiling already broken prior the 70% surge.
The pattern is already in place, should a bullish momentum be exerted on the altcoin, we might see a 350% surge to recent highs before consolidation.
What Is Onyxcoin (XCN)?
Onyx is a web3 blockchain infrastructure that enables organizations to build better financial services from the ground up. Onyxcoin is the protocol’s governance and utility token which governs the network through the Ethereum blockchain.
Onyxcoin Price Live Data
The live Onyxcoin price today is $0.016685 USD with a 24-hour trading volume of $405,536,117 USD. Onyxcoin is up 61.70% in the last 24 hours. The current CoinMarketCap ranking is #95, with a live market cap of $543,817,218 USD. It has a circulating supply of 32,592,684,478 XCN coins and a max. supply of 48,402,437,326 XCN coins.

How ironic would this be.With a pause in the trade war.
I think alts to rip
And spot on 90 days if this would to play out.
Chart just for fun.
Not Financial advice.

$XCN - ONYXCOIN - Onyxcoin is about to decide whether it is going to dump or pump shortly...It is filling a cup and handle like formation but has hit a decisive point in its technical journey.
We will see.
** NOT FINANCIAL ADVICE **

xcn GOING DOWN!!typical low cap coinbase coin.. scam pumps.. then dumps 70-80% , accumulates for 2-3 months then scam pumps again..
0.01-0.014c buy zone
sell zone 10-15c.

XCN Daily CUP N' Handle Boom PossibleWe hit the green line from my previous chart of XCN. Now if it holds strong here. We should see a massive or massive multiple green candles incoming. Buy if you don't have any, buy more if you have already, buy more if it dips lower. I posted an example of a cup and handle in the middle of the chart. The handle we have is a bit steeper due to markets. Now the turn around incoming. First target 9 cents to 10 cents. Next .18 cents. Last .32 cents. Make sure to take profits. It will be a roller coaster ride.
DYOR... I could be wrong!

XCN beautiful 2000% gainWith XCN popping off and everyone now wanting a piece of the action. XCN is not finished. I entered XCn on the 3 vertical orange lines. Every entry and exit was more beautiful than the last first 125% then 230% or so then 2000%. We are now at $0.012 roughly and holding above the 200EMA
Forming a clear cup and handle, (if your new to the game check out DIMO, the cup and handle formed right before multiple major take offs)
Bitcoin is showing support, and we all know what happens when that happens. Now is a better entry than ever, we could se a bit lower but I doubt past $0.01
However looking at June 15th 2022 we see a major push down followed by an immediate rejection, this is still possible but overall I believe this will hit its ATH and more being $0.10, $0.18, $0.35, $0.50 potential
Not financial advice but if your kicking yourself for missing a very very easy 2000%
It’s not over.
Good luck and have fun with it
Not Financial Advice

Possible recover for XCN? 1Day Chart or will it go Lower?...XCN is releasing and updating its infrastructure but does it provide an answer for an existing issue or does it solve an existing problem? A simple question that may help... I've been reading and there will be a utility implementation from what I've seen and read on articles that are out there.

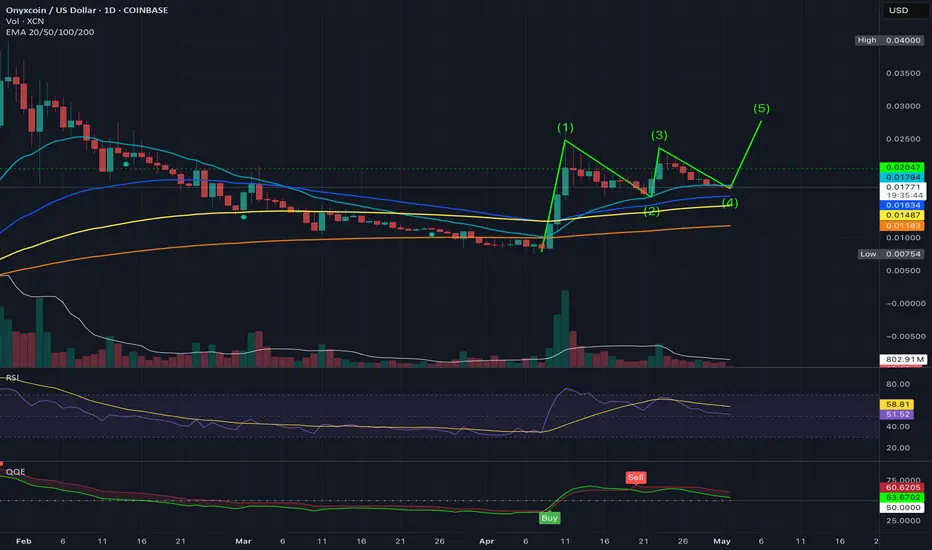
XCN has serious breakout potential on the 5th wave count.XCN went on a massive run over the past few months, followed by a significant decline along with the overall crypto market. The chart, however, is telling a story of what could become a massive move to the upside on the 5th wave of the wedge pattern's internal wave count.
I wouldn't count XCN out just yet. I think good things are coming to XCN in the future, even if the 5th wave ends up failing this time around.
Good luck, and always use a stop loss!

ONYX IS About to blow! The Daily BottomIf you sold or didn't sell now is the time to get in! This is the daily! A reversal is immanent! Everyone thought FEb was the Month! It's March!! So GET Ready!!
The bottom is in or the green line! It's not going to get any lower! So either buy now or at 1100 sotoshi!
