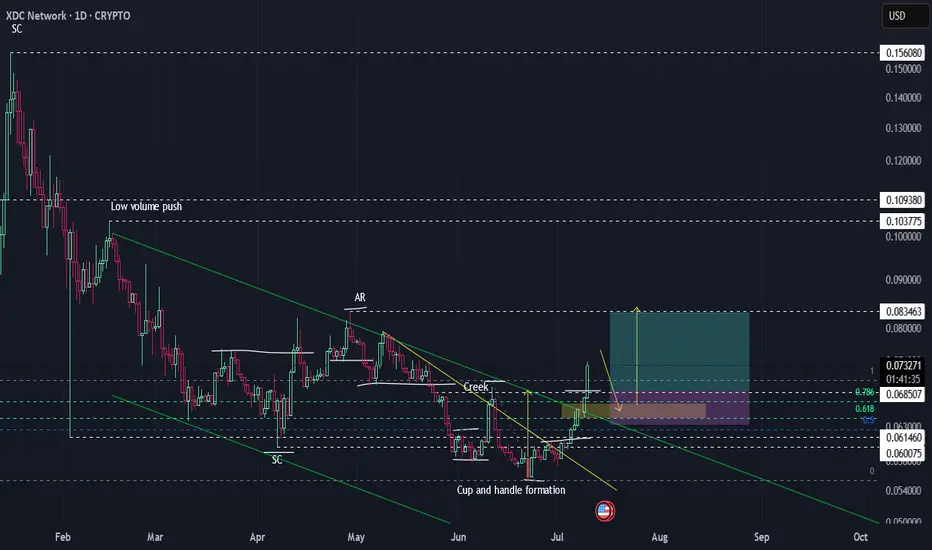
Wyckoff Accumulation + Cup & Handle | XDCUSD DailyClassic accumulation structure in play after months of channeling, with textbook Wyckoff signals: SC (Selling Climax), AR (Automatic Rally), and successful creek breakout. The current move shows a powerful expansion candle off a rounded “cup” base, with early FOMO buyers piling in.
DO NOT CHASE.
Bes
Key stats
About XDC
Related coins
XDC to $0.35 We have reached in between 50& and 61.8% retracement after breakout from triangle pattern. Looking for XDC to go to 141% price target.

XDC macro weekly cup handle. Your weekly XDC chart shows a classic setup with Fibonacci retracement levels drawn from the all-time high to the macro low, and several key technical observations:
🔍 Key Observations:
1. Current Price:
• XDC is at $0.0612, sitting just above the 0.236 Fib level at ~$0.0652.
• This is a historic

Long XDCUSD? YES!!!I like buying XDC in the $0.05 - $0.075 range. Feels like when you follow the $ and who is actually using the XDC Network its the US GOV.
I can see XDC in the near future being part of a larger platform network as more regulation roles out.
the Depository Trust & Clearing Corporation (DTCC) is d

XDCUSD - Break Above Prior ResistanceThis line has been seen as a prior resistance line but is now seen as support in the green circle
I believe that this is the beginning of a bull move for this coin, that there is more to come, which I have shown with the double curve.
Resistance turned support.
Daily timeframe

XRP vs XDC - What One Is Best To Invest In?I have been asked, is XRP a better investment or is XDC. For starters, if you have $1,000 to invest, you can sure own many more tokens of XDC than XRP, but does that matter in the end?
Current XRP Price: $2.81 $1,000 = 355 tokens
Current XDC Price: $0.09 $1,000 = 11,111 tokens
XRP Overview

XDC is showing a clear bearish divergence on the weekly RSI.XDC has been struggling for a long time, but like many cryptos, it benefited greatly from the 'Trump Pump' on election day. However, after a spectacular run, XDC is now showing a clear bearish divergence on the weekly RSI.
Could this spell disaster for the price of XDC? Only time will tell, but I w

XDC - long swing trade ideaLooking in at 0.1082 out at 0.1434, long swing trade. Expecting a dip from peak greed levels back to neutral to reset things as profit takers come-in before a "w" pattern forms.

XDC Leading the XXX Race.More Bullish on XRP XLM XDC more now then ever. Its like all the paid actors are in political alignment and the script needs to just turn to the next chapter for ultimate euphoria. Hang on tight! I believe we in for a moon shot before the 19th. Soon to be priced out of comfortable levels.

XDC breaking up from 3 different bull patterns at the same timeI had to use the weekly time frame instead of the daily to fit all 3 patterns in the frame here. As you can see we have a double bottom(green neckline), an inverse head and shoulders (tan neckline), and a pink bullflag that price action is currently breaking above each of. Their full measured move t

See all ideas
Summarizing what the indicators are suggesting.
Oscillators
Neutral
SellBuy
Strong sellStrong buy
Strong sellSellNeutralBuyStrong buy
Oscillators
Neutral
SellBuy
Strong sellStrong buy
Strong sellSellNeutralBuyStrong buy
Summary
Neutral
SellBuy
Strong sellStrong buy
Strong sellSellNeutralBuyStrong buy
Summary
Neutral
SellBuy
Strong sellStrong buy
Strong sellSellNeutralBuyStrong buy
Summary
Neutral
SellBuy
Strong sellStrong buy
Strong sellSellNeutralBuyStrong buy
Moving Averages
Neutral
SellBuy
Strong sellStrong buy
Strong sellSellNeutralBuyStrong buy
Moving Averages
Neutral
SellBuy
Strong sellStrong buy
Strong sellSellNeutralBuyStrong buy
Displays a symbol's price movements over previous years to identify recurring trends.
Frequently Asked Questions
The current price of XDC (XDC) is 0.09417000 USD — it has risen 3.58% in the past 24 hours. Try placing this info into the context by checking out what coins are also gaining and losing at the moment and seeing XDC price chart.
The current market capitalization of XDC (XDC) is 1.53 B USD. To see this number in a context check out our list of crypto coins ranked by their market caps or see crypto market cap charts.
XDC (XDC) trading volume in 24 hours is 51.62 M USD. See how often other coins are traded in this list.
XDC price has fallen by −4.08% over the last week, its month performance shows a 52.91% increase, and as for the last year, XDC has increased by 211.54%. See more dynamics on XDC price chart.
Keep track of coins' changes with our Crypto Coins Heatmap.
Keep track of coins' changes with our Crypto Coins Heatmap.
XDC (XDC) reached its highest price on Aug 21, 2021 — it amounted to 0.19499000 USD. Find more insights on the XDC price chart.
See the list of crypto gainers and choose what best fits your strategy.
See the list of crypto gainers and choose what best fits your strategy.
XDC (XDC) reached the lowest price of 0.00015720 USD on Jun 20, 2019. View more XDC dynamics on the price chart.
See the list of crypto losers to find unexpected opportunities.
See the list of crypto losers to find unexpected opportunities.
The current circulating supply of XDC (XDC) is 38.01 B USD. To get a wider picture you can check out our list of coins with the highest circulating supply, as well as the ones with the lowest number of tokens in circulation.
The safest choice when buying XDC is to go to a well-known crypto exchange. Some of the popular names are Binance, Coinbase, Kraken. But you'll have to find a reliable broker and create an account first. You can trade XDC right from TradingView charts — just choose a broker and connect to your account.
Crypto markets are famous for their volatility, so one should study all the available stats before adding crypto assets to their portfolio. Very often it's technical analysis that comes in handy. We prepared technical ratings for XDC (XDC): today its technical analysis shows the buy signal, and according to the 1 week rating XDC shows the buy signal. And you'd better dig deeper and study 1 month rating too — it's strong buy. Find inspiration in XDC trading ideas and keep track of what's moving crypto markets with our crypto news feed.
XDC (XDC) is just as reliable as any other crypto asset — this corner of the world market is highly volatile. Today, for instance, XDC is estimated as 7.56% volatile. The only thing it means is that you must prepare and examine all available information before making a decision. And if you're not sure about XDC, you can find more inspiration in our curated watchlists.
You can discuss XDC (XDC) with other users in our public chats, Minds or in the comments to Ideas.