XECUSDT trade ideas


$XEC next move UP BINANCE:XECUSDT
Green line at the bottom its a fundamental price
-0.18 and -0.27 levels by FIB is investments zones under fundamental price which we should test around summer 2022
Locally im expect move up to 0.68 level by FIB correction and than drop to the bottom after FRS increasing rates and cut balance events this year.
So dont fall in FOMO

Quik XEC Analysis in 15 minutesif we still bullish on bitcoin, we will see XEC touch agin the solid geometric line of 2900 to coordinate the mass mouvement of previous waves.

XECUSDT Bullish signalECASH / XECUSDT is trading inside a Channel Down in the past 18 months.
The price just crossed over the Falling Resistance, that when broken on prior bearish legs, it started a huge parabolic rally.
Buy and target 0.00003950.
Follow us, like the idea and leave a comment below!!

XECUSDT Trade Signal Timeframe: 1H XECUSDT Trade Signal Timeframe: 1H
#Crypto #Cryptomarket #CryptoSignal #Forex #XECUSDT #TechnicalAnalysis #TradingOpportunity #Divergence #TradingSignal #TradingwithBelieve #NASDAQ #USTECH
Hey traders! 👋 Let's dive into a potential trading opportunity on the XECUSDT pair using technical analysis. 📊
📉 Previously Bullish Trend:
Firstly, on the 1H- timeframe, we've been witnessing a Bearish trend in the XECUSDT pair. 🐻
🔄 NO Divergence on HH (Higher High):
However, it's crucial to note that recently, we have started to observe a no divergence pattern on the HH (Higher High’s). This is an important signal that the Bearish momentum might be weakening. 📉🔄
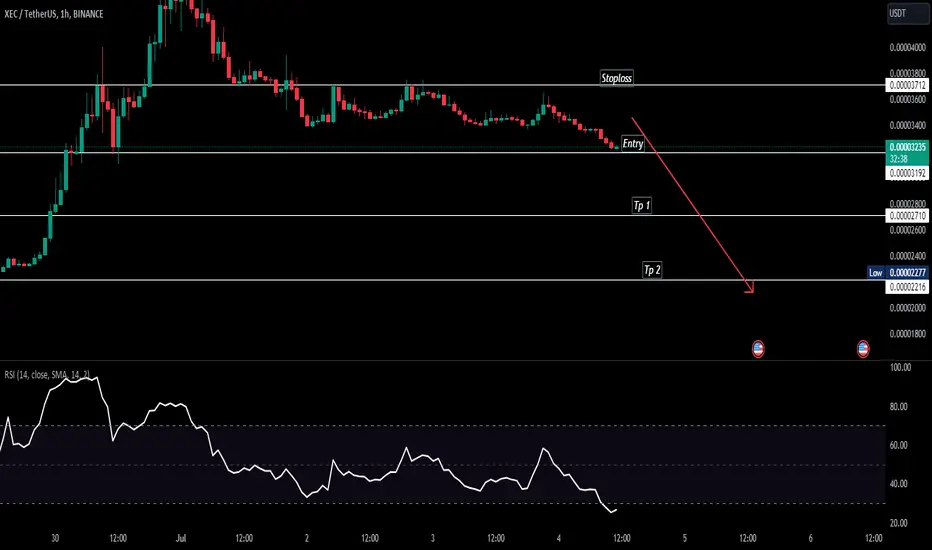
📊 Trade Opportunity:
Currently, we are looking at a potential trade opportunity with a Bullish bias.
📈 Entry Price: 0.000002778
🎯 Stop Loss Level: 0.000002644
🚀TP1: 0.000002893
💰 Investment Advice:
Please remember that trading carries risks, and it's essential to have a well-defined trading plan, proper risk management, and stop-loss orders in place. This analysis is for educational and informational purposes only and should not be considered as financial advice. Make sure to do your research and consider your risk tolerance before entering any trade.
Happy trading, and may the pips be in your favour! 🚀📈💰 #HappyTrading #ProfitOpportunity #TradeSmart #CryptoSignal #StockSignal #TradingwithBelieve

XEC ANALYSIS (1D)XEC has been bullish for a few days now. Examining the waves, I realized that this symbol is inside a large symmetrical pattern located on the I branch. We are looking for sell/short positions in the red box
I specified the invalidation level, closing 1 daily candle above this level will violate the analysis.
To complete the large and time-consuming symmetrical branch I, we expect it to move from the red box to the two announced targets.
For risk management, please don't forget stop loss and capital management
When we reach the first target, save some profit and then change the stop to entry
Comment if you have any questions
Thank You

xecusdt-mentoringxecusdt- unknown asset for me but it doesnt makes it less scm-border unnecessary coin.
it doesnt matter- if liquidity there and possibale to chart levels,
it defenatly possibale to make money
on the weekly TF the asset trading at the lowest support
and touches it for the 4th time, but last low is higher than previous one
and it made ( kinda) spinning bottom candle - so more confident in swing long atleast to 4185
look for long if price retraces from 2200
look for short if rejects from 2545
look for long if closes above 2639
look for short if close under 2151
***
Tolerance will reach such a level that intelligent people will be banned from thinking so as not to offend the imbeciles- F.M.dostoyevsky


#XEC March 2024 Halving - Long - Potential 91.16%Direction: Long
Market: Spot
Risk: 0.25% - 1%
#USDT_XEC
Exchange: BINANCE
Timeframe: 3D
TP1: 5450
Entry: 2851
STOP: 1587
If you are looking for emerging opportunities during what looks like an upcoming correction in crypto then XEC might be a sleeper hit for the latter part of the year. XEC has a fixed supply of 21 trillion (linked to the satoshi cap) and like BTC has a halving scheduled for March 2024 when its inflation rate will fall dramatically from 1.73% to 0.83% which should have a significant impact on price (especially in a frothy market around the upcoming BTC halving).
Its currently trading at the top of its formation (a bullish falling wedge) so DCA'ing into this position early might be smart with small incremental buys possible down to the lower trendline or you could wait to buy the confirmed break of the upper trendline. I'm not yet decide how I'll enter so let me know your thoughts DCA now with conviction or sacrifice some profit later for more conviction with a confirmed breakout with volume?


Possible 75% rise for XECXec is forming a falling wedge and also we have a bullish cross in MACD.
A continuous pattern, but we will buy only and ONLY after the price break the resistance.
Have a nice trade

#XEC/USDT - Long - Potential 5.70%Direction: Long
Market: Spot
Risk: 0.25% - 1%
#USDT_XEC
Exchange: BINANCE
Timeframe: 360
TP1: 0.00003265
Entry: 0.00003091
STOP: 0.00002917
Entry Conditions:
| Breakout from downtrend
| Break of EMA 50 & 20
| RVOI resistance break

XEC Scalp LongWe notice the downward trend line
And we touched the liquidation area
I expect strong liquidity to enter the market and break the downside trend
I apologize that my english is not good
Good luck everyone
target
0.000036$
0.000039$
stop lose
0.000029$
Did you like my analysis? Leave a comment, like, and follow to get more

$XEC potential 80% up moveHey bros, hows summer going?
Currently tracking wave 4 bullish triangle for this coin.
Entering on the breakout of the triangle is ideal.
Please use proper risk and money management, and dont forget to follow my account for daily elliott wave updates on crypto/fx/commodities!
Good luck!

XECUSDT XECUSDT was trading in symmetrical triangle and then break through the triangle. Currently the price is retesting the broken levels of triangle and inclining trendline.

XEC 50 %+XEC possible move up 50 %+
I think the first goal will be achieved very quickly, probably today-tomorrow


XECUSDTXECUSDT IS in range mode if it breaks downward direction then trend is going to continue as bearish.
we wait and watch for the breakout of last ll.
good buy the trend is bullish and the demand zone is stophunt
i see it very late but we can get it in 2tb

XEC pump n dump- 20:1
- It's volatile don't put too much money in the leveraged account.
- Good luck

XEC/USDT - eCash: Resistance_Breakout◳◱ A Resistance Breakout has been identified on the TSX:XEC / CRYPTOCAP:USDT chart. The price has broken above a key resistance level, indicating a potential bullish trend. The next resistance key levels are located at 0.00002747 | 0.00003092 | 0.0000383, and the major support zones can be found at 0.00002009 | 0.00001616 | 0.00000878. Consider entering at the current price zone of 0.00003256 and targeting higher levels.
◰◲ General info :
▣ Name: eCash
▣ Rank: 70
▣ Exchanges: Binance, Kucoin, Huobipro, Gateio, Poloniex, Mexc
▣ Category/Sector: Payments - Currencies
▣ Overview: eCash is a rebrand of BCHA, the Bitcoin ABC iterated Bitcoin Cash. eCash has taken steps to stay abreast of changing industry standards shifting away from PoW to PoS. eCash maintains contiguity with BCHA blockchain architechture. The rebrand from BCHA to eCash is mainly semantic.
◰◲ Technical Metrics :
▣ Mrkt Price: 0.00003256 ₮
▣ 24HVol: 18,617,351.025 ₮
▣ 24H Chng: 44.262%
▣ 7-Days Chng: 27.83%
▣ 1-Month Chng: 27.93%
▣ 3-Months Chng: -0.77%
◲◰ Pivot Points - Levels :
◥ Resistance: 0.00002747 | 0.00003092 | 0.0000383
◢ Support: 0.00002009 | 0.00001616 | 0.00000878
◱◳ Indicators recommendation :
▣ Oscillators: NEUTRAL
▣ Moving Averages: STRONG_BUY
◰◲ Technical Indicators Summary : BUY
◲◰ Sharpe Ratios :
▣ Last 30D: -0.84
▣ Last 90D: -2.11
▣ Last 1-Y: -0.43
▣ Last 3-Y: -2.64
◲◰ Volatility :
▣ Last 30D: 0.80
▣ Last 90D: 0.57
▣ Last 1-Y: 0.77
▣ Last 3-Y: 3.33
◳◰ Market Sentiment Index :
▣ News sentiment score is N/A
▣ Twitter sentiment score is 0.45 - Bearish
▣ Reddit sentiment score is 0.30 - Bearish
▣ In-depth XECUSDT technical analysis on Tradingview TA page
▣ What do you think of this analysis? Share your insights and let's discuss in the comments below. Your like, follow and support would be greatly appreciated!
◲ Disclaimer
Please note that the information and publications provided are for informational purposes only and should not be construed as financial, investment, trading, or any other type of advice or recommendation. We encourage you to conduct your own research and consult with a qualified professional before making any financial decisions. The use of the information provided is solely at your own risk.
▣ Welcome to the home of charting big: TradingView
Benefit from a ton of financial analysis features, instruments and data. Have a look around, and if you do choose to go with an upgraded plan, you'll get up to $30.
Discover it here - affiliate link -
