Price action confirmationA good buying position is indicated by the base candle moving above the jaw line
And now it has gone through 88% to correct the price
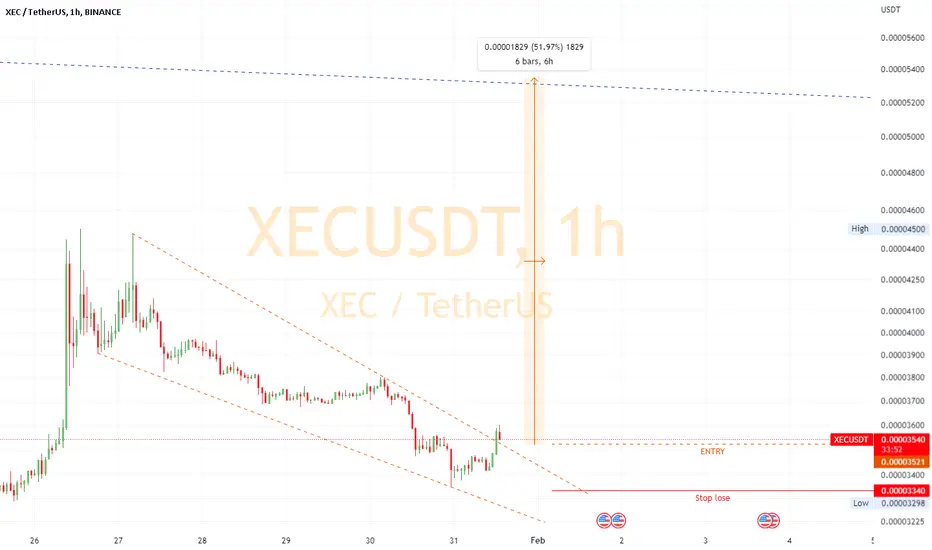
XECUSDT trade ideas

XECUSDT long ideaBitcoin is currently under resistance, but there is a high potential to break the trend line and turn it into an upward movement. Do not forget that entering any position requires confirmation.
⚠️ "Daily crypto market analyses I provide are personal opinions & not financial advice. Trading carries risks, so do your own research & seek advisor's help."

XECUSDT.1DHello dear friends,
*Mars Signals Team wishes you high profits*
This is a one-day-time frame analysis for XECUSDT.1D
The price is currently fluctuating and being tested at our first support line. If the price fails to penetrate above the line and consolidate and we see weakness in the trend, it can move towards our second support line. But if it can penetrate and stabilize above our first resistance line, it can move towards our second resistance line.
Warning: This is just a suggestion and we do not guarantee profits. We advise you to analyze the chart before opening any positions.
Take care

xecusdtBased on the analysis, I see such a move for Ripple unless there is good news in the financial markets
It is just a personal opinion and is not a buy or sell signal

#XEC #eCash will going higherToday XEC has been breakout the symmetrical triangle trendlines.
Entry: 0.000032
Stoploss: 0.000029
Target 1: 0.000038
Target 2: 0.000044

XEC ready to grow with 200% profit targetDon't miss your chance to buy XEC at 2900 for a strong bullish wave to 4900 area. Good luck and success. Set the alarm bell when the price reaches the point of purchase and notify us

Positive divergence in the indicatorPositive divergence in the indicator
If the price comes with my zone
it is a buy position


Xec Testing Crucial Resistance Seems Like Xec Bottomd Out & testing Crucial Resistance In Htfs
Incase Of breakout expecting 200 to 220% bulish move

XEC Wait For BuyXec need complete 5 waves in c in abc correction and now after finished wave 4(5) move down to 5 then we enter buy position in green fibo zone wave 5 to tp1 and trail tp2 tp3

snrc1 scenario.00002970 fibo
This is about price reaction but I am bullish on possible Fibo resistance
This has 2 reasons to buy


XECUSD Approaching the 1W MA50 for the first time in historyEcash (XECUSD) broke today above the 1D MA200 (orange trend-line) for the first time since October 08 2022 and is about to hit the 1W MA50 (red trend-line) for the first time in its history!
This is a major Resistance cluster and with the 1D MACD in similar extremely overbought levels as the April 02 High, we expect a pull-back and retest of the 1D MA200 as a support, in similar manner as the 1D MA50 (blue trend-line) was tested on January 17.
You see how well the Fibonacci Channel extensions fit the price action of XEC and as a result our next target is on the 2.5 Fib at 0.000059.
-------------------------------------------------------------------------------
** Please LIKE 👍, FOLLOW ✅, SHARE 🙌 and COMMENT ✍ if you enjoy this idea! Also share your ideas and charts in the comments section below! **
-------------------------------------------------------------------------------
💸💸💸💸💸💸
👇 👇 👇 👇 👇 👇

XECIdea: The price tried to break through the daily 300 MA, but bounced back to the 200 EMA. The indicated MAs are strong support and resistance levels. The price needs to consolidate above the POC level to continue the uptrend. The price is in the strong overbought zone

XEC eCash Coin Price PredictionXEC eCash Coin is hitting a daily resistance along with downward slopping trendline. We might see a sell-off on this coin so be very very careful.


eCash (XEC) Price Reversal !!
hey traders,
good morning/evening
according to the waves count here probably a price reversal is due soon against the invalidation level.
good luck

XECUSDTRisk warning, disclaimer: the above is a personal market judgment based on published information and historical chart data on Tradingview, all analysis is only subjective. Hope investors consider, that I am not responsible for your investment decision.
Thank you.
Good luck

XEC TO THE MOONas you see XEC is in the end the triangle 📐
Everytime this happens we see a huge movement from this coin 🪙
This is not a financial advise,lol 😂
Last night's FOMC minutes was a green light for next bull 🐂
Let's see what will happen

Important support level!XEC has been on a steep downtrend over the past few weeks. The price of this currency was hovering over a very important support level, which was broken by the selling pressure that formed throughout the market. But the lower support that was considered in the range of $0.0000255 to $0.0000280 has been met with a positive reaction. This area, which was drawn exactly at the previous floor and within the specified range, can be an area for a possible reversal of the trend and change of direction in the above time frames.
Of course, if the resistance of the ceiling of the descending channel is broken, as well as the static resistance of the powerful current. This item requires special support from buyers. Otherwise, if there is an increase in selling pressure in the market and the current support is broken, the price decline can continue to the next range, which is the price of $0.0000200. We can expect a range trend between the specified levels for this week and next week.

eCash (XEC) & Coming Bullish Wave
thanks for coming and viewing my chart....below is the explanation:
as normal price cycle >> 5 waves up then a deep correction (current) then usually always to follow with 5 waves up (future) again looking after a new ATH as shown in the chart
break under the historical level might invalid it.
Not FA n good luck

XEC : Day tradeXEC opens some volume on low time frame.
For this reason interesting to follow to see or it can confirm some trends.
