XECUSDT trade ideas

XEC ( Ecash ) Aggressive Opportunity - Daily ChartFor aggressive traders this may be the opportunity you are looking for
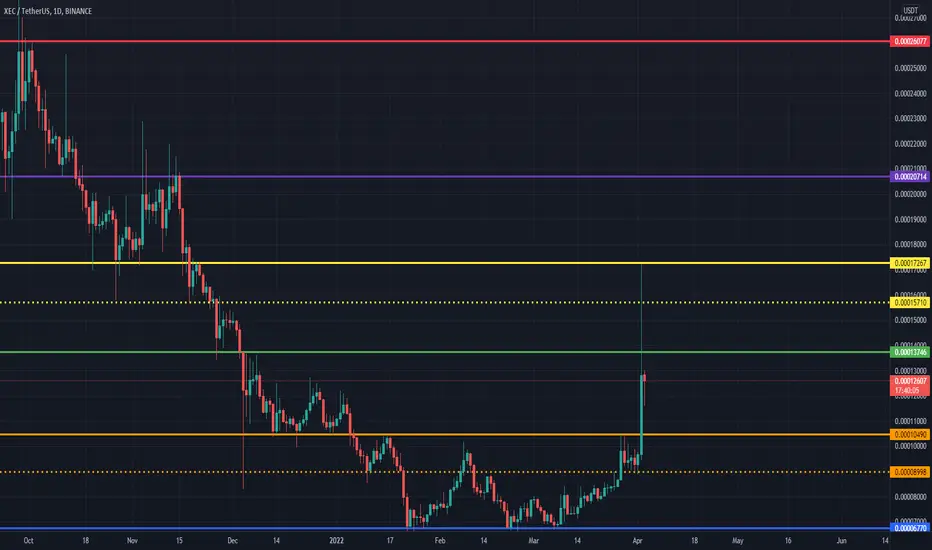
A potential double bottom is on the way to be build if the levels of 0.000065 is NOT violated.
A positive diversion is also completed on the RSI which indicated that the trend is about to change to LONG.
Target is up there on the previous structure resistance
Harmonic BLUE movements may lead to closing above the nick line of the double bottom and then, this confirm the idea of the double bottom and potential target
Happy Trading every One


XEC on the way to bullishXEC today seems good to buy.. The chart shows reversal and going up..
If XEC could hit 134 again, then Hold XEC for a long time..

Failed break outThis scam coin proof of stake and shit keeps having a failed break out and rekting people
Short with everything you got
Target is 0
Thanks and take care

XECUSDTHMm .. Lots of going crypto world cause of tax involvement. since XEC shares same mechanism as BTC i believe there lot potential in this . after long period of accumulation it has give impulse and retrace to fib level 618 .. let enjoy the ride

Break of bearish structure Wait until complete retest
....buy with tight SL...
AND be PATIENT for a GREAT GAIN..
Your comments would be helpful 🙏😍

XECUSDT (ECASH) Daily tf Range Updated till 3-4-22XECUSDT (ECASH) Daily timeframe range. there are not much of solid data behind this chart as its fairly new listed with very generic price action. that tells not much of retail interest like other alt's and that explain the slow bleeding till the lower zones. going down from listing number never a good rep. price #discovery messes things up. but hey there is a chance to retrace back for the distance from its top. as for its generic price action the chart is clean and lots of gap within range, how it will be respected depend on volume that will coming in and its holders.
XEC - RAIPAY IntegrationHello Traders
Buy now, XEC has is closing out its divergence and moving into a fresh new zone
Follow the Pitchfork Trend. Also there is Good News for the coin on below Link
e.cash/media/raipay-block-explorer-2-0-approved-by-ecashs-gnc
Target: By March 0.0002500
Like, Subscribe, leave comments and support by Donation of Coins, if you need me to keep doing my analysis on a Pro Account.
Support: tradingview.com/gopro/?share_your_love=Gunshot321
Regards


ECASH Showing interesting trends depending on TAHello trading friends,
Depending on the study of the TA trend it looks that ECASH ( XEC) looks interesting.
we will follow coming time the trend of it.
Have good day.
@ this is not a trading call - trade only depending on your setups


eCash XECUSDT - New bull market + Bullish rectangle!- eCash is turning bullish, right now the coin is breaking out of the bullish rectangle.
- On the daily chart we can spot a double bottom reversal pattern + trendline breakout.
- Profit target is previous all time high.
- The neckline is breaking out and volume favors bulls.


XEC morning star start to BULLISHAs we can see XEC very powerful morning star pattern in monthly
Start buying and keep monitoring
Mid-Long target 0.0005-0.001

$XEC Trade Idea With The Buy Zone & Possible Targets!!Hi Traders,
This is my analysis for XEC, Entry at the mentioned buy zone, or with a stop limit Order at 0.0...9
Targets are mentioned in the chart, and StopLoss after a Weekly Close Below 0.0...6
Good Luck.
NFA, DYOR. and Remember to calculate your risk according to the StopLoss % ...

XECUSDT Long 4hr TFBreak (above/below) will clear the direction of trend. But until now despite bearish divergences on oscillators it looks bullish, as usually the trend continues.
Entry, Take Profit and Loss levels are drawn on chart.
Do your own analysis before entring trade.


XEC Heading North !Hey traders,
usually after each impulsive wave it will be followed by a correction then after, most likely, followed by an impulsive wave. so most likely we might see a nice price rise from the recent levels targeting probably, as a minimum, the upper line near 0.0005+ $.
price going back down below the red line with two days close might weaken this idea.
good luck

eCash (XEC) - March 17Hello?
Traders, welcome.
If you "follow", you can always get new information quickly.
Please also click "Like".
Have a good day.
-------------------------------------
Support and resistance points are weak as the chart has been created shortly.
Therefore, please refer only to the flow level.
(XECUSDT 1W chart)
(1D chart)
Primary resistance section: 0.0001 0763 - 0.0001 1786
Secondary resistance section: around 0.0001 5800
It is more likely to move higher as it is breaking out of the downtrend line and consolidating.
We need to see if we can sustain the price above 0.0000 8300.
It must rise above 0.0001 0763 to turn into an uptrend.
------------------------------------------------------------ -----------------------------------------------------
** All indicators are lagging indicators.
Therefore, it is important to be aware that the indicator moves accordingly with the movement of price and volume.
However, for convenience, we are talking in reverse for the interpretation of the indicator.
** The MRHAB-O and MRHAB-B indicators used in the chart are indicators of our channel that have not been released yet.
(Since it was not disclosed, you can use this chart without any restrictions by sharing this chart and copying and pasting the indicators.)
** The wRSI_SR indicator is an indicator created by adding settings and options to the existing Stochastic RSI indicator.
Therefore, the interpretation is the same as the traditional Stochastic RSI indicator. (K, D line -> R, S line)
** The OBV indicator was re-created by applying a formula to the DepthHouse Trading indicator, an indicator disclosed by oh92. (Thanks for this.)
** Support or resistance is based on the closing price of the 1D chart.
** All descriptions are for reference only and do not guarantee a profit or loss in investment.
(Short-term Stop Loss can be said to be a point where profit and loss can be preserved or additional entry can be made through split trading. It is a short-term investment perspective.)
---------------------------------


bulls barely attempts to hold XEC coin above crucial support Ecash coin price has been consolidating above the essential support level of $0.000067 since late January.
Recently, buyers took the support of a half-line of the Bollinger bands indicator and bounced back.
Ecash coin price is trading above the 20-moving average, and today the bulls are trying to close the daily price candle above the 50-day moving average (blue) in the context of the daily price chart. In addition, the remaining moving averages (such as the 100 and 200 MA) are well above the current price.
Stoch RSI is suggesting an ascending triangle formation on the daily price chart. At that time, K is walking on 67-points and D is on 56-points. The indicator still remains above the if half line (50-point). Moreover, the Average Directional Index is at 19-level, which indicates a weak bullish trend for the eCash coin.
It remains to be seen whether the bulls manage to close the daily price candle above the 50-day EMA. Above the 50-MA, the eCash coin may show a sharp recovery as the 50-MA has been a bullish barrier for a long time.
Resistance level- $0.00010 and $0.00020
Support level- $0.000067 and $0.000014

