NEM/XEM Ready to Go w/ 400% Potential Mid Term (MED RISK)INDICATORS
MACCD levels look good on daily and weekly charts
RSI is decent
MMAR is very positive
Drop in price is still possible
INTELLIGENT PREDICTION
Short term (1-7 Days) - -10% - 40%
Medium term (1-3 Month) - 90% - 400%
Long term (5-12 Month) - 750% - 2,000%
MAKE SURE TO FOLLOW US TO RECEIVE UPDATES ON THIS TRADE
XEMBTC trade ideas

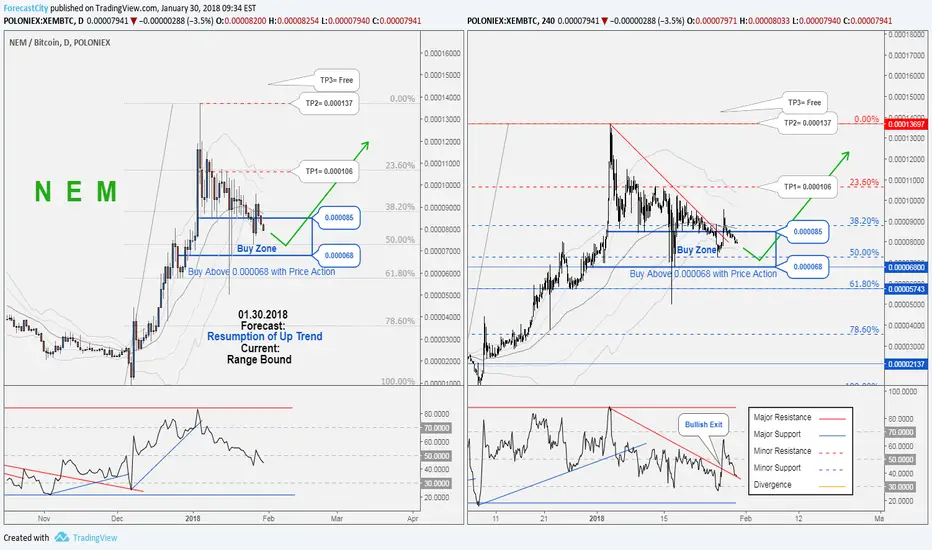
NEM is in the Range Bound and Resumption of Uptrend is expected.Technical analysis:
NEM, is in Range Bound and Resumption of Uptrend is expected.
The price is now below the 21-Day WEMA which acts as a dynamic resistance and prevents from more gains.
DAILY RSI is 45 and above a support level 46.
In H4-RSI , A Bullish exit is occurred which triggering more bullish momentum.
Trading suggestion:
Price is in the support zone (0.000085 to 0.000068), traders can set orders based on Price Action and expect to reach short-term targets.
Beginning of entry zone (0.000085)
Ending of entry zone (0.000068)
Entry signal:
Signal to enter the market occurs when the price comes to "Buy zone" then forms one of the reversal patterns, whether "Hammer" or "Trough", in other words,
NO entry signal when the price comes to the zone BUT after any of reversal patterns is formed in the zone.
To learn more about "Entry signal" and special version of our "Price Action" strategy FOLLOW our lessons:
(We have started to prepare these lessons in TradingView. If you want us to continue, give us feedbacks!)
Take Profits:
1. First target is at 0.0000619
2. Without target

NEM is in the Range Bound and Resumption of Uptrend is expected.Technical analysis:
NEM , is in the Range Bound and Resumption of Uptrend is expected.
The price is now below the 21-Day WEMA which acts as a dynamic resistance and prevents from more gains.
DAILY RSI is 44 and below a support level .
In H4-RSI , A Bullish exit is occurred which triggers more bullish momentum.
Trading suggestion:
Price is in the support zone (0.000085 to 0.000068), traders can set orders based on Price Action and expect to reach short-term targets.
Beginning of entry zone (0.000085)
Ending of entry zone (0.000068)
Entry signal:
Signal to enter the market occurs when the price comes to "Buy zone" then forms one of the reversal patterns, whether "Hammer" or "Trough", in other words,
NO entry signal when the price comes to the zone BUT after any of reversal patterns is formed in the zone.
To learn more about "Entry signal" and special version of our "Price Action" strategy FOLLOW our lessons:
(We have started to prepare these lessons in TradingView. If you want us to continue, give us feedbacks!)
Take Profits:
1. First target is at 0.0000619
2. Without target
NEMBTC ,A good opportunity for long trades in XEMBTCTrading suggestion:
There is possibility of temporary retracement to suggested support zone (0.000088 to 0.000072), if so, traders can set orders based on Daily-Trading-Opportunities (Price Action) and expect to reach short-term targets.
.Beginning of Buy zone (0.000088)
.Ending of Buy zone (0.000072)
Take Profit:
TP1= @ 0.000106
TP2= @ 0.000137
TP3= @ Free
Technical analysis:
.Price is above WEMA21, if price drops more, this line can act as dynamic support against more losses.
. Relative strength index ( RSI ) is 53.
.Current short-term is range bound, but beginning of uptrend is expected.

Long Trading Signal for NEMThe price bounced from the resistance zone formed by SMA100 and the downtrend line. The previous swing high can be used as a signal level. If price breaks it, we'll get a trend reversal signal and confirmation of further upward movement. MACD lines and DMI are bullish and support buying. Pending orders can be placed at 0.000093 level with stop orders at 0.000072 level. Profit targets are 0.000110 and 0.000135 resistance levels. If the price continues the downward movement and breaks the support levels, we will have to delete buy orders and wait for new trading opportunities.

Massive hack steals 523 million NEM! Huge downward pressure.cointelegraph.com
$534 million dollars worth of NEM stolen on Japanese exchange.
I predict a drop in NEM price into the purple buy zone 3877 - 5646 sat.
The hackers won't sell all at once. They will sell progressively.
With catapult just around the corner, we might see the bottom of the dip higher than 5646 sat.
It'll all be in the timing.


NEM (XEM) MOST PROBABLE SCENARIO ANALYSISHello everybody,
Due to the recent Coinchek hack NEM is going to have a really bad weekend I think... Even thought they have nothing to do with the hack per se. As you can see, Elliot Waves formed already, so I am guessing this could lead NEM to a downfal to the 68 FIB maybe even the 78 FIB It broke 200 period EMA, ther is Volume and RSI confirmation so for me it's settled... NEM is going around the 7k - 6k to finally reverse to new highs!!
If you agree or disagree please comment your opinion, thank you!!

$XEM - Finding its Bullrun lineBored at work so I thought I would slap this together.
XEMs performance is hinged directly with BTC at the moment. If BTC stays stable XEM will reflect stability also
Is XEM going to find its original bullrun trend?

XEM/BTC - Trade IdeaConsidering the current FUD in the cryptosphere and the necessary correction of NEM after a long bullish run, price is expected to bounce off the 7500 region as former resistance levels will turn to support.
In an event 7000 is broken then 6000 will be the next destination before take off.
WISH YOU LUCK!

XEM (NEM) BTC - 90% profit potential XEM completed 5 waves and ABCDE correction.
And we are in a symmetrical triangle.
What we are seeing now is a break-out or a fake-out?
It also could be more extended correction.
MACD and RSI are looking ok.
Volume is picking up.
We will be keeping an eye on it.
Good news: Huobi just listed XEM

XEM(NEM) - Trade opportunity Everything is explained in the chart. NEM is a strong coin with a good team behind it so i think it will be huge in the future.
^Remember to always have a stop loss ready.
Good luck trading!

XEM/BTC - Projected TargetsNEM is on my list to add to my position. I was waiting for a deeper retracement - price has met the daily trendline and the Bulls have taken over.
My projections are drawn on the chart.


The inner dialogue of a trader I don't know about you, but this has happened to me one time or another before I learnt a few things about trading.
1. This is a probability and NOT a certainty game. Whatever indicators used, are at best a guide and cannot be the holy grail (else wouldn't the creator be multi-millionaires by now?)
2. Patterns - While some said there is a preceding patterns to follow, I beg to differ. Each chart is different and must be treated at the present moment to trade, meaning past data is nothing but a guide. It may or may not happen. It is merely a tool used by "gurus" to predict the market, to drive up demand and more likely for a self-serving purpose. Read all news with a pinch of salt.
3. Emotional roller coaster - Most traders can make profits , even large profits in their trading career. The challenge is making profits, CONSISTENTLY. That is the name of the game. And I suspect it is the emotions that is hardest to control for most traders. There are just too much information, too much noises out there to disrupt one's thoughts, not forgetting the fear of missing out (better get in before it's too late or better sell before I lose more), the comparing with others and many biases that we carry in trading.
4. The Market - The market has always been NEUTRAL. It is us, the traders that give meaning to our own trades, thinking/saying it is bullish or bearish, buy or sell. The market has never spoken a single word from day one, think about it. The collective psychology of all traders would determine the price action. If there is more buy than sell, than price would goes up and if you are in the buy camp, you profit and vice versa. This imbalance creates an opportunity for those who knows how to spot it and has the patience as well. The market merely projects what it is on a daily, hourly, minutes basis to us. The decision to trade, to just sit on the fence or pawn your gold to buy or sell the assets is solely up to you.
In short, take responsibility for your own trade, be it a win or loss. It's is not the market that causes it to fail. It's also not the indicators you used. Worst, it's definitely not any of the authors here in TV, even the top ones that help make your extra zero in your bank account. IT IS YOU, always will, forever will be.
And this a hard truth that any trader can learn to accept it. When we lost money, we need to ease the pain, to outsource our emotional shipwreck to somebody - be it the market, indicator or a tip you heard elsewhere. It is hard to stomach all alone, I know , the blame game is easier and definitely make you feel a hell lot better. But better is the killer, it takes away the most important lesson of trading. To make mistakes, accept it and learn from it, taking 100% responsibility for it. That to me is the gem, a value that the market presents to me daily.
All that you behold, it seems without
It is within your own imagination
Of which this world of mortality
is but a shadow - William Blake

Bullish Flag on XEMBTCI think we can clearly see bullish flag on XEMBTC. I see now two courses of action - 1. go short with target on the lower bound of flag 2. long from the lower bound. If you decide for the 1st option, be careful about upside breakouts.


XEM BTC LongPotentially expecting soon $5 ! and end of 2018 $100?
I am not giving any buying or selling ideas. Please trade at your own risk.

NEM BreakoutHello everyone,
Hope you're not totally fucking dead from the overall bleed recently. It's not expected to continue much longer. Anyways,
NEM looking nice right now. It has one of the longest historic support lines I've ever seen on a coin and the recent fucking hasn't hurt it. The downward ceiling on the wedge isn't as strong leading me to believe it'll break upward once the market cap stops falling (it should bounce off of support soon). See my chart for details - target buy in is right around now.
Thanks for reading!
I take tips! If you'd like to donate a small amount for reading my chart and TA I'd greatly appreciate it.
Litecoin: LcAeke9vi5vRapWYtqqqNKJdHBj7JrBVit
Ether: 0x9e90C8FC1De9388B8B25bB2f6cdB57a078609626
Bitcoin Cash: 1GEi9pEs96kQAodGYeFTqD3xZJhLoviS9h
Bitcoin: 16vPk7wGME3oqNoav6J599a6cHtyZsbLAx
Any help is greatly appreicated - I'm trying to trade the same as all of you.


Celebrating 1st August 2017 anniversaryThe coming down to the 618 FIB level coincides with the peak of 1st August 2017. I am expecting a rebound from here.

XEMBTC -Seamless interfaceFinancial services companies can use NEM for instant payments and transfers anywhere in the world. One of NEM’s key advantages is its ability to seamlessly interface between public and private blockchains. This means you can transfer currency, tokens, or files from your internal company network, through the public blockchain, and into another company’s network.
I think this is a good coin to speculate on. It's still well priced in the market place and we could see a higher price over the next few months.
The targets are my personal opinion.
