NEM Buy OpportunityThe price bounces from 0.00009000 support level. RSI confirms price reversal and MACD supports possible upward movement. DMI allows opening long positions. Pending orders for buy can be placed above the high of the previous bullish candle. It’s 0.00010500 level. Stop orders can be placed at 0.00008550 level. The profit target for short term trading is 0.00013500 resistance level. The profit target for long term trading can be 0.00018000 level.
XEMBTC trade ideas

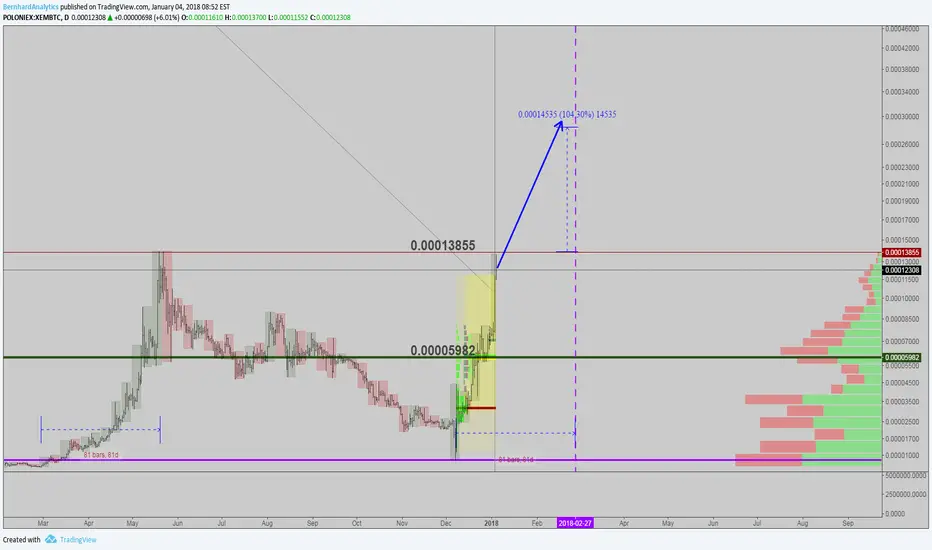
Yyuuuge steaming cup of NEM anyone..? Looks like a massive cup and handle formed on the daily chart for XEM/BTC. The trend didn't follow the bottom of the cup exactly, but that is not required for a cup and handle formation. Right now looks like a falling wedge or bullish flag on the handle and we could see a definite breakout upwards toward the rim of the cup if it follows the trend line. If we follow the trend line and break above the rim, next target is the depth of the cup inverted, around 23k sats. It could also start a new trend line after breakout above cup. This analysis is mostly for my personal use to follow and see how this goes. I may join this trade when I see definite upward movement. We are hitting the trend line now so I am keeping an eye on it. Comments and thoughts are welcome, thanks. Good luck and be safe out there! Let's ROLL!

NEM or XEM/BTC; 60% profit potential with a low risk! (Repost)Risk: Low
Please be advised that this is only an idea, so you are responsible for any losses yourself.
Dear followers,
New Economy Movement bounced its 20ma and we need a close above the support line. If we break resistance, New Economy Movement is ready for its next move. A close below support will mean a weakening of the uptrend and our only near support is the 20ma then. That's why we use a SL here.
Buy: Now (Partially) or after breaking resistance.
SL: below 20ma
Targets:
Target 1: 0.00011022
Target 2: 0.00013435
Target 3: 0.00015700
Good luck!
Please, follow and like for more trading ideas, this helps me to provide you with even better charts.
Questions? Feel free to ask and your feedback is welcome!


XEM/BTC - Top 7 market capNEM is well priced and I am banking on this coin appreciating.
Price may come back to the 50% retracement level before moving higher.
I can't buy it here - no man's land. Price will need to break resistance and retest it or move lower and react.
The profit potential is healthy.

NEM (XEM) is preparing for another legNEM (XEM) is in the phase of consolidation.
Triangle is forming and it should be broken in the following of days.
The first target is 13000 sat.
The second target 1600 sat.

New Trying To Go UpNem had double support, it is waiting for the volume. I bought it in the level of 0.000105, think to sell with min %40 profit.

NEM breaking out of the triangleFor the past few days the volatility of NEM has been decreasing. I think that we can see a triangle-pattern on the chart. This could be a signal for a long trade.
BUY:
~10500 as 0.5 level of Fibo
~9700 as 0.382 level of Fibo (less likely)
TARGETS:
~13500 as last high
~18000 (long term) as 1.618 Fibo

XEM/BTC - Outlook for the next weekLet's see if NEM can break upwards out of the orange triangle. If not then there's no drama as long as the price action keeps moving within the big blue uptrend channel.


Buying time for XEM / NEMPerfect time for long. RSI is still oversold and MACD pointing for a trend reversal. Take profit on or before the resistance zone at 12,000 Sats. Potential profit up to around 20%.Good luck!

XEM Update after Gained 870 %At first, i hope there is a person gained some profit from our last analysis for XEM
XEM show bounceing from major resistance at 0.00013501
we will set new buy limits for the next movement
our buy zone 0.00007741/0.00006350
Targets
(1)0.00010501
(2)0.00013501
(3)0.00016549
(4)0.00020881
(5)0.00025908
-Stop-loss
0.00005533
-Risk/Reward
22% / 260%
Set your own risk.
Capital management is recommended.
we ask Allah reconcile and repay.
-Previous analysis.

NEM XEM still full of Energy (Updated Chart) (2x-4x Potential)If you're a member, you had access to early charts a few weeks back so you got in early!
Everyone else, we still have great potential to grow here - as usually these charts are self explanatory

XEMBTC - Looks like a breakout is coming to the upsideLooks like a breakout is coming to the upside. In around 0.00010600, setting a stop-limit at 0.00009600 (take profit before the 0.00013500 mark to be safe). This is just an idea (I am not a professional and no one should blindly take advice), everyone should be doing their own analysis and make their own decisions. This is my first time publishing an idea, let me know your thoughts and comments, I am always looking to better my analysis and will try to provide the best ideas I can. Thank you.

it's going up fast, there will be more space for uptrend. it's going up fast, there will be more space for uptrend.

NEMFew minutes left before we close the registration of app ideas for this year's NEM Global Hackathon! Hurry up!
We got a total of 139 entries as of the moment! Good luck everyone!
hackathon.nem.io
The submission for app ideas for this year's NEM Global Hackathon has officially ended on January 1, 2018 at 17H00 (GMT+8).
We got a total of 143 entries! All qualifiers to the 4-week hackathon proper will be notified via email on or before January 7, 2018. Good luck!

XEMBTC Market ReviewA daily summary of the previous day’s market activity and review of current state of market on Cryptos.
Analysis
Daily Time Frame read
On the daily TF after the price breached the green ray we are in overall buyer’s territory and holding above we got some pullback to buy to the nearest S & R (Orange Ray) and buyers gobbled up the discount. We have a entry at the orange ray and market started moving up. We have breached the red ray and I can see some wicks on top showing some selling pressure, apart from the selling pressure buyers made a High on the daily candle, at that time I anticipated some sellers coming up back to the orange ray to make further buying but it didn’t happen. We have to wait for the pullback and then prepare for buy. This can be a few days time taking trade. As of now no entry on the daily as I don’t see any room to buy because there are few hurdles (Resistance) I could see to do a buy.
240H Time Frame read
On the 240H after price breached the orange line we got some selling coming in and buyers gobbled up and then broke the resistance the red line and stood above. The last seller is taken out by the buyer but the power seems less. Sellers came in one candle and buyers came up with 3 candles and the 4th candle with a wick on the top. This could be a stop hunter as I can see a resistance on the weekly. I anticipate some pullback to do a buy If not there is no trade from me because we should not chase the market.
Entries, Exits
No entry for me unless I see some pullback coming in to the orange ray.
Aggressive Entries and Stop loss
If you are quite aggressive in nature and don’t want to lose few Sats then you can enter the trade once the price come down to red line and leaves a big wick on the bottom. SL below the wick.
Conservative Entries
If you are conservative in nature then you can enter the trade once we get pullback to the orange line and then leaves a wick at the bottom, come up aggressively and then holds there for a bit and then making a miniature HH then you can enter the trade and SL below the wick or Orange ray.
If price don’t come until there leave the trade let it go off, why buying so high. We need pullbacks to buy.
Risk Management
• If you are an aggressive trader you can risk 2% of your capital on this trade.
Tight SL below Red ray. Position Size should be calculated based on 2% of the capital/SL by Sats.
RR should be at least 1:2; I am not specifying any targets as of now because the entry is speculative atm.
HODL overnight not more than that because BTC market is speculative atm.
• If you are a Conservative trader you can risk 1% of your capital on this trade.
Wider SL below the wick under Orange Ray.
Position Size should be calculated based on 1% of the capital/SL by Sats.
RR should be at least 1:2;

NEM to push all time high.I think NEM will be moving to test it's all time high. A clear tea cup formation and positive upward momentum from RSI, Positive MACD Cross, and holding above 50, 100, and 200 SMA.

XEM/NEM 1000% profitCan NEM make 10x? Of course, I often notice such cycles on the different cryptocharts. For example, Bitcoin/USD(highs ~320$,~1100$,~8000$), . The same situation . And such patterns are forming on many charts STRAT/BTC , WAVES/BTC , STR/BTC , ETH/BTC.We can say that it is bearish market comparing to BTC , so bullish market must me soon. I advise you to check these 7d charts .There is big chance that after long dominance of BTC , altcoins will recover , and we cant miss this surge .

XEM/BTCXEM is following the support and the resistance of the channel well. IF I were a betting man I'd say we were going to see 10k+ soon. IF it falls out of channel proceed with caution.

XEMBTC bullish scenario$XEMBTC remains over uptrend line.
10k Satoshi mark possible if we cross 8k again. Watch volume in blue channel.

NEM BULLISH TREND!In this analysis there is an uptrend seen. If the trend breaks the trend, you can be sure that it will hit the new target. You can set a stop loss, in case the breakout is a false breakout.
