XEMBTC trade ideas


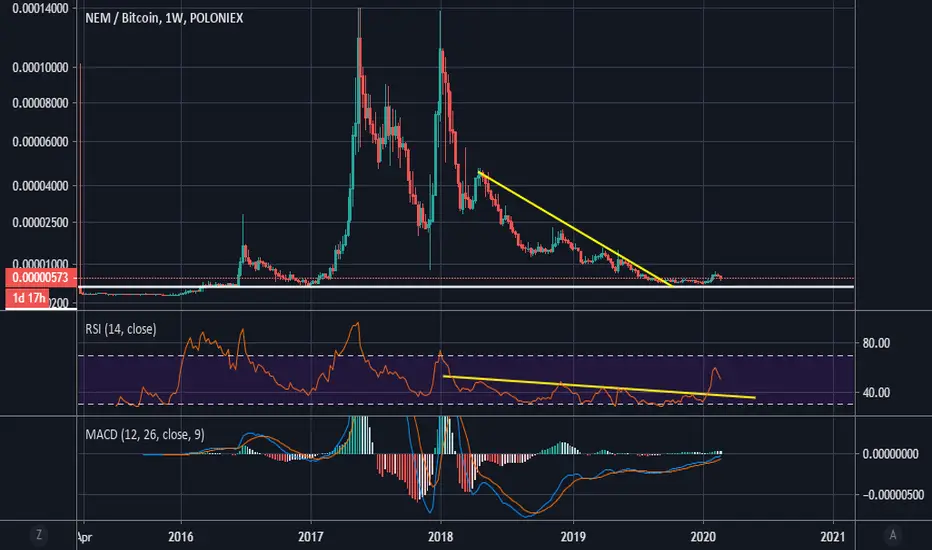
XEM/BTC. Retesting of the global accumulation range1. Global bottom.
2. Easy-to-identify accumulation phase and the retest.
3. Minimal risks.
4. R/R ratio is very nice.
5. The same is valid for XEM/USD.
Generally the project is doing well. There will be good fundamentals soon, so, buy the rumor, sell the news.
I'm holding some XEMs from 400-450 sat range, but it's just the beginning. The patience is the only way to the triumph.
Disclaimer!
Not a financial advice. You must do your own research and use it as the priority. Trading is risky, so trade responsible.
P.S. Some thoughts about the dominance.

There is a trading opportunity to buy in NEMBTCTechnical analysis:
. NEM/BITCOIN is in a range bound and the beginning of uptrend is expected.
.The price is above the 21-Day WEMA which acts as a dynamic support.
. The RSI is at 43.
Trading suggestion:
. There is a possibility of temporary retracement to suggested support zone (0.0000054 to 0.0000038). if so, traders can set orders based on Price Action and expect to reach short-term targets.
Beginning of entry zone (0.0000054)
Ending of entry zone (0.0000038)
Entry signal:
Signal to enter the market occurs when the price comes to " Buy zone " then forms one of the reversal patterns, whether " Bullish Engulfing ", " Hammer " or " Valley " in other words, NO entry signal when the price comes to the zone BUT after any of reversal patterns is formed in the zone. To learn more about " Entry signal " and the special version of our " Price Action " strategy FOLLOW our lessons :
Take Profits:
TP1= @ 0.0000073
TP2= @ 0.0000100
TP3= @ 0.0000135
TP4= @ 0.0000217
TP5= @ 0.0000294
TP6= @ 0.0000451
TP7= @ 0.0000579
TP8= Free

There is a trading opportunity to buy in NEMBTCTechnical analysis:
. NEM/BITCOIN is in a range bound and the beginning of uptrend is expected.
.The price is above the 21-Day WEMA which acts as a dynamic support.
. The RSI is at 55.
Trading suggestion:
. There is a possibility of temporary retracement to suggested support zone (0.0000054 to 0.0000038). if so, traders can set orders based on Price Action and expect to reach short-term targets.
Beginning of entry zone (0.0000054)
Ending of entry zone (0.0000038)
Entry signal:
Signal to enter the market occurs when the price comes to " Buy zone " then forms one of the reversal patterns, whether " Bullish Engulfing ", " Hammer " or " Valley " in other words, NO entry signal when the price comes to the zone BUT after any of reversal patterns is formed in the zone. To learn more about " Entry signal " and the special version of our " Price Action " strategy FOLLOW our lessons :
Take Profits:
TP1= @ 0.0000073
TP2= @ 0.0000100
TP3= @ 0.0000135
TP4= @ 0.0000217
TP5= @ 0.0000294
TP6= @ 0.0000451
TP7= @ 0.0000579
TP8= Free


Xem before catapultWe are waiting for good news from nem. I`m long since 0.00000455. TP1=590. TP2= 690. TP3=990

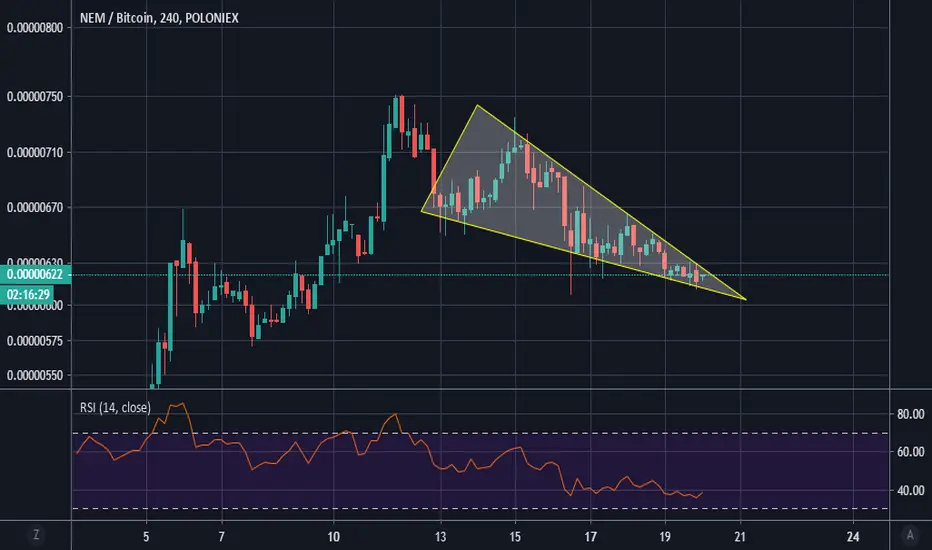
NEM triangle detectedRecently we saw isns which did not work. Now apparently it's a giant triangle. You decide what position to take long or short.


XEM chop triangle in full motionXEM should be bought at horizontal or if the price breaks trough the diagonal.
So far it is not worth holding a position in it, yet.
Be patient and trade the triangle.

XEM BTC longWe have a strong setup to go long on a bounce. Trade with care as any movement with BTC will follow with a seel of XEM.
Buying this bounce with a tight stop loss may give you a massive R/R
Trade this as a short time trade. If you are HODL'er it is a time to get some XEM into your portfolio.

XEMBTC bottoming out after very long bear marketXEMBTC is bottoming out after a very long bear market
RSI and MACD are making higher lows, but price is not following which means a bullish scenario
Expect a breakout with volume and a retest with a higher low which forms an inverse head and shoulders
TP1 1050
TP2 1300
TP3 2000

Potential bounce @0.00000800 levelHistoric RSI low @ 10.22, coincides with potential 0.886 retracement. Bounce to 50% level which has confluence with previous high.

Before you buy XEMJust ask yourself the question. What would happen if the price would drop just one sat below the line? Will it go back up, like nothing happened?
Or will it activate all the stops that have been accumulating over the past month..
Or will it surge down in a stoploss pool of blood.
Or will it bounce on a discreet level meters below the line of doom catching you off guard again.
You probably did it right? Bought at around 1050 and put your stoploss at 1042 or lower.
Ill place my buy at around 867 and ride the reaction back up. Thank you very much.
*This is not financial advice*


XEM/BTC within possible descending triangle areaXem/BTC not looking so great as 200 EMA line closing in the price action and descending triangle appear.
although there a possible bounce from MACD and RSI itself is oversold as it's ready to shift into buyer side and might be retest 20 and 50 EMA in the future around 1200 sat..
Also a potential for Exaggerated Bullish divergence might occur...
1st support around 1000 satoshi area
2nd support around 850 satoshi area
1st resistance around 1200 satoshi area (20 + 50 EMA)
2nd resistance around 1400 satoshi area (200 EMA)
please take this idea as a grain of salt as reality always differ from what i expect as this post merely just an opinion.
and please feel free to share what your thought on comment section.
peace.

xem 30 days trend up and down xem buy and sell target on chart
also xem has more potential for later
good luck dear traders
Please just like if you helped


NEM/BTC which way to go??NEM/BTC have a different story between looking at 4 Hour chart vs 1 Day chart..
this the chart i mention is 4 hour that still undecided which way to go.
because it's still no buyer volume to maintain the bullish movement. yet.
While i check 1 day chart :
- there's still a movement toward downside as MACD is ready to consolidated with buyer/seller line
- Stochastic RSI cleary pointing down. meaning momentum to downward/suppress the price is still continue.
- RSI is wandering around in neutral zone which is 40 -60 (the value number is 56 by the time i write) and pointing down ready to test 40 value number of RSI
- volume level is decreasing indicated some major move will be included..
i remain neutral as this coin just plunge and drop to 97% from it's all time high, According to messari.io/onchainfx
but it's a good coin to get a good precentage of profit and still a good time to accumulate at this level..
beside, we never know how crypto market would react.. lol...

