XEM back in channelXEM looks to be back in the channel before it was pumped up a bunch. Looks like a safe entry
XEMBTC trade ideas


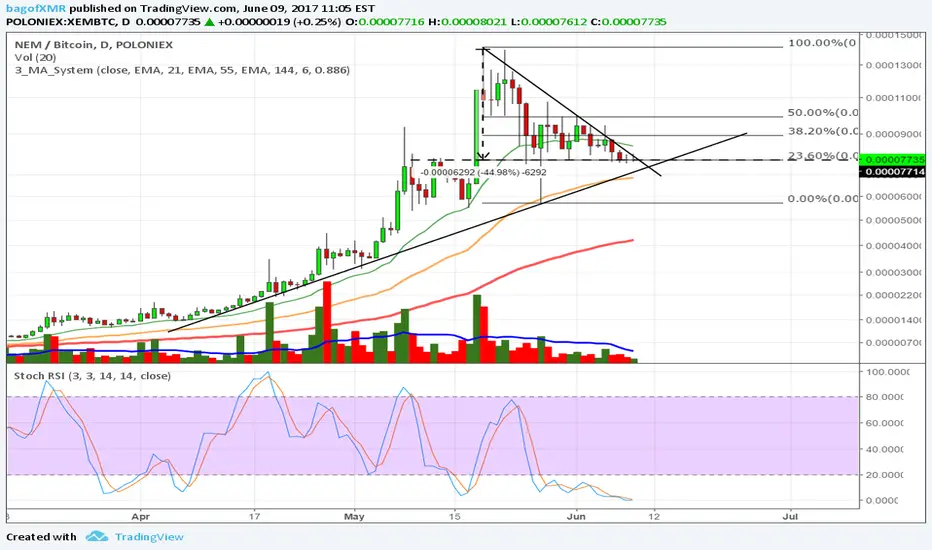
Consolidation maturing, NEM Long
Yellow are horizontal resistance levels.
Pink represents, the resistance trend from previous high of ~14000, it intersects with support line at around June 17th, at #1.
Orange represents, the resistance trend angle of ~10750 to ~8180, it intersects with the support line ~ June 19th, at #2.
Red represents, the resistance trend angle of ~10750 to ~9450, it intersects with the support line ~ June 21st, at #3.
The resistance horizontal points are from quite a while ago, so possibly not necessarily as relevant as they usually are, but something to consider nonetheless.
What does all this mean? I have no idea, I'm not a professional. But I think for some reason, a breakout is more likely between June 17th-June 21st, then other days.
To me, I just kinda see some things aligning up. Who knows, maybe Xem will stay within the Trend range I have there, for quite a long time until some big news is released. Maybe it'll downswing out of it, But I hope you enjoy'd the chart.


NEM about to take a direction - Potential nice longDescending volume and StochRSI signaling it's ready. Price right now holding at 23% retracement + horizontal support and 4h EMA support
We also have a 4h macd crossing bullish and the price is currently sitting at almost 50% retracement of the top.
Moreover NEM is a legit project.
Wait for the breakoug and go long. No option to go short, so if it breaks down we will just have to step out
NEM XEMBTC --LONGI am active on triangle breakout trade earlier, but still it did'nt kick off, after reanalysis i found that it ma day trigger with in a week or 10 days time as soon as reaches trendline support, looking for a rebound. Once it will rebound from trend line , the price will be sky rocket...almost doubled what currently is 0.23 usd and it may reach upto 0.45 to 0.5 usd level.
Cheers!!


NEM/BTC - Reversal Bulls I'm currently looking at NEM/BTC to do a reversal back up from its journey down with the bear.
I have marked the areas for stop loss if you enter a buy on day/weekly trading etc. If it does break past that point, I would recommend you sell and then find a better entry point for the strong bulls push up for sure.

Following NEM moon or doomLook for clear breakout from down channel, then buy, if not, doom for NEM.

XEM BTCIM NOT A PROFESSIONAL TRADER, BUT HERES MY POINT OF VIEW
XEM ITS BREAKING THE LONG TERM BULISH TREND LINE, AND AT THE SAME TIME THE 50 MA
I CANT SEE TOO MUCH BULISH POWER HERE SO I'LL GO SHORT
PRICE MIGHT GO TO THE NEXT SUPPORT LEVEL AROUND .00005 - .000051
EVEN IF SOTCH ITS OVERSOLD, NOBODY SEEMS TO BE BUYING IT

NEM at crossroads, to the moon or doomNEM is about to touch the 50 days Moving Average, which coincides with a long term trend line which has acted as support for months. RSI at 3 months low, and MACD close to zero also at 3 months low. Look out for up movements, but wait a bit for some consolidation (it is coming a bit too strong and could break down, no need to hurry if uptrend is confirmed going to the moon).

Decision time for XEM in the next two daysThe wedge is getting cosy for XEM. It will have to decide in the coming days. There seems to be some strong support at around 7600 sats. Hopefully we will see a boost upwards.


XEM-BTC analysisI fast analysis from NEM crypto-currency (XEMBTC) mainly based on Pitchfork trend, where Pitchfork is all about to respect the zones blue and green, and lines such as median line, bottom and top blue lines and their intersection between the blue and green region. So, bases on 4hrs time-frame it is possible to see that we have a interesting trend.
Until it is possible to notice, the market is about to test the region where is located the Exponential Moving Average (EMA) 50 periods. Then, in case this EMA 50 hold the the price, it is possible to make a entry in this asset; nevertheless, a short time-frame analysis in necessary to refine the entry.
However, it is still necessary (in my opinion) wait for a reversal signal based on MACD . Even though MACD and RSI do not show divergence, it is clear that at least MACD did not show a change in its signal line, which means that the price will keep falling/testing EMA 50.
Bollinger Bands show us the price bellow its base/median line, which means a possible continuation of bearish movement.
To interact with this chart, please click below in RELATED IDEAS
For analysis based on Ichimoku Cloud , please click on the reference link below RELATED IDEAS.

XEM/BTC Are we here to make the profits or what?XEM is now in accumulaion phase, so quiet. There gonna be something big in several days. The stoch is at the bottom for 1 day chart, need some good news for the start, but watch the cloud, we should not cross it.

XEM is testing Support LevelWhen it Breaks Suppprt Level it can be go down to 0,00007300BTC then up again to break resistance, consolidate and continue grow naturally.

xem long After breaking the line of resistance You will climb INSHA ALLAH
TP1 0.00010700
TP2 0.00013970
TP3 0.00016900
STOP LOSS 0.00007100
you want to support me with some currencies? Thank you. Dear, I am waiting for your transfer ^_^
Btc:- 185L4brNKmSVfFop1hc3nVdHo4z6iX2yBX

XEMBTC moving downwardXEMBTC from yesterday , no buyer come back . It fails to bounce the price up
Therefore, today XEMBTC will moving down to test support line
probably going down to tp1
Enjoy trade
If you like my work please help to like and follow
Thank you


Another Possible setup to keep on your watch listXEM has been moving real slow recharging its engines. Even with BTC going up XEM remains sideways. Watch it and use your head, not your emotions.

XEMBTC fail to rise now it will go downXEMBTC will go down soon
the opportunity to sell is now or soon
I think this trade has good ratio of risk and reward
Enjoy trading
If you like my work please help to like and follow - Thank you

Ping-Pong Bearish bat-Bullish batAs You see price action indicates indecision, for brave trader it's a good short time speculative opportunity. I try to seek small longs in the blue rectangle area, when other indicators tell me that local bottom is possible here.

NEM (XEMBTC) Main Trend Update: Triangle Pattern IdentifiedSince late May NEMBTC has been trading sideways. The main trend remains positive, but the short-term picture isn't that obvious: the Triangle pattern speaks of indecision among traders. It's not clear whether wave IV has been completed. In any case, I suggest employing the break-out strategy with triggers set @.7957 and .9499 levels (see chart).