Speechless on $XEM. A Proven Fundamental That Last Longer!I love to see projects that has survived from many challenges. Just like XEM. One of the oldest projects that still stand strong. Even, currently, they're working with Pundi X and creating NPXSXEM!
You can say the team is down to earth to admit they're in need of strong partnership or in other words they need to be ready of any challenges ahead and be open minded for every opportunity around.
Above all, I'm watching XEM progress and i can see there is a bright future for the team head if the team keep making a steady progress.
Look at the chart, pretty much lovely for the R:R ratio.. and Fibonacci is available for you who look for mid-term targets. I'm not swing trade XEM, I kind trend trade. It's better strategy on XEM and not cost me a lot of energy :)
So, what are you waiting for? the blue arrow says good to get in!
If all of these ideas I posted helps you, give them thumbs up, shares, comments and follow me. Thanks a lot!
XEMBTC trade ideas

Get ready for the next XEM/BTC run!If you like to play the big cycles right now would be a very good time to buy.
Of course, don't go all in at once.
Average in! The cheaper we can get it the better.
I expect to get 7x on my investment.

Inverse Head and Shoulders/Cup & HandleVolume confirmation is making this look right on track. This has been a sleeping giant and the beast has just woke.
Not investment advice, just my observations...also I have skin in the game on this.

Does XEM starts a new BULL trend?Possible brake out of a long down trend.
All comes to BTC price action. If BTC will keep stagnate XEM has a potential to start climb up.
Right now we should target only short term profits.
If we will start a XEM trend I will update this chart and write down targets for a TP1 TP2


Reverse Head and Shoulders PatternI see an inverse head and shoulders pattern that could be extremely bullish with volume confirmation. Trading above the hammers right now is also very bullish, considering the most recent long-handled hammers are confirmed by large volume spikes.
Another green volume spike should send the price back up.

NEM (XEM) 10% or more pattern.
Hi, NEM looks great in the chart now, so I buy a little bag.
There is possible scenario, that history will repeat again, in this case we can take 10% fast.
Similar chart after drop 8days accumulation and Nem up 150sat 10%
Bollinger bands wait for some movement.
Target: 1570-1620sat
Stoploss: 1395sat

There is a possibility for the beginning of an uptrend in NEMBTCTechnical analysis:
. NEM/BITCOIN is in a range bound and the beginning of uptrend is expected.
. The price is below the 21-Day WEMA which acts as a dynamic resistance.
. The RSI is at 44.
. While the RSI downtrend is not broken, bearish wave in price would continue.
. The price downtrend in the daily chart is broken, so the probability of the resumption of an uptrend is increased.
Trading suggestion:
. There is a possibility of temporary retracement to suggested support zone (0.00001430 to 0.00001200). if so, traders can set orders based on Price Action and expect to reach short-term targets.
Beginning of entry zone (0.00001430)
Ending of entry zone (0.00001200)
Entry signal:
Signal to enter the market occurs when the price comes to " Buy zone " then forms one of the reversal patterns, whether " Bullish Engulfing ", " Hammer " or " Valley " in other words,
NO entry signal when the price comes to the zone BUT after any of the reversal patterns is formed in the zone.
To learn more about " Entry signal " and the special version of our " Price Action " strategy FOLLOW our lessons:
Take Profits:
TP1= @ 0.00001780
TP2= @ 0.00002170
TP3= @ 0.00002430
TP4= @ 0.00002930
TP5= @ 0.00003880
TP6= @ 0.00004760
TP7= @ 0.00005400
TP8= @ 0.00006640
TP9= @ 0.00008610
TP10= @ 0.00009630
TP11= @ 0.00011880
TP12= Free

NEM (XEM) ready to took off?There are bullish divergences in both the SRI and the MACD, plus an increase in volume in what appears to be support. Worth the risk.- POLONIEX:XEMBTC


Simple Price projection: 100% gains?Looks like last time, i was a little off, but the drop was short, so it looks like we could be in reverse actually..
Support must hold
Fractal on Sep 12-13 was a SPOT ON!
Good luck everyone ;)
**LEGENDS**
BLUE = Bear/Resistance
Yellow = Bull/ Support
~Explore the chart for possible scenarios of price actions - use zoom and scroll for better view.~
/*This information is not a recommendation to buy or sell. It is to be used for educational purposes only.*/
If you want your coin to be analysed, JUST ask.
If you got a question, ASK away!
And please keep those Stop losses in place!
Fractal dates are moments of interest, where price and time collide to create oscillation.
Thank you,
Ajion


NEM is MEN spelt backwards!You'd have thought with a name like NEM that the obvious ticker name would have been NEM. But no, we're stuck with XEM!
For those of you that aren't already familiar with NEM, NEM is a highly regarded Chinese blockchain project to compete with Etherium, EOS and others. What gets people super excited about this particular blockchain is that they appear to be viewed favorably by the Chinese Government, and with China being a huge market, that gets people all hot and sticky!nity
Right now NEM is at bargain basement levels and looks like it could be ready to head higher. While there is certainly a short term trade opportunity here, I really think this could be a 10x from here if you're prepared to hold it long term.
Take a look at this weekly chart....
NEM weekly moon chart!
It's looking pretty delicious, right?
I think there could be a small downwards move from here, but our potential upside is HUGE.
Please like and follow for updates and new trade ideas.

XEM prospective long-term investment#NEM
If you open a weekly chart, you can notice the huge oversold of this market. At the moment the price is at its minimum levels, where a new wave of growth can start to form. There is a good opportunity to start opening long-term investments, but one should take into account the possibility of lateral movement and fluctuations in the near future, which will make it possible to buy lower. Always use money management and risk control. In general, NEM has great potential, excellent technology and great popularity in Asian markets, which in the future will not leave a coin for its minimum values. Based on the schedule, the market is ready to form the ground for the upward movement by the end of the year, after which it can get another impulsive breakthrough with target areas near Fib resistances, the result of this scenario will be a profit from + 270% to + 800%

XEMBTC is strong buy at this low rate, 750% PotentialNEM (XEM)
Rank on Coinmarketcap - 18
Market Cap - $901,749,602 USD = 133,579 BTC
------------------------------------------------------------
RSI @ 33
ATH 13750
Current 1534
Buy at CMP or place order around 1400
------------------------------------------------------------
TP1=2369
TP2=3077
TP3=4606
TP4=7588
TP5=ATH
Stop loss- If daily candle close below 1300
------------------------------------------------------------
Trade at own risk

Accumulate today, technical entry before Sep12-13 F-date.Hey everyone, this looks like an ideal, entry and accumulation for those that believe in XEM.
This is the most technical trade i have seen in a while.
We have a lot of trend line converging on a specific price level.
The 4-5 wave on descending channel was broken. And we having almost little sellers left.
If price can;t go any lower, it usually going to go the opposite direction.
Larger volumes on a flat price line with little volatility is a good indication that a reversal is more likely, the downfall.
And with a current stop loss of about 4-5% anyone who wants to get some XEM should do so.
A rare fractal event is also fast approaching between Sep 12- 13, and the next one is in nov 18th.
Stop losses are identified, in case we are wrong in our assessment of this accumulation.
Good luck everyone ;)
**LEGENDS**
BLUE = Bear/Resistance
Yellow = Bull/ Support
~Explore the chart for possible scenarios of price actions - use zoom and scroll for better view.~
/*This information is not a recommendation to buy or sell. It is to be used for educational purposes only.*/
If you want your coin to be analysed, JUST ask.
If you got a question, ASK away!
And please keep those Stop losses in place!
Fractal dates are moments of interest, where price and time collide to create oscillation.
These fractal events are identified as dotted vertical lines.
Thank you,
Ajion
XEM: 109189300
XEM: NC64UFOWRO6AVMWFV2BFX2NT6W2GURK2EOX6FFMZ
If you support the work i do, and you believe in building a transparent and open crypto fund.

Xem/BtcBuy
1400-1200
Sell
1800
2510
3150
4100
Mid-Long Term
Dont worry Btc will test resist 6800 and if cant break will correction to 6k-5800 and will test again 6800 if break Btc will go moon
Sl 1000
You can hold without Sl if u want
Dont forget to like and follow to get new updates about crypto

$XEMBTC: Remains on Watchlist; Could be getting interesting hereSome has asked my thoughts on $XEMBTC.
Chart remains in correction territory as it continues consolidation.
Interestingly enough, it's back at the support levels from December 2017,
so there could be some potential for history to repeat itself with a bounce.
Again, right now it's trending sideways...
Last week it appeared things were going to turn around for the stock;
however, yesterday turned that thinking back around.
At the moment, I'd like to see that chart turn 0.0....1560 into support and be
able to hold that level for a retracement back towards the 0.0....1777 area.
I do anticipate a squeeze on this stock to move abruptly in either direction;
however, once again, if history repeats itself - you can see how the stock reacted
back in December around this same territory :-8

$XEMBTC: Start of the Trend?This is what we discussed a few days ago. Here we go with... 0.0...1558 turning into support.

XEM at great support for a major bull runA stronger support would be 900 satoshi. keep eyes on this for now or enter with a stoploss and re-eneter at 900 if the stoploss got triggered.

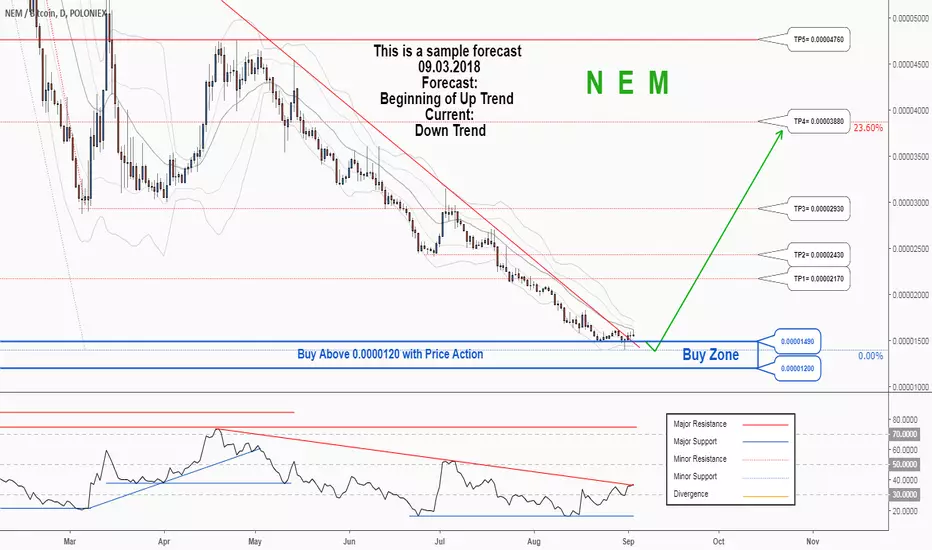
There is a possibility for the beginning of an uptrend in XEMBTCTechnical analysis:
. NEM/BITCOIN is in a downtrend and the beginning of uptrend is expected.
. The price is below the 21-Day WEMA which acts as a dynamic resistance.
. The RSI is at 37.
. While the RSI and the price downtrend in the Daily chart are not broken, bearish wave in price would continue .
Trading suggestion:
. There is a possibility of temporary retracement to suggested support zone (0.00001490 to 0.00001200). if so, traders can set orders based on Price Action and expect to reach short-term targets.
Beginning of entry zone (0.00001490)
Ending of entry zone (0.00001200)
Entry signal:
Signal to enter the market occurs when the price comes to "Buy zone" then forms one of the reversal patterns, whether "Bullish Engulfing" , "Hammer" or "Valley" in other words,
NO entry signal when the price comes to the zone BUT after any of the reversal patterns is formed in the zone.
To learn more about "Entry signal" and the special version of our "Price Action" strategy FOLLOW our lessons:
Take Profits:
TP1= @ 0.00002170
TP2= @ 0.00002430
TP3= @ 0.00002930
TP4= @ 0.00003880
TP5= @ 0.00004760
TP6= @ 0.00005400
TP7= @ 0.00006640
TP8= @ 0.00008610
TP9= @ 0.00009630
TP10= @ 0.00011880
TP11= Free