Tripple shot top on XEMBTCI just feel like it's going triple top like my McFlurry vanilla shot :rocket: :shrug:
XEMBTC trade ideas


XEM-BTC short to the earthif xem follows its previous fractal, we should expect 2-3 months bear for XEM from this point
in addition, XEM has very weak pump during releasing V2 version software and 500$ xem hacked on coincheck
And uncertainty about its security status
So I'm strong believing that XEM won't rise up for at least 2-3 months
stay safe everyone

#NEM into 2019Looking positive and yet to really pump like the other major alts in this bull market so far.
I hear good things from them at Concensus - so I'm bullish on this seasoned project.

NEM Short ideaHi,
NEM offers a short term sell opportunity as shown. Sell a close below the trendline - target recent low.
Good trading!

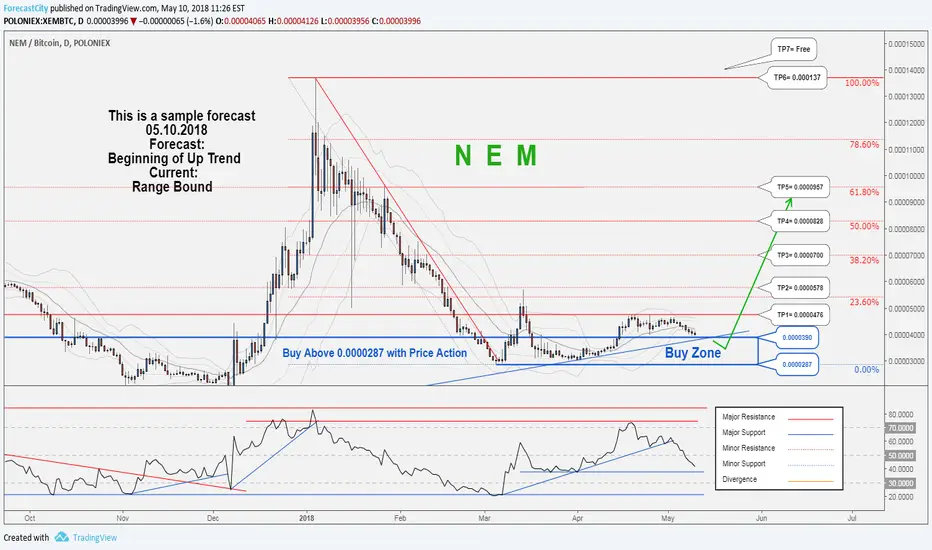
There is a possibility for the beginning of uptrend in NEMBTC .Technical analysis:
NEM/BITCOIN is in a range bound and the beginning of uptrend is expected.
The price is below the 21-Day WEMA which acts as a dynamic resistance.
The RSI is at 41.
Trading suggestion:
The price is in a range bound, but we forecast the uptrend would begin.
There is a possibility of temporary retracement to suggested support zone (0.0000390 to 0.0000287). if so, traders can set orders based on Daily-Trading-Opportunities and expect to reach short-term targets.
Beginning of entry zone (0.0000390)
Ending of entry zone (0.0000287)
Entry signal:
Signal to enter the market occurs when the price comes to "Buy zone" then forms one of the reversal patterns, whether "Bullish Engulfing" , "Hammer" or "Valley" , in other words,
NO entry signal when the price comes to the zone BUT after any of reversal patterns is formed in the zone.
To learn more about "Entry signal" and special version of our "Price Action" strategy FOLLOW our lessons:
Take Profits:
TP1= @ 0.0000476
TP2= @ 0.0000578
TP3= @ 0.0000700
TP4= @ 0.0000828
TP5= @ 0.0000957
TP6= @ 0.0001370
TP7= Free
XEMBTC Plausible price actionThe coin is into a triangle formation. The RSI is moving much faster than the price while falling which means that the upside swing is much stronger and more steady than the downside. We also have a bullish divergence of the RSI tops and the price tops. What is more, the RSI has been oversold at the bottom of our triangle and that makes it quite unlikely for the price to dive deeper. Last but not least, the risk/reward ratio is quite good and one can win much more than what he is risking.
*Disclaimer: this is for educational purposes only*

NEM downside correction on whipsaws and shooting starNEM downside correction on whipsaws and shooting star likely to plummet more prices but more luring for investments:
NEM (XEMBTC) attempt to bounce back but restrained below 21DMAs, as a result, the pair forms shooting star pattern which is bearish in nature.
If you observe the daily plotting, the price behavior of this pair has gone in whipsaws pattern on 7DMAs, this pattern preceding an uptrend would be the bearish signal (refer daily chart).
Both leading oscillators (RSI & stochastic curves) on this timeframe has shown constant downward convergence that indicates the strength and the bearish momentum.
Consequently, the current price has slid below DMAs to trade at 0.00004119 levels with bearish MACD crossover. For now, more price slumps are expected upto 0.00004070 levels on most likely bearish EMA crossover.
However, on the contrary, as investors get more exposure to crypto trading and learn decisively, price volatility and market turbulence are quite mutual events. Hence, there’s no cause of concern when a crypto dips. Nevertheless, when the slump confines only to selective crypto-asset classes, then apprehension sets in. That was the case with NEM (XEM) investors.
The driving factors of why investing in XEM is shown below:
NEM has partnered with several lucrative sets of enterprises such as Paytomat, Kchain, Dargonfly fintech, and ProximaX etc,
On the flips side, an increased penetration as XEM is added to ABRA wallet, by counting on XEM, the wallet’s developers unbolted it for accessing trading on a wider community of users.
While publicizing the cutting-edge add-ons, the CEO, and founder of Abra Bill Barhydt mentioned that:
“By adding the five new cryptocurrencies to the already robust list of coins Abra supports, we are continuing to offer exposure to assets that have traditionally been difficult to access in a simple and secure way”.
Well, we wish to conclude by reminding investment refers to a long-term phenomenon or any mechanism deployed to generate future cash inflows. Thus, even though you see abrupt price dips that would now be deemed as panicky shorts which are momentary.
Currency Strength Index: FxWirePro's hourly BTC spot index has shown -153 (which is bearish), while hourly USD spot index was at 75 (bullish) while articulating at 10:07 GMT.

150% gain possible, breakout is soon.Chart is very straight forward, we are about to break out.
and begin the usual patterns in the upward direction.
/*This information is not a recommendation to buy or sell. It is to be used for educational purposes only.*/
If you want your coin to be analysed, please PM me.
Thank you,
Ajion

XEMBTC quick tradeXEM showing signs of bullish divergence:
RSI bullish
price bearish
--> price reversal inside an ascending triangle
Stop loss : 0.00004375 btc (-0.84% loss)
Target Price at 0.00004600 btc (+4.24% profit)
bought at 0.00004224 btc


Buying XEMBTCOn the daily chart of XEMBTC, the price has started a new uptrend and formed a bullish fractal level. Breakout of its level would be an optimal level to open long traded with a target in the C wave.

XEM bullish divergenceXEM very bullish after successful bull pennant break and consolidation above trendline. Expecting big moves soon.

XEM Buy signalIm placing some buys here for XEM
Spreading buys between 445 and 450
Target 556
target 626
target 7020
Daily RSI look strong and looks to be flagging into a 3rd wave run.
Traveling above the cloud on smaller time frames so support momentum hopefully building

XEMXEM coming down in a strong BULLISH pennant for a FULL reset on the daily stochastic RSI. I expect this one to break out in the next few days. Entering a small position now, will be adding over the next day or so depending on movement.


NEM is ready to rock!Japan's 2nd biggest crypto currency is one of the first crypto's to bounce on the new bullish outlook for crypto.
Target for first sell is 0.00007300
Rebuy @ 5700
2nd Target sell is 0.00010500

XEM time to buy?you have 3 possible good entries , it is clear on the chart.
wait for a triangle break out or buy at support trend / line.


NEM is Now Listed on BinanceJust a few hours ago NEM coin has been added to Binance and XEM/BNB, XEM/BTC, and XEM/ETH trading pairs are now available for trading. This news certainly can add trading volume for this coin and potentially boost the upside momentum that seems already started.
After a strong correction for the 13.5k satoshis high, currently, XEM/BTC is trading at 3750 satoshis, which could seem an attractive and cheap price for investors. Technically, XEM/BTC trend remains upwards as the 227.2% Fibonacci channel trendline has been broken on a daily chart. The two Fibs applied to the corrective waves after the downtrend trendline breakout point to the 21k satoshis as an upside target, which is almost 500% potential gain. While NEM is trading above 2440 satoshis support the uptrend is likely to begin.
However, break and close below the support could send price back to 800 satoshis and/or extend the consolidation period prior to the uptrend.


