XEMBTC trade ideas

XEMBTC NEM Big move ahead!NEM is making all the right moves!
Things to note:
moving average cross in small purple circle presently coming.
ABOVE THE 20/50 period moving average!
RSI high on daily and can go higher according to past.
Look at December on the left. The moving average cross and high RSI did well. This might pan out same now.
What happened on March 10-12th? The 50 moving average acted as resistance and the 20 was below 50 so it was a clear bear market.
I drew fan lines for resistance. Check out John J. Murphy's TA book on this. I excpect to consolidate and restest the highest fan line resistance. IF WE BOUNCE OFF THE 20-50 to the upside bear market is over and moon boots time!
WHAT'S DIFFERENT THIS TIME????
VOLUME. Volume is second in importance next to PRICE in TA. We had a HUGE boost in volume to kick off the rally, right now it is anemic in comparison. If we break through the .618 fib level then everyone might wake up to this.
Red lines are support that is now resistance...

NEM have a high media attention.Coin of the day is NEM.
NEM is a peer-to-peer cryptocurrency and blockchain platform launched on March 31, 2015. NEM has a stated goal of a wide distribution model and has introduced new features to blockchain technology such as its proof-of-importance (POI) algorithm, multi-signature accounts, encrypted messaging, and an Eigentrust++ reputation system.
In 2016, NEM jumped in price and become one of the largest cryptocurrency by market capitalization. While the industry was struggling with the DAO hack and recession of the Ethereum, several Japanese banks signed an agreement with NEM to create a payment infrastructure for the blockchain.
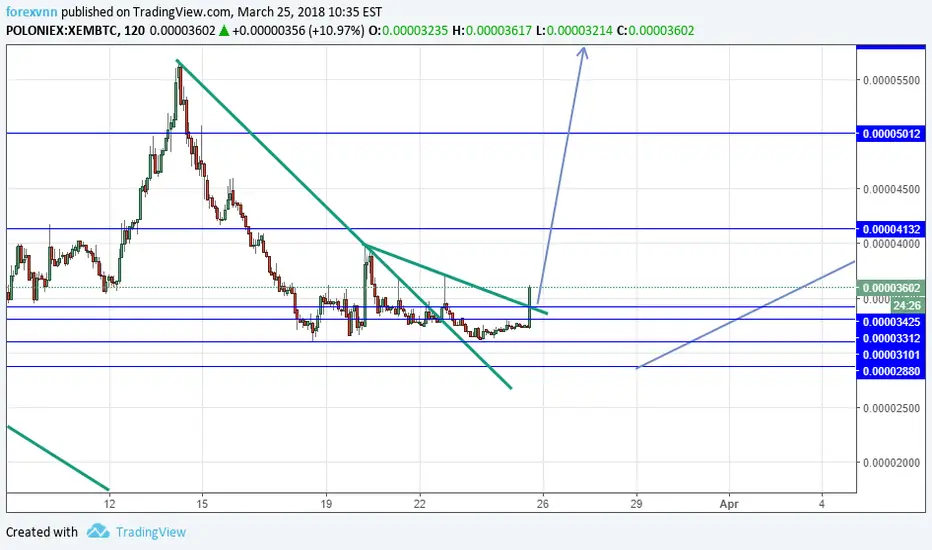
The 2018 year which started with the depression all around the cryptomarkets pushed the coin to the lows, almost wiping the 2017-year gains. XEMBTC found a bottom around the 0.00003 level and now is drawing a rebound pattern.
Media attention on Reddit and Twitter has risen to a new high during last week; such shifts could have occurred due to NEM listing by Binance (in March) and overall positive news background around the coin. As reported via CoinLive earlier last week, Tutellus, a blockchain-based EdTech company aimed to incentivize both learning and teaching, switched from Ethereum to NEM as its main blockchain.
XEMBTC brought attention to itself during last days by the strong growth and breaking above the 0.00004 resistance. Last time when the coin went into an uptrend, it ended at the 100-days EMA (14.03.2018), today the price reaching 100-days EMA again. A breakthrough above the EMA will lead the price upwards to the previous high at 0.000057. The break of the 0.000057 high will change overall chart bias to an uptrend. From the below, 0.0004 level should hold as a support to remain bullish sentiment.

XEM buy signal 32% gain from Bottom FinderTop coin at Binance. Last buy alert 2days before peak. Default Bottom Finder settings (1hr, rsi45 buy) , buy 34 sell 45, potential gain 32%. Sell rsi 79.


XEMBTC 5TH WAVE5th elliott wave comming, aiming at fib retracement 1.168 and 0.382 from wave 1 and recent ath
-TP @ 0.00004035 btc


XEM supports, resistance, trend lines, and fib4hr chart on new economy movement. Buy and sells zone. good luck. RSI is hitting the oversold territory, and macd is running bull with some room to run!
NEM(XEM) will be tradable on Coinspark In April
"Join the first world-class quality blockchain and cryptocurrency conference on May 4-5, 2018 in Amsterdam, Netherlands"
"Catapult NEM (version 2.0 of NEM) will come sometime in May 2018"
Good buy and sell zone are in between the yellow line and fib lines that are closest together.


XEM seems to have reached the bottomXEMBTC decreased very hard also after the previous hack scandal. It seems to have reached the bottom although a bull run on BTC can bring it to a temporary new low. However it is curently overing between MA20 and MA50 and if it holds we can see it move to MA250 in the next days.
Enjoy!

NEM XEM DOUBLE BULLISH DIVERGENCE ON MACD INDICATORIN 1D CHART NOW NEM IS GENERATING OF THE DATES FEB 21 AND MAR 13 AND THE ACTUAL PRICE
BUY AND LETS SEE THE BENEFITS!


XEM Short term tradeHello Friends,
Please find the XEM trade. (SHORT Term trade)
1) Listed in Binance.
2) Forming Double bottom, as we broke the neckline already and the price is testing the neckline and forming a pull back.
3) Volume is good.
Considering the above points, we would hit 15%, target : 4150, Stoploss is below the neckline.
Post your thoughts.


XEM Long term tradeHello Friends,
Please find the XEM long-term view.
1) Listed in Binance means more volume.
2) We have made the double bottom around 3000 SATs twice which is a sign of coin reaching the bottom. And a decent bounce of 3000 SATs from 5600 SATs is a good sign that price has reached the bottom.
3) Volume is good.
So my trade is
Buy on the neck line : 3640 SATs
Target 1: 4200 SATs
Target 2: 5600 SATs
Target 3: 10000 SATs (once broken the neckline at 5600, expect a pullback and the price could move to 10000 SATs.)
Sl : 2800 SATs
Risk Reward for this trade, 800 SATs : 6360 SATs , 1: 8

XEMBTC long above 3100 ASSP Tp at the Blue on CHART XEMBTC long above 3100 ASSP Tp at the Blue on CHART
XEM RSI Trend.The chart explains itself really, with the RSI repeating patterns and consistently hitting 0.618 Fib levels. NEM has a lot ahead of it this year - Catapult in May, Many projects being built on top of the platform, and many companies testing the blockchain behind the scenes.

XEM RSI analysis and predictionsIf XEM Follows previous patterns, this is what we can expect to see on the weekly RSI. If it follows the same, now is a VERY good time to get in indeed. NEM Foundation has also behind the scenes been working with numerous companies that have been testing their blockchain. With the release of catapult rumoured to release in May and additional projects being built on top of NEM. This is looking to be a very profitable year.
We can also see that the RSI is consistently hitting 0.618 extensions.

XEM/BTC Is the trend line can stop the loss?The day that XEM listed on Binance (Yellow Circle), it jumped from 32000 satoshis to 40000 as we predicted. Per this chart, you can see the support line which XEM reacted to this line several times. We believe this line could hold the price from further loss. It is better to watch it carefully.

