Wave 3: XEM BTCWell, our targets were hit and broken! price broke well under the 0.786 Fib level due to some volatile BTC price action over the past 24 hours. Lots of panic selling ensued and price dropped further than predicted.
Have now amended wave 3 targets based on wave 2 floor price.
Wave 3 is never the shortest thus I predict it will take a little while for the price to rise back up to predicted targets (Purple line - 1:1 fib extension, Red line 1:1.618 fib extension). As mentioned on the graph the red line is an optimistic take, nevertheless it's good to have targets if the price breaks through the resistance on the 1:1 fib extension).
Because wave 2 hit such low fib targets, we can expect wave 4 to hit higher lows than it would usually (Price will typically fall to a lesser extent). Will see when wave 3 ends how wave 4 and 5 might play out.
Again have used only fib retracements and extensions along with Elliot wave theory to reach these predictions.
With BTC domination and considerably influencing other crypto's, predictions remain unpredictable :D
Any opinions appreciated.
XEMBTC trade ideas


NEM (XEM/BTC) - 70% profit potentialXEM chart looking ripe for the picking.
Buy Zone: under 4500
Sell Targets:
T1: 4949
T2: 5434
T3: 5779
T4: 6219
T5: 7488
Stop Loss: 4000

Price target predictions using Fib Retracement and Fib extensionABC correction seems to have finished and first impulse wave has now been completed. Based on first impulse wave we can now get some targets going for waves 2/3. Based on these targets waves 4/5 can be roughly estimated also.
To get Resistance support levels (purple lines) : Used Fib retracement from previous rally up to ATH
To get Elliot wave wave targets: Used Fib retracement on first completed wave to get predicted target. Then using predicted targets to further use Fib extension/retracement to Predict a full 5 wave analysis. Using resistance/support levels to reinforce price action.
Have only used Fib extensions/retracements to predict these targets. Have analysed the previous years rally/crash and same Fib levels have been hit consistently. This is supportive that these target levels will be reached.
Have primarily focused on Wave 3 targets because waves 4-5 are harder to predict until wave 3 has been completed. Still waiting for wave 2 to complete - have used fib levels to predict wave 2 targets (Orange/Red lines). based on wave 2 targets I have been able to get a rough estimate on wave 3 targets - Green/yellow lines.
Timeline is very sketchy, have based a rough timeline based on another graph, showing We should hit $1 by June/July.
Any opinions appreciated.


10SMA Crosses Above the 20SMA - Moving Average Crossover SIgnalIf you have been trading for some time and have been
using Technical Analysis as a way to find trading
opportunities, you would have probably come across the
Moving Average Crossover strategy.
It is probably one of the most well-known Technical
Analysis signals out there. The strategy basically uses
Two Moving Averages, one with a shorter period and the
other with a longer period.
A bullish signal is generated when the shorter period
Moving Average crosses the longer period Moving Average
from below.
When the opposite happens, that is when the shorter
period Moving Average crosses the longer period Moving
Average from above, we have a bearish signal.
Now the million dollar question is does this strategy
actually work?
There are those who swear by it, while others feel that it
is the sure road to the poor house.
*DISCLAIMER*:
I am not a financial advisor nor am I giving financial advice.
I am sharing my biased opinion based on speculation.
You should not take my opinion as financial advice.
You should always do your research before making any investment.
You should also understand the risks of investing. This is all speculative based investing.


NEM (XEM) long trade POLONIEX:XEMBTC
We just broke thru overhead horizontal support which was tested many many times as well as broke up thru the downtrend line which both have been tested with success. We're also coming out of an oversold position. Going long here would be safe with an exit of the underlying upward support line Ive drawn.

NEM (XEM) Technical AnalysisNEM (XEM) Technical Analysis
Analysis Type
- Elliott Wave
- Support and Resistance
- Pattern Analysis
- Structure Analysis
- EMA
- TDI/RSI
- Breakout Analysis
- Trend Analysis
----------------------------------------------------------------------------------------------------------------------------------------------------------
DISCLAIMER: This chart is for sharing and educational purposes only and is not intended to be a signal service or similar.
This chart analysis is only provided as my own opinion, based on my own analysis and comes with absolutely no warranty that this analysis is correct, whatsoever. Do not trade this chart if you do not have your own strategy. Trade only with your own strategy at your own risk. Plan your trade and trade your plan... and IF in doubt, stay out.
.....::::: If you like this chart, please click on the THUMBS UP! :::::.....
----------------------------------------------------------------------------------------------------------------------------------------------------------

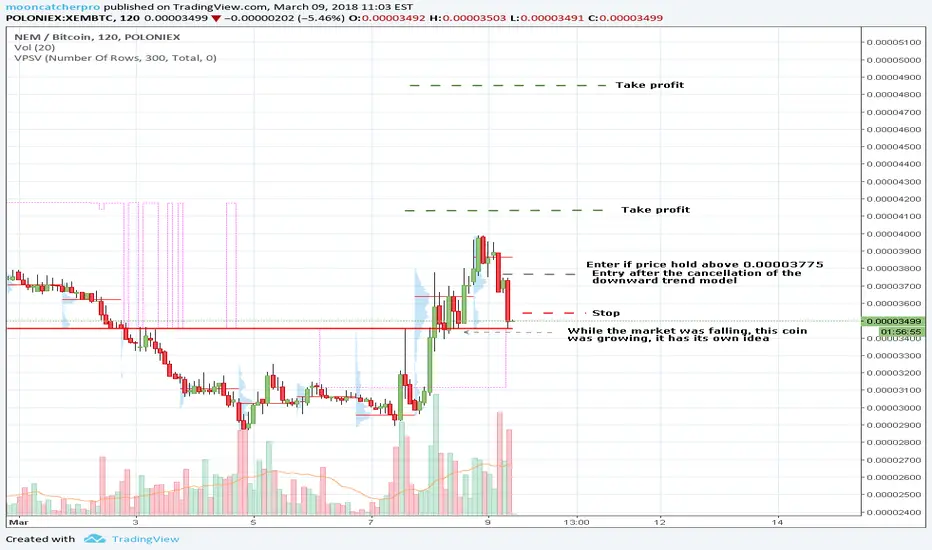
XEMBTC (Volume Analysis Prediction 3/09/2018)If the rollback stops, then the uptrend can be quite strong
Entry after the cancellation of the downward trend model
NEM calms investors and grows furtherCoin of the day is NEM.
Recently formed by NEM rebound pattern develops further.
The decline in NEM value over the last weeks was provoked by the hack of the Tokyo based cryptocurrency exchange Coincheck.
There were two main reasons for the concerns: that Coincheck will not return the stolen funds and the fear that the stolen NEM's (XEM) would be dumped into the market and drop the price. Both these fears were dispelled, the exchange started to return the funds and realization that the stolen money could not harm the NEM market given its large capitalization calmed investors.
From the technical view, the pair is showing a sustained uptrend for the last days and established a bullish trend line support. The 0.00004 level was broken and turned into support. From the upside, the 0.00005 level and the 100-days EMA will be the next targets if the bullish scenario will continue to develop.


NEM on FIRE.Whats good the goat is here AGAIN :)
To summarize, XEM is really trying to say f you BTC, I am going to part ways now. This coin has the potential to keep growing while the market even plummets just a little more! The green support level at the very top will be met again. If we see the black test line below the top green one, we could see a downfall, or a retracement back up.
So, the grey boxes are obviously also support levels. This is to help you guys IF there is a downfall to the coin. I would highly recommend entering this coin in 2-3 days. I also bet that BTC will have just a small downfall until next week and then we are seeing MASSIVE 100% profit.
I did this by the hour to show you guys when you would like to enter, also I stretched them out to predict what happens if it declines as I stated above!
Thanks! Cheers
Also, we are now offering mining programs, pump and dump calls (next one is in three days with 100%-200% profit), cryptonary's crypto course(explains chart analysis) , gpu multi card rigs, and selling antminer s9's for the low! Comment below if interested or...
message Cryptolerance on Instagram

[XEM] Soon the rebound ? The XEM registered for 2 months a very bearish trend compared to the BTC, we approach soon to an important support around 2400 Satoshi.
I think it is a good opportunity to increase its BTC quantity..
image.noelshack.com

NEM found a bottom?Coin of the day is NEM.
Nem was trading in the downtrend for recent time, and it seems that the coin has finally found the bottom at the 0.00003 level. Dive to the 0.00003 level still fit in the global uptrend, so it could be a good place to buy.
From the bulls:
XEMBTC broke above the Bearish Trend Line and pushed upwards from the 0.00003 support. Growing volumes support the bullish tendency. Potential profit if the bullish phase starts now is very high.
From the bears:
In comparison to the massive and consistent downtrend, the turnaround pattern should be much larger and significant. If this is the beginning of such construction, then the breaking of the 0.00005 resistance and 100-days EMA should prove it. Before these signs - the turnaround scenario sounds week.

BTC-XEM Double Bottom FormingAfter 8 straight down weeks, BTC-XEM could be bottoming, or even double bottoming. Lots of green volume down here. We'd need to finish the week green with a significant amount of volume to get better confirmation.

XEMBTC Flooredbounced off main support + downtrend over + bottom signal + RSI bottomed + Stochastic buy.
over 350% upside, small downside.

XEM/BTC SCALPING BUY ON SUPPORTXEMBTC
For BTC Market :
S1 0.0000287
S2 0.00002583
TP1 0.00003225
TP2 0.00003621
Buy on 0,00002969 area. If go below 0,00002868 then stop loss.

XEM risk off tradeIn my opinion XEM entered buy zone few days ago, 2300 zone is my lowest target for "BUY AREA", good luck, may the profits come with ya :D

XEM looking due for a run upXEM has been on quite a crash as of late losing over 80% of its value from the previous run up. The RSI is looking extremely oversold on the daily chart. The MACD histogram is starting to swing up along with the lines starting to cross. It looks quite similar to the last drop with the histogram. If that happens it should get up to about the .5 FIB. To be safe TP some in between .382 and .5 FIB.

XEMBTC - Green lights on DailySelling is exhausted and daily MACD and Stoch RSI are likely to head up in next 3 days.
We got the following target points, TP1 and TP2 have good chance of getting hit, TP3 is area to get out to minimize risk.
TP1:4250
TP2:4990
TP3:5660
