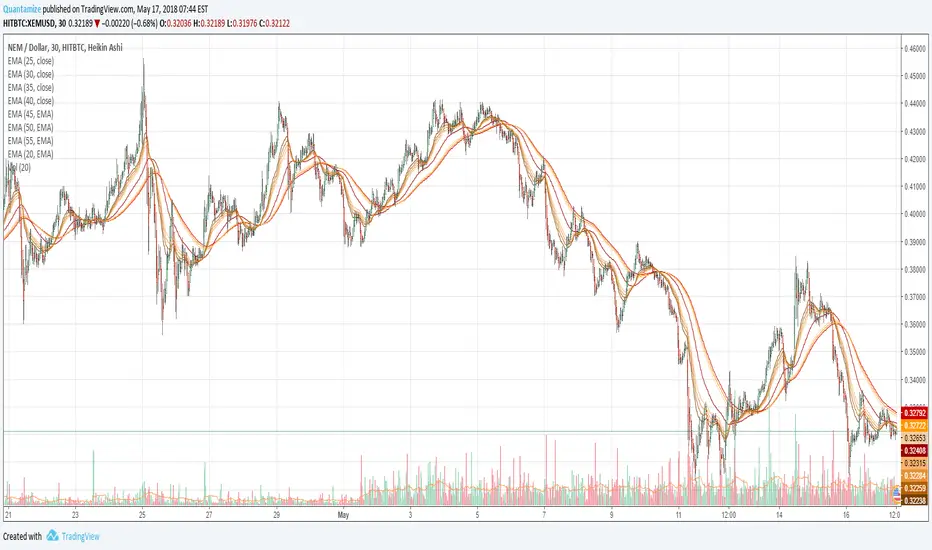
Poor NEM.With such pattern, and Bitcoin downtrending, will probably retest last big dip around 20cents (two targets for this 22cents and 18.5cents)
Such a shame but also good opportunity to tank cheap XEMs and hold in hope for other bubble in other times.
XEMUSD trade ideas

NEM recent technological improvement might skyrocket their priceNEM (XEM) was performing well in the 2017 and it has jumped almost more than 1000% form low of $0.15 till $2.06 (Jan 4th 2018 high). XEMUSD started to decline sharply from year high till $0.2068.
NEM has been best performing crypto in 2017 mainly because of unique technology. They use Proof of Importance (POI) instead of Proof of Work and Proof of stake. The POI network looks at three major things to determine importance of coin holder based on amount of XEM in your wallet, how long it’s been there and quality and number of transactions.
NEM is working on lot of technological improvements which will be skyrocket their prices in near term. The lot of recent developments in NEM will skyrocket.
NEM is set to release XPOS device with partnership with PundiX. NEM and PundiX has partnered in final quarter of 2017. These two are planning to implement digital currencies into retail industry. XPOS devices is initial device under their collaboration and NEM network is set to distribute these device for retailers. NEM have also announced Catapult, a new block chain based engine designed to present new version of NEM protocols and also known as mijin v.2.
NEM currently holds the 15th position on Coinmarketcap with market cap of approximately 2.4 billion USD and price is currently trading around $0.2700. The pair is expected to trade higher on account of Catapult announcement.
Technically the pair has taken support near $0.20 and jumped till $0.4560 (Apr 25th 2018 high). Any further weakness can be seen only below $0.20.On the higher side, major resistance is around $0.450 and nay break above will take the pair to next level till $0.5560/$.0.6400.
It is good to buy on dips around $ 0.2600 with SL around $0.2000 for the TP of $0.4500/$0.5500


Nem Machine Learning AI Crypto SignalThe rolling three-day signal for Nem (XEM) is "Don't Own". This is day one of the three-day signal. The signal will be updated again Friday. For further details or discussion, feel free to leave any questions or check out signature/profile.
Market makers...will be stupid if they will not create further scenario to fulfil formation like this. In orher case XEM wil visit lower low.

Crypto Challenge - NEM alertNem caught me by surprise here. There was a false breakout and then quite a spike back above the alert but I don't have conviction to take the trade so I don't. I don't want to start chasing it now. Might get a small retracement back to support. I use Heikin Ashi candles in my trading method as the default but I can also look at normal candles as well to see a different perspective. The market action is very undecided at the moment.
Only two open trades in the challenge demo which are XLM and TRX.

NEM Downside CorrectionNEM has reached the high at $0.46 and then formed a strong resistance at the 76.4% Fibonacci retracement level, which is $0.44. The resistance has been rejected for tree consecutive times suggesting the corrective move down.
XEM/USD first downside target is seen at $0.34, where resistance was formed back on the 20th of March. Second support is based at 23.6% Fibs, that is $0.27 and this is the area where the 200 Moving Average was broken. It is important to watch these resistance levels for either a rejection of a breakout, but only break and close below the $0.27 could be a confirmation of a downtrend continuation.
On the upside, clearly the resistance at $0.44 in general and $0.46 level in particular must be broken, with the daily close above it. In that case the uptrend is likely to continue and could result in exponential growth.

NEM alertMy NEM alert went off but again this is against my anti chasing rule. I will show when I get a valid setup on a crypto on my watch list. I might do a demo account for a short time to show how my method works. I don't like to trade demo too long because it can interfere with my real trading.

XEM/USD turned to the downside againThe crypto has found a very strong resistance at the median line (ML) and now goes down again. The false breakouts followed by the failures to retest the ML have signaled an exhaustion and a potential drop. XEM/USD slipped below the lower median line (LML) of the ascending pitchfork. A retest followed by an important drop below the 0.35471335 support will give us a great chance to sell this on the short term

XEM/USD ReversalNEM/US dollar reversal is in sight. Wave count reveals that the pair has completed a five wave down. It appears to be in the latter stages of base building. Key level to take out of 0.50. Breach of this resistance would jumpstart a bull run.

False breakouts.Chance that next breakout will be succesful are always higher than prevois breakout. I hope that last bearish will be not fulfiled and XEM will build fast "five" (5th wave).


Will NEM (XEM) Maintain Its Undercover Status?NEM (XEM) is known as a dark horse in the crypto community and for good reason. Despite its position as the 14th largest coin by market cap (which used to be a lot higher), very few investors actually know and understand what this cryptocurrency is all about. The coin owes its rankings to an ever increasing interest from Japan. According to Coinmarketcap.com, XEM/JPY pair accounts for more than 40% of its trade volume. Next in line is XEM/BTC at 15% and XEM/KRW at 12.5%. This means that a combined total of more than 67% trade volume is from Asia.
Read Detailed Anaysis Here: cryptodaily.co.uk

Ascending Triangle in XEM chart.I can see ascending triangle in XEMUSD 1 hour chart.
Now wait reversal and break up this triangle soon.

Intresting how XEMUSD will react...for this targets, if this formations will be fulfiled. I publish it just of curiosity, as longs are in this situation not possible to scalp or midterm playing long too, so i stay aside and observe.
Not a trading advice!

XEMUSD Potential Bearish Shark (PRZ 1.90 to 2.35 Level) - April XEMUSD maybe forming a Potential Bearish Shark that aims to be completed between 1.92 to 2.35 level.


Waiting for signal to get some scalp.This signal should be given today if the chart (1h and 15m) will create one.

The scalping of triangles...should look like this - when entry point is signal from 1h laguerre higher than 60 (for long position) with 0.3 parameter, combined with positive signal from Alligator lines (my set is 24,12,4). Blue rectangles are areas where occur good circumstances for long positions - grey rectangles in contrary say: stay aside from taking position. Targets for entries should be estimated after finding price formation on chart (triangles are best, but there is few others of course).
The same strategy i use for scalping forex pairs like EURUSD, GBPJPY, AUDNZD and CADCHF - so far so good, only one problem is that health and nerve system can be crushed when You trade like this constantly - that's the price. In forex however any longterm strategy is (form me) imposible to use and earn - in contrary to Crypto market.
In case when market not fulfil formations 100% maybe good idea is to cut expectations by 10% - if you have target 6 cents (like it was in XEMUSD last case), cut it to 5.4cents. As i observe markets long time i see that "cutting target by 10% of the whole expected move" gives more profitable positions - especially before strong pullbacks after some trend.

Entry should be around 40cents...with scalp target around 47,5cents
Not a trading advice! Dont look also at Strategy report below, it is used by be only for orientation as Laguerre indicator!
