NEM (XEM) Rises As Coincheck Commences Refunds
Take a look at this beautiful chart for XEM. Each candle represents a 4-hour time segment. As you can see, it is moving upward on a tight channel (cyan) that began on around March 10th. Previously to that, it was also moving upward on a channel that began somewhere around March 6th-7th. At this moment it is completing the 3rd wave of its current Elliot Wave impulse rally. This coincides with the intersection of the (cyan) channel's support with the (yellow) channel's resistance. This could mean a premature correction that could prevent us from reaching our target of $0.50 due to a lack of momentum (specially when you consider the current region of the Keltner Channel (blue) that XEM is currently cruising within. On top of that, it's clear that we are far above it's EMA(55) and a retracement is due. Retracement once full Elliot Wave correction is completed should coincide with a fib level, and in this particular case it seems to me like it'll retrace to 50% to coincide with the bottom Keltner Channel for healthy movement as well as with the support of the (yellow) channel. The RSI is also showing we have recently entered overbought territory and this should also trigger a sell-off from the bears.
***This information is not a recommendation to buy or sell. It is to be used for educational purposes only. it should not be considered financial advice***
XEMUSD trade ideas


So far so good...We predicted this bullish scenario for XEMUSD on March 8 and we hope you saw our buy signal. You can take partial profits now. Daily signals for our members at www.totalbitcoin.international , stay tuned...

This one could go up 10%Everything in red right now but this one always give a good fight, it is clear that it is the favourite for certain type of investors out there. Back in december lows but when the market recovers, or even tomorrow, this one has great potential of another 10%-20% before keep sinking.

$NEM Nearing BottomAfter all the FUD begins to settle we will be seeing continuation.
We just finished the ABC retrace out of the previous market cycle and landed back on support of the 1 wave.
This is a classic .88% retrace which is familiar inside altcoins.
Oversold on the 12hr RSI.
We need to see how prices react to the .88 but overall im bullish.
If we fall lower than the .88 a full retrace will be likely.

NEM is bought by institutionsThe price of the "NEM" coin (XEMUSD) today came to a strong support level of $ 0.32, which was tested last year and the price after that began an upward movement. The graph shows that near this level, trades are held at very high volumes. Probably this is connected with the recent presentation of "NEM" technologies at the BIBSummit Banking Summit. The presentation said that the technology can be combined with the existing business model to address the most "painful" areas with which it faces the banking sector.
Now XEMUSD is trading above the support level of $ 0.32 and the technical indicators are forming a divergence, which should be seen as a reversal signal a good opportunity for a speculative long.
On the other hand, for long-term investment, one can look for projects that have been recently listed on the exchange. I actively watched how to start trading on CREDITS and their results look promising. It is worth looking at this project.

What's next? Lesson from the past.I think this downtrend tend to be much longer. But how long will last?
Let's see the last deep correction (much deeper than 60%) of XEMs bubble in the past, and RSI indicator behaviour (in second half of 2016).
What we need on XEMUSD chart now is much more divergence on RSI. For now there is no divergence so it should be created by market players. It should be accumulation phase before new bubble scheme.

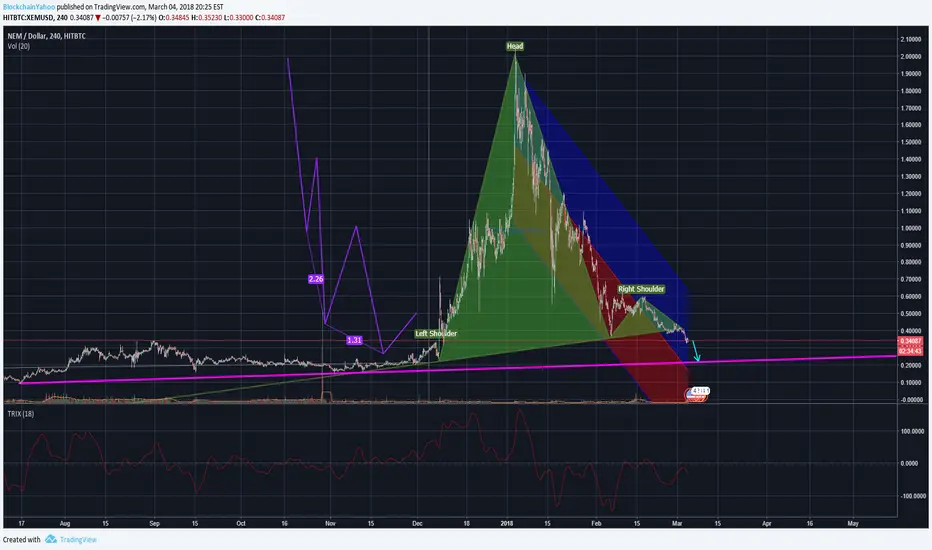

NEM dollar 3push down complete...but still think it has two moretwo more drops to the 20cent zone should bake the cake

XEM - NEM could give us another 50% drop easy...I will go long this at that time...make sure to follow as I will be updating this TA until then...

lets try 0.6.. no lower in short term1st objective 0.6
+nice support in 0.35
+triple bullish divergence in macd histogram
+bullish divergence in macd
+bullish divergence in RSI


NEMUSD Bottom Buy Setup!!!!NEM is backing by a good project team and their use cases are pretty interesting, These days they are making partnership with many entities worldwide. Try to be part with it . We can see a down headed cyptoworld since last December. Most of them are due to regulations as well as unnecessary FUD, as my point of view. But don't be forgot be the part of this good opportunity. Good Luck!!!

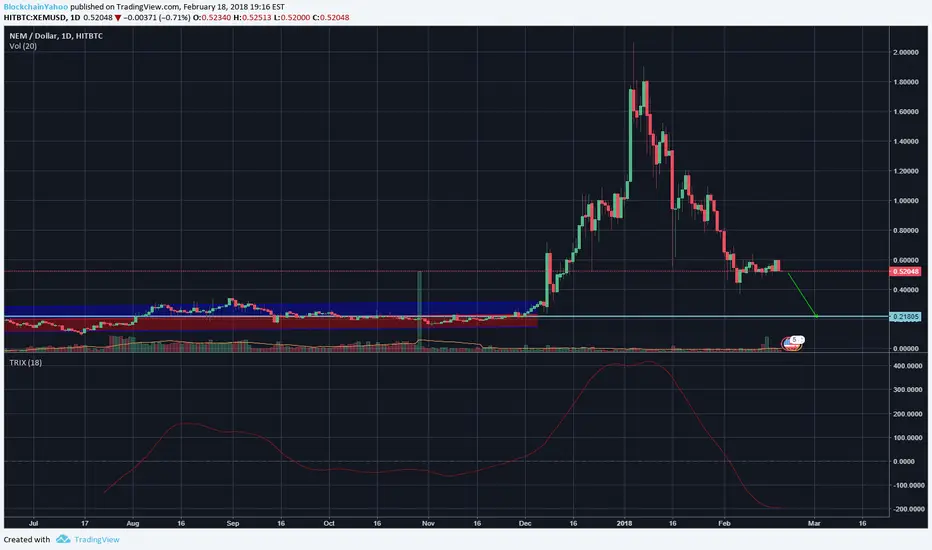
XEM/USD Buy OpportunityHere we are analyzing XEM/USD on the 1D chart.
NEM is currently trading around $ 0.54. The one-year forecast of the cryptocurrency is around US$ 0.86.
I suspect that XEM/USD will likely retest this side-wards support level before an up move. If price breaks below this level, there could be a retest of the lower horizontal support at $0.32 in the longer term before the upside. I hope we do not see the second scenario.
This means, from the present prices it is still offering a decent upside of 60% in this very calendar year. In the pending 10 months, the return of 60% is good enough. When you look at the five-year forecast of the cryptocurrency, it is around $ 1.65. Thus over a period of 5 years as well, it provides plenty of upside.
While on the whole, these predictions might look a little bleak but when you take into account the strong application of the platform which it is developing, it would provide you with good returns and stability in your portfolio. Also, it is a good diversification option considering the fact that the platform is finding increasing takers.
The last 24-hour trading volume is currently about $93,416,200 with a circulating supply of 8,999,999,999 XEM out of a max of 8,999,999,999 XEM .
Dont forget to follow if you want to be informed ;)

Longterm NEM/XEM viewNEM/XEM is a good coin for longterm holding. Should be accumulated at area around 50cents (25%-33% of planned money to invest), 20-30cents area (25-33%) and at around 10cents (50-33% of planned money to throw in). Problems with recent coinchecks hack, and generated from other exchanges (having like bittrex problems with going online with deposits, they are so lazy to change their wallet to multisignature and introduce mechanism to not receive stolen XEMs) giving a good chances to get XEMs so cheap as possible. First goals after accumulation phase (i think this phase should be to april-june 2018) is target around 4$ or little higher. In wider longterm period (1st Q of 2019) the goal for XEMs quoting in USD is around 60$ (no it's not typing mistake 60 american dollars!). See You in the future, dont forget to buy this tickets, before another one ride to the stars;)

XEM trading setup
We broke out from resist lines and backtest it, now its time to make profits, targets are 0.382 and 0.618 retracements, good luck traders!

XEM/USD (NEM) Poloniex - Buy $0.5133 >>> Target $0.7700Market = Poloniex
Buy - $0.5133
Take Profit - $0.7700 (+50.01%)
Target = +50.01%


XEM/USD Cryptocurrency Markets Haven’t Stabilized YetHere we have XEM/USD on the 4H chart.
The past two to three days have been somewhat positive for most cryptocurrencies as ETC/USD, LSK/USD in existence. After a terrible weekend and start to the week, most markets have reclaimed a lot of lost value. We are still months, if not years, away from seeing new all-time highs across the board. NEM is one of the few altcoins to have lost value relative to both USD and BTC in the past 24 hours.
As we can see the current NEM price dropping below $0.55 again, things are not looking all that impressive. Even though the NEM price reached US$0.60 following the massive dip to US$0.40 a few days ago, things are now starting to head in the right direction.
I am expecting XEM to get back up to the higher levels soon but slowly.
Bare in mind, that
Now we are seeing a minor NEM price correction, there is a new buy opportunity for cryptocurrency holders looking to diversify. Bare in mind that NEM rise hit an all-time high of US$1.90 (03-01).
Dont forget to follow if you want to be noticed

next 3days will show ushi all
it looks neutral but after 3 days we will know the clear direction
on weekly it still bullish
