XEMUSD - 5th WAVE IS COMINGGood support at 19-22c...
After this accumulation period, XEM might reach 43-48c (mid-January expected) before a health correction (waves A B C).
XEMUSD trade ideas

NEM is undervaluedXEM formed price channel and broke out falling wedge . The price can have the growth like the height of the wedge , the previous wedge was ended in the same way . So I expect price about 0.4 $


NEM near the breakout, buy for 50% profit?NEMUSD price is in a symmetric triangle, near the breakout. Buy on breakout or on the support for a target of 50%+

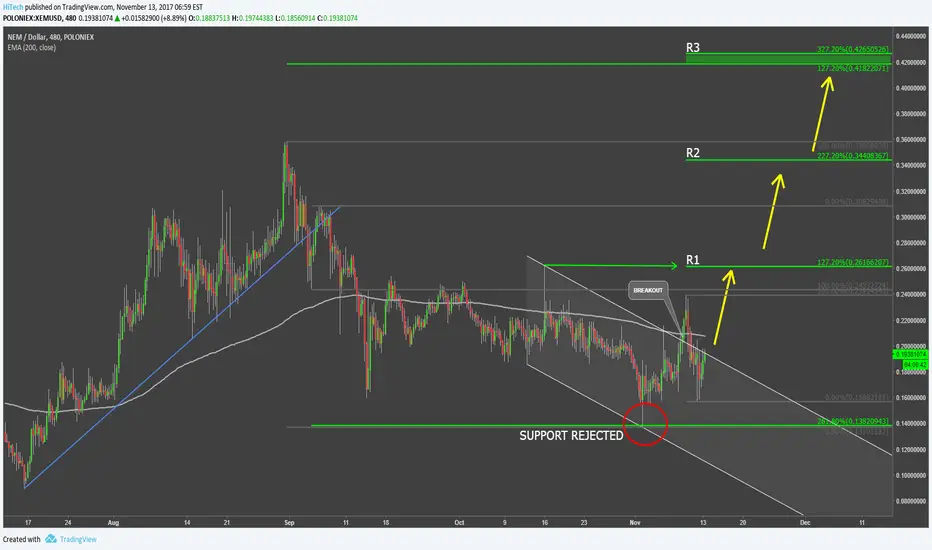
NEM Does Look PrettyAfter a strong correction from $0.358 down to $0.138, with a total loss of 60%, NEM finally found the support at 261.8% Fibonacci retracement level applied to the corrective wave after the uptrend trendline breakout.
Further, XEM/USD broke above the descending channel as well as 200 Moving Average. These are pretty strong signals of a potential end of the corrective wave and continuation of a long-term uptrend.
Upside targets are based on Fibonacci levels applied to the corrective wave after the descending channel breakout. First $0.26, second $0.35 and final and the strongest upside resistance at $0.42 area, that corresponds with two Fibonacci levels.
A move lower than $0.138 would invalidate this forecast and could result in the continuation of the downside correction or a consolidation.
NEM-XEM trading idea setting up for DecemberXEM is launching it's 2.0 version at the end of December. In large falling wedge since June on BTC chart! Obviously, the price has seen a reversal in USD based on BTC going banana's. A trend reversal can occur at any moment
( new money flowing into the market ). It has found some support at the current level. Hence I left the entry point broader. My personal opinion we will see a little more down supported by ( DMI, PHOENIX, RSI, STOCH RSI ). In general, we could set ourselves up for a good trade come end 2017- beginning 2018.


XEMNEM's VP Jeff McDonald will be speaking in FinTech Conference in Seoul on Nov 30 to Dec 1, 2017 with Google, IBM, Microsoft, and many more.


Is new moontime here possible?After bigger volatility, i see here some accumulation behaviour on the chart. Only question is when the moontime come, or from which level, from now on, or from lower levels? I dont know this, noone can know this (beside pumpers of course).


NEMNow is a great time to open a buy order.
The RSI oscillator is slightly higher than 50, the stochastic RSI and MACD makes the cross up.
Buy 0.185
Target 0.24
Stop Loss 0.17

Nem coin great option to invest for a long termNEM uses PoI, also known as proof-of-importance. This means that (unlike Bitcoin and Ethereum), NEM is environmentally friendly, and more secure. Unlike mining Bitcoin and Ethereum, network upkeep does not require hundreds and thousands of electricity-hogging mining machines.
A NEM node can be run on a computer as simple and cheap as a Raspberry Pi, which is only $35 and takes up very little electricity.
NEM is also superior in security. It uses EigenTrust++ for node reputation, which is not used in any other cryptocurrency, and strengthens the security of the network considerably. It also uses localized spam protection, which shuts down spammers, and only the spammers, when the network is at full capacity. Both are only found in NEM.
NEM was built with a two-tier design in mind as well. If you want a wallet, you don’t need a full node and a copy of the blockchain. Instead, you can just connect to any node, and have access to all the same features without trusting it.
The price went down in the last 3 days from 0.19 to 0.179 and it's a great moment to buy cause as you can see in the graph it shows that the volume is increasing will take time to reach $1 but can rise to 0.30 in the next 2 weeks what will increase your investment by 50% for the long term can rise by more than 5000%

XEM buy opportunitywatch major support and resist lines for buy/sell orders, take profits at t1 t2 or t3 levels, good luck!

NEM: will be parabolic with a catapult?Guys, I revised the chart scaling.
Firstly, I want to say that the long-term trend line coincides with the 1x8 angle and it holds and this is a good sign.
Secondly, I see signs of the beginning of a new cycle.
I've already seen a similar chart somewhere and this is a BTC chart before he started parabolic growth.
Congrats to all in NEM/XEM, I think that you made a very successful long-term investment!
As for the bearish scenario, yes indeed such a probability exists.
Look at the chart, where you see the support below? ~10 cents, right?
What should happen with the top10 cryptocurrency to lost about half of the capitalization?
Of course in the cryptoworld anything can happen, but I personally think that such a probability is not high.
Trade at your own risk.

NEM. Very interesting chart.Very interesting chart.
perhaps there will be a reversal, and perhaps there will be a fall to 0.10.
A lot depends on which candle is next.
I will definitely update tomorrow. Perhaps earlier. Happy Trading

XEM: The next big thing in cryptocurrenciesXEM/USD sitting on a long-term support.
I personally believe that buying XEM around 16c is like buying BTC around $800.
Buy as much as you can.
Trade at your own risk!

NEM / $XEM: Good buy opportunityThere are several signs $XEM is a good buy opportunity.
Low RSI.
Below Moving Average
Heading to strong support.
Time for an uptrend...

NEM SIDEWAY TRADINGNEM is in side way for more one month, this situation makes hard to trade but fortunately we have two way to trade
For those short term buy around @0.16571500 and sell around 0.23820450
For those longterm buy around @0.14566140 and sell around @0.2439788
