NEM Range Trading After RallyFollowing the previous idea , NEM went up as was expected, although it broke above our targets and now the question is what will happen next. First of all, looking at the extended Fibonacci retracement levels based on the previous analysis, 627.2% level at $0.67 has been rejected cleanly and straight after, XEM/USD went down towards 227.2% support level at $0.35.
Currently, Nem is trading at $0.44 and while resistance and then support has been rejected a range trading can be expected. The price range should stay between $0.344 support and $0.591 or $0.673 resistance levels.
It seems that re-test one of the resistance levels would be logical after strong correction and then the resistance levels must be watched for either a breakout of rejection.
XEMUSD trade ideas


XEMUSD Trend AnalysisXEM is the #8 on coinmarketcap, recently just passing Monero!
Japan has recently just started to implement this crypto currency.
I see a wedge pattern, with a high probability of a breakout to a new high.
Recently we have been seeing newer highs as the days close by, in my opinion it is just a matter of time before it breaks off into a newer high.
You could go for a quick trade here, or holding for long term reasons might not be a bad thing either.

breakout above .46 will indicate uptrend continuation $XEM $BTCbreakout level at .46 confirms uptrend $XEM

NEM getting ready to make the Jump at the dollar club!NEM has seen a bullish trend since it has hit the market. We have a strong long trend outer line holding solid as well as the Inner trendline. In the current clear breakout, we are in the middle of a small retracement to the 786 levels. Expect either a clear breakout or a small ranging fight between bears and bulls both with optimistic results for Targets. Be careful about main pivots.

XEMUSD - 5th WAVE IS COMINGGood support at 19-22c...
After this accumulation period, XEM might reach 43-48c (mid-January expected) before a health correction (waves A B C).


NEM is undervaluedXEM formed price channel and broke out falling wedge . The price can have the growth like the height of the wedge , the previous wedge was ended in the same way . So I expect price about 0.4 $


NEM near the breakout, buy for 50% profit?NEMUSD price is in a symmetric triangle, near the breakout. Buy on breakout or on the support for a target of 50%+

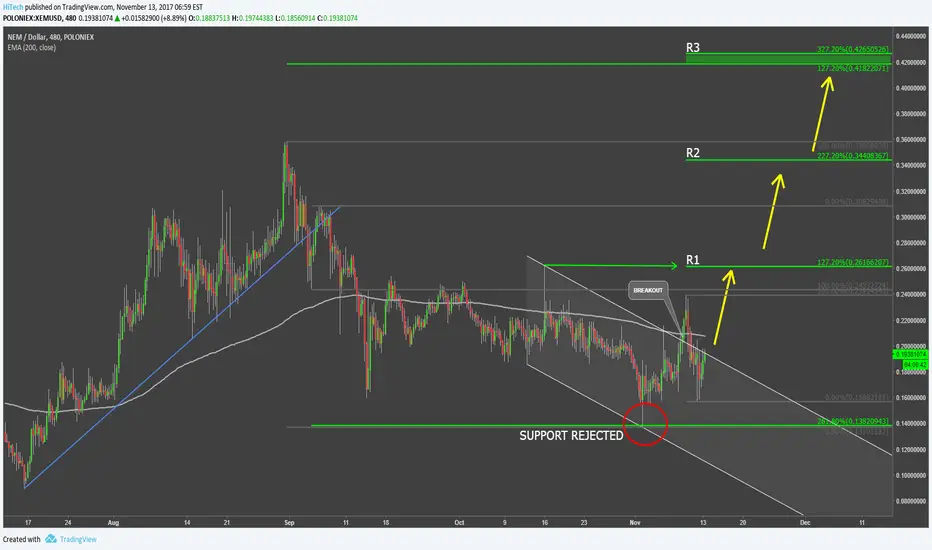
NEM Does Look PrettyAfter a strong correction from $0.358 down to $0.138, with a total loss of 60%, NEM finally found the support at 261.8% Fibonacci retracement level applied to the corrective wave after the uptrend trendline breakout.
Further, XEM/USD broke above the descending channel as well as 200 Moving Average. These are pretty strong signals of a potential end of the corrective wave and continuation of a long-term uptrend.
Upside targets are based on Fibonacci levels applied to the corrective wave after the descending channel breakout. First $0.26, second $0.35 and final and the strongest upside resistance at $0.42 area, that corresponds with two Fibonacci levels.
A move lower than $0.138 would invalidate this forecast and could result in the continuation of the downside correction or a consolidation.
NEM-XEM trading idea setting up for DecemberXEM is launching it's 2.0 version at the end of December. In large falling wedge since June on BTC chart! Obviously, the price has seen a reversal in USD based on BTC going banana's. A trend reversal can occur at any moment
( new money flowing into the market ). It has found some support at the current level. Hence I left the entry point broader. My personal opinion we will see a little more down supported by ( DMI, PHOENIX, RSI, STOCH RSI ). In general, we could set ourselves up for a good trade come end 2017- beginning 2018.


XEMNEM's VP Jeff McDonald will be speaking in FinTech Conference in Seoul on Nov 30 to Dec 1, 2017 with Google, IBM, Microsoft, and many more.


XEM - LONGHey guys,
I am lurking here for quite some time and felt like adding some - hopefully - valuable input to the community. I have analyzed the NEMUSD Bittrex chart according to:
1) Overall trend analysis
2) Bollinger Bands
3) ROC
4) RSI
5) MACD
6) Fibonacci waves
Analysis:
Well, the overall trend of the NEM token is bullish. It just hit the bottom of the channel / resistance line and shows momentum to increase again. At the very same point the line also touched the lower Bollinger band which is an indicator for a low. From this point the price could increase to the upper point of the Bollinger band, which happened a good week later.
The ROC (especially the buying points) just touched the yellow line on Nov 18th (buying signal) and is still far away from a selling signal. This can also be seen on the RSI which is still hovering around the purple zone and the trend of the RSI is upward sloping as well (yellow line) and hasn't reached the upper end of the purple channel yet - so there is no fear from overselling yet.
The slower moving average line (blue) of the MACD crossed from below the red line and gave a buying signal around Nov 18th as well.
Last but not least if we look at the channel the line is currently hovering around, then we can see that this pattern is actually nearly an ideal Fibonacci wave situation. The price spiked and fell back in wave 1, then decreased to the resistance level of the lower trend line of the channel, before it got momentum and increased to it's ATH at wave 3. Just now we left the low at wave 4 behind us and are about to fly to new highs. In an ideal world, the price should now go up and touch the upper trend line around 0.40-0.41.
Hence the price target for NEM should be set around 0.40-0.41.
Thx for reading guys!


Is new moontime here possible?After bigger volatility, i see here some accumulation behaviour on the chart. Only question is when the moontime come, or from which level, from now on, or from lower levels? I dont know this, noone can know this (beside pumpers of course).


Another wave of fools/dumb money in BTCUSD...... so here without huge fundamental info, the price probably will slide deeper (after break of the orange line). Price target for this drop is around 8cents but spikes can be of course deeper than that. Fools/dumb money jump in the last stages of pump @ BTC, some of them will dump before owned altcoins - just like XEM. It's so pathetic:)
