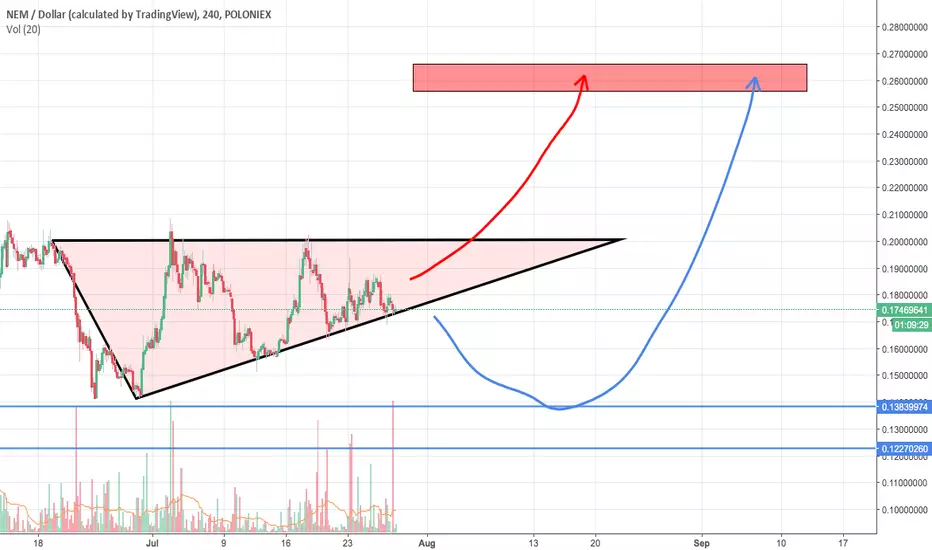
XEMUSD IN DOWNWARD WEDGE - HUGE PUMP TO COME - CryptoManiac101XEMUSD TRADE
Enjoy this trade advice my Crypto Maniacs, but remember to invest only what you can afford to lose or you're going right back to poverty on drop. We are not your financial advisors.
XEMUSD trade ideas

$XEM usd pair EWI did a XEM -2.55% btc 1.01% pair today and said maybe it will have one more leg down but when I saw this...looks more bullish than btc 1.01% pair

XEMUSD Dont miss this long Hi there, Dont miss this long.
Watch bottom for long.
Good luck.
Please support the setup with your likes, comments and by following on TradingView thanks


Target hit. Channel Down continuation. Short.TP = 0.12059 hit as XEMUSD broke the Falling Wedge to the downside and appears to be extending eventually the commanding trend of the 1D Channel Down (RSI = 26.153, ADX = 74.761). XEMUSD is near 12 month lows hence the low pace (MACD = -0.016, Highs/Lows = -0.0192, B/BP = -0.0408), indicating that a bottom (short/ medium term) may be near. If 0.08810603 breaks we will resume shorting (TP = 0.060).


Falling Wegde on 1D. Short.XEMUSD is on a 1D Falling Wedge (RSI = 30.672, MACD = -0.008) that is dropping towards the 0.11087 December 07, 2017 bottom on a very steady pace (Highs/Lows = -0.0168, B/BP = -0.0249). We are short on this crypto, TP = 0.12059.

NEM XEMXEM/USD correction from ATH-price is more than 90%(lose). NEM Has very nice buy-zone( 0,9 - 0,15 ) for long-term position.

NEM (XEM/USD) declined, but looks very promisingNEM has lost almost eight percent in the past 24 hours. The currency pair followed its rivals on Tuesday and declined significantly. However, I’m far from thinking that this downtrend will develop as there is no fundamental reason for this.
NEM reached the support area at $0.1561 on Tuesday and stopped there. I think it is time for an upside correction at least. The currency pair is close to its monthly lows and has almost no room for further decline. Moreover I believe that this downside momentum is temporary.
My current target is at the resistance area at $0.1883. I think the currency pair is likely to reach it in the couple of days.
Checkthe full crypto analysis HERE>>> .

NEM (XEM/USD) the rocket is still on the groundNEM follow its allies as there is no clear direction currently. The currency pair remained in flat during the weekend and fluctuates in a very narrow range in the moment of writing.
As for the current situation, I believe NEM is likely to start the uptrend again. The currency pair is close to the support area at $0.1729 and t5his support is strong. Buyers, I think will resume their attack from there.
My target is at $0.2082 resistance area. However, XEM/USD will have to break through the resistance area at $0.1883 before going there.
Check the full crypto analysis HERE>>> .

XEMUSD... up or downhey traders im very confused about XEM entry point here is an ascending or a symmetrical triangle or some like that. to me price will go down watch the break point
comments and likes are welcome
XEMUSD 8% potential in 12 hours| bounce on symmetrical triangleXEMUSD seems to have found an ascending support line within the symmetrical triangle that it keeps bouncing on. XEMBTC seem to be holding very well today opposed to most alts out there.
A tight stop loss bellow the blue line is suggested.
DYOR

NEM (XEM/USD) resumes the uptrend as there are almost no obstaclNEM looks very promising on Thursday. The currency pair had a downside correction on Wednesday and seems to resume the uptrend currently. Bears have almost no chances as they lost control over the market.
NEM Has almost reached the resistance area at $0.1883. The uptrend seems to be resumed and my targets are still the same. I believe XEM/USD is likely to reach $0.2082 in the nearest future. There are no candlestick patterns currently, but I see HL which means the currency pair goes upwards.
Check the full crypto analysis HERE>>> .

NEM (XEM/USD) so far so goodNEM has added almost five percent in the past 24 hours, but the currency pair is still far from reaching my targets. The downside correction is done and XEM/USD is likely to resume its uptrend in the next couple of days.
XEM/USD is trading above the support area at $0.1729. The currency pair aims at the closest resistance area at $0.1883. I think this is the closest target for Wednesday. However, as you can see, my rocket is well above this level. I believe NEM is likely to go there in the nearest future.
The correction towards the support are at $0.1729 is also possible, but if it happens, it won’t be the trend breaker. Moreover, I think that this correction has only 10-20 percent of probability.
Cehck the full crypto analysis HERE>>> .


XEM/USD U-Turn Is On The WayI have set my bullish targets lower as NEM develops a deeper correction frustrating my expectations. Anyway, I think that we will see some interesting events in the next couple of days. So stay tuned and follow the chart situation.
XEM/USD has reached my targets in the beginning of this week, but reversed later and started a correction. Anyway, my main trading idea is the same. I still believe that the currency pair is likely to resume its uptrend. However, I expect the price to touch the support area at $0.1729.
As for my bullish targets, I think NEM is likely to reach the resistance level at $0.2082.
Check the full crypto analysis HERE>>> .

XEM/USD Two Shooting Stars In A RowNEM added some percents in the past week and the currency pair looks very promising currently. I think that it may skyrocket in the nearest future, but still needs some gas to start off.
NEM has reached the resistance area at $0.1909 but retreated from there as bulls were unable to break bears’ defensive lines. I see the Shooting Star candlestick pattern, which makes me think of a downside correction before the price will go higher. As for the targets, the first one is at $0.1446 I think, but the general for midterm is at $0.2640.
Cehck the full crypto analysis HERE>>> .

XEM/USD Huuuuuge move. Trend must go on!I like NEM for its correlation with big players like Bitcoin. The currency pair has made more than eight percent in the past 24 hours. XEM/USD was volatile on Tuesday-Wednesday and I think there is enough gas in its engine to develop its flight. Investors are hungry for new gains and I think they have waked up to make some significant achievements.
Anyway, I remain bullish in this situation. I think that NEM is going to make a short break there in order to gather more buyers before this rocket will continue its flight. I also think we need to test $0.1883 before going any higher. This is not necessary, naturally, but according to technical analysis, correction is needed here.
My next target is set at $0.2248. It is far from here, but I like it. I like those huge moves and I think we are going to reach it in the next couple of days. However, remember that bears are also no sleeping now. Be careful in those twisted investing paths.
PS. If you asked me, when Lambo, I would say “After to the moon” Take care guys and follow my reviews.
Check the full crypto analysis HERE>>> .

XEM/USD Bullish MoodsNEM has added more than nine percent in the past 24 hours. The currency pair looks very promising and follows the allies. Buyers seem to have full control over the market and they are able to reach new tops on Tuesday-Wednesday.
XEM/USD has jumped over the resistance area at $0.1682 and went higher on Monday. However, NEM failed to reach the next resistance at $0.1873. The currency pair stays below this level in the moment of writing.
The main trading idea for XEM/USD is bullish scenario. We think that XEM/USD is likely to jump over the closest resistance area at $0.1873 in the nearest future and target the next resistance at $0.2002, where July highs lie.
However, bears are able to start a correction, which target is at the closest support area at $0.1682 at least.
Checkthe full crypto analysis HERE>>> .

XEM/USD Upside CorrectionThe currency pair failed to reach June lows and went upwards during the weekend. NEM has added more than two percent in the past 24 hours. XEM/USD is likely to develop its bullish correction in the next couple of days.
XEM/USD has tested the support area at $0.1539 but failed to declined further and retreated. The currency pair went upwards but failed to test the resistance area at $0.1682 as well. We have a clear bullish Flag pattern, which may be sign of further growth.
We have set bullish targets at the resistance area at $0.1873 for the next couple of days. This is the main scenario according to our view.
Check the full crypto analysis HERE>>> .

XEM/USD Clear Bullish HammerThe currency pair reached another support area and stopped there. XEM/USD seems to start an upside correction. NEM has lost more than four percent in the past 24 hours but bears are out of power to push it lower.
XEM/USD tested the support area at $0.1539 and retreated from there. The price has formed bullish hammer and seems to target the next resistance area at $0.1682 at least. We think that there lies the first target for NEM.
The second tier is higher at the next resistance area at $0.1873. As for bearish scenario, it is les probable but sellers can retest the support area at $0.1539.
Check the full crypto aalysis HERE>>> .

XEM/USD Bearish FlagNEM has lost almost seven percent in the past 24 hours. The currency pair has broken its uptrend and seems to target June’s lows. Bears control the market currently and are able to develop their progress.
The currency pair went downwards on Tuesday and retreated from $0.1873 area. XEM/USD reached the next support at $0.1682. It fluctuates there in the moment of writing. We have a clear bearish Flag meaning sellers are ready to develop their progress.
As for the scenarios, the most probable for the nearest future is decline towards the next support area at $0.1539. The price is able to reach it on Wednesday-Thursday. Bullish scenario is less probable, but if buyers take control, they will be able to drive XEM/USD towards the resistance at $0.1873.
Check the full crypto analysis HERE>>> .
