XEM/USD Bulls Control MarketNEM looks bullish as the currency pair reached our targets on Wednesday. The currency pair more than five percent in the past 24 hours. XEM/USD still moves along the ascending trend line.
The currency pair reached the resistance area at $0.2002 on Wednesday but failed to jump over it. NEM reached the ascending trend line later and jumped off it. We have a Doji candlestick pattern meaning bulls are able to drive the currency pair higher. The signal is confirmed by the trend line. This is the main scenario. The target for growth is at $0.2121.
As for bears, they have lost momentum, but their closest target is below the ascending trend line at the support area at $0.1873.
Check the full crypto analysis HERE>>> .
XEMUSD trade ideas

XEM/USD Bears Menace Uptrend?NEM Started its correction on Tuesday and the Flag pattern was broken. XEM/USD loses almost nine percent in the past 24 hours. The currency pair tests the ascending trend line menacing further growth.
The currency pair has broken through the support area at $0.2002 and moved lower. XEM/USD reached the next support at $0.1873 later. It is close to the ascending trend line as well. We think that EOS is likely to stop its correction in the nearest future in order to resume the uptrend.
The closest target for the uptrend lies at the resistance area at $0.2002. We think that XEM/USD will be able to reach it in the nearest future. However, we also think that the growth will not be limited by this level.
This is the main scenario. As for the alternative, XEM/USD may develop its downside correction, targeting the next support at $0.1682.
Checkthe ful crypto analysis HERE>>> .

XEM/USD Forms Bullish FlagEOS is the winner? Forget it! NEM is the winner of Tuesday as the currency pair has managed to add 16 percent in the past 24 hours. Do you remember the last time NEM had such a huge growth? The currency pair has broken through several resistance areas and is consolidating currently. The price looks like a viper, ready to catch its new victim.
XEM/USD has reached our targets and managed to move even higher on Tuesday like Stakhanov (famous Soviet miner, who exceeded plans several times and was Soviet Hero). The currency pair jumped over resistance areas at $0.1873 and $0.2002. XEM/USD consolidates in the moment of writing, but we have already drawn a Flag pattern meaning the currency pair is able to develop its growth again.
As for scenarios, NEM still has fuel to grow. If Flag is true, the price will target the next resistance level at $0.2121 at least. However, we see XEM/USD to reach even higher levels at $0.2234 in the nearest future. Do not forget that XEM/USD is able to test the current support area at $0.2002.
Check the full crypto analysis HERE>>> .

Sorry NEMbut this downward move can be stoped only in minimun 3-4cents area. I'am very "sorry" (in fact i'am glad because of incoming load of cheap XEMs from losers - welcome to the jungle), i dont wait even for 18, 16, 13, 10 cents. I want have it CHEAP!:)
Of course there should be some bounces from mentioned levels like 10 cents, but You know - this market is sheeps market. Sheeps must be slaughtered before new bubble somewhere in the future.
In XEMBTC chart XEM should visit 800-1000sat area (with some bounce from 1800sat).

XEM/USD Develops UptrendNEM’s buyers celebrate Facebook administration decision as well. The price jumped off local lows on Saturday and went upwards. The situation changes to bullish as NEM looks promising.
Having a closer look at the Hourly chart we can see that the currency pair has crossed the resistance areas at $0.1529 and $0.1682. XEM/USD is likely to move towards the next bullish targets at $0.1873 where we have placed our green flag. This is the main scenario for the nearest future.
However, if XEM/USD falls below the current support area at $0.1682, there will be a probability for NEM to reach the local lows at $0.1459 again (the sellers need to jump over the closest support at $0.1529 in this case).
Check the full crypto analysis HERE>>> .

XEM/USD No Significant ChangesNEM has lost almost four percent in the past 24 hours. The currency pair remains neutral in general as the local lows still hold the price. XEM/USD is above the descending trend line, but buyers are unable to change the situation in their favor.
Looking closer at the Hourly chart we can see that the price has followed the red scenario on Thursday and Friday. After testing the resistance at $0.1539, NEM retreated and reached the support at $0.1459. The possible scenarios for XEM/USD are the following:
1. Red scenario (bearish). The currency pair will break through the support area at $0.1459 targeting new lows.
2. Orange scenario (neutral). NEM is going to stay within the current range between the support at $0.1459 and the resistance at $0.1539.
3. Green scenario (bullish). The currency pair will break through the resistance at $0.1539 targeting the next resistance at $0.1682.
Check the full crypto analysis HERE>>> .

XEM/USD At CrossroadsThe currency pair remain almost unchanged in the past 24 hours. There is no trend currently on the Hourly chart as NEM is consolidating. The price is above the descending trend line.
Let’s look closer at the Hourly chart and the price. NEM has tested the resistance area at $0.1539, but failed to jump over it and stays close to this level in the moment of writing. The possible ways for XEM/USD are the following:
1. Red scenario (bearish). The currency pair will decline towards the closest support area at $0.1459. We think that this is the most appropriate scenario for Thursday.
2. Green scenario (bullish). XEM/USD will jump over the resistance at $0/1539 targeting the next resistance at $0.1682.
Check the full crypto analysis HERE>>> .

XEM/USD Goes Upwards. What's Next?The currency pair has added more than five percent in the past 24 hours but this is nothing more than a simple correction as XEM/USD established new lows during the weekend. XEM/USD stays below the descending trend line in the moment of writing.
When we zoom in the Hourly chart we can see that the price has tested the support area at $0.1459 during the weekend but failed to jump over it. The buyers have driven the currency pair higher later and the price is above the support area at $0.1539 currently. The possible ways for NEM are the following:
1. Red scenario (bearish). The currency pair will cross the support area at $0.1539 targeting the next support at $0.1459.
2. Orange scenario (neutral). XEM/USD will stay within the current range limited by the resistance at $0.1682 and the support at $0.1539.
3. Green scenario (bullish). NEM will break through the resistance area at $0.1682 and move higher targeting the next resistance at $0.1873.
Check the full crypto analysis HERE>>> .

XEM/USD Goes DownThe currency pair has lost more than four percent in the past 24 hours. XEM/USD develops its downside momentum in the moment of writing. Bulls and bears seem to break the balance but it is unclear whether sellers will be able to develop their progress.
Let’s have a closer look at the Hourly chart. XEM/USD tried to break through the resistance area at $0.2002. However, later the currency pair declined and crossed the support area at $0.1873. NEM fluctuates below this level currently. The possible ways for the currency pair are the following:
1. Red scenario (bearish). NEM will cross the support area at $0.1682 targeting lower aims.
2. Orange scenario (neutral). The currency pair will stay within the range limited by the resistance area at $0.1873 and the support at $0.1682.
3. Green scenario (bullish). XEM/USD will jump over the resistance area at $0.1873 and move higher towards the next resistance at $0.2002.
Check the full crypto analysis HERE>>> .

XEM/USD In Neutral Position CurrentlyNEM has lost more than four percent in the past 24 hours, but the currency pair still remain neutral in general as bulls and bears have found balance currently and hesitate to make any further steps without new fundamental drivers.
When we look closer at the Hourly chart we can see that the currency pair stays within the range currently. XEM/USD has tested the resistance area at $0.2002 on Tuesday but failed to breach it and retreated. The possible ways for the currency pair are the following:
1. Red scenario (bearish). The currency pair will break through the support area at $0.1873 and move lower searching for new targets below.
2. Orange scenario (neutral). XEM/USD will stay within the range between the resistance area at $0.2002 and the support area at $0.1873.
3. Green scenario (bullish). The currency pair will break through the resistance area at $0.2002 and move higher targeting the next resistance at $0.2121.
Check the full crypto analysis HERE>>> .

XEM/USD Aims Upper TargetsThe currency pair added more than one percent in the past 24 hours but the general picture on the Hourly chart shows that there is no tendency currently and XEM/USD is consolidating. This consolidation may be the beginning of something huge and interesting.
The currency pair has reached the resistance area at $0.2002 on Monday and tried to cross it, but failed and retreated later. However, bulls are still in control as the price is close to this resistance area. It seems like buyers will test it in the nearest future. The possible ways for XEM/USD are the following:
1. Red scenario (bearish). The currency pair will test the support area at $0.1873 and if successful, the sellers will push it lower.
2. Orange scenario (neutral). XEM/USD will stay between the resistance area at $0.2002 and the support at $0.1873.
3. Green scenario (bullish). NEM will jump over the resistance area at $0.2002 and move higher targeting the next resistance at $0.2121.
Check the full crypto analysis HERE>>> .

XEM/USD To Develop Upside ProgressThe currency pair has lost more than one percent in the past 24 hours. NEM has broken through the descending trend line during the weekend but still remains flat. The buyers are hesitating to take further steps and the sellers are unable to push XEM/USD lower.
Let’s have a closer look at the situation on the Hourly chart. The currency pair has crossed the resistance area at $0.2002 but failed to stay above this level and declined below. XEM/USD stays within horizontal range in the moment of writing. The possible ways for the currency pair are the following:
1. Red scenario (bearish). XEM/USD will test the support area at $0.1873 and break it through targeting the next support area.
2. Orange scenario (neutral). NEM will stay within the current range, limited by the resistance area at $0.2002 and the support area at $0.1873.
3. Green scenario (bullish). The currency pair will break through the current resistance area at $0.2002 and move higher targeting the next resistance at $0.2121.
Check the full crypto analysis HERE>>> .

WAIT the wave for this targets, if this formations will be fulfiled.
<<< FOLLOW me for more signals >>>>

NEM Tests Descending Trend LineThe currency pair added few percent in the past 24 hours. NEM had a huge downtrend last week and seems to stop it for a correction. XEM/USD tests the red descending trend line in the moment of writing. If successful, bulls will be able to change the situation.
Let’s have a closer look at the situation on the Hourly chart. The currency pair has tested the support area at $0.1873 on Wednesday and jumped off it. XEM/USD ran higher and reached $0.2002 later. The currency pair fluctuates close to this resistance area currently. The possible ways for XEM/USD are the following:
1. Red scenario (bearish). The currency pair will break through $0.1873 and move lower.
2. Orange scenario (neutral). XEM/USD will stay within the current range limited by the support area at $0.1873 and the resistance area at $0.2002.
3. Green scenario (bullish). NEM will break through the resistance area at $0.2002 and run higher, targeting the next resistance at $0.2121.
Check the full crypto analysis HERE>>> .

#NEM #NEMUSD #XEMUSD $NEM $NEMUSD @Nemofficial $XEMUSD20 cents would be way much interesting to get long and could make huge profits in time .
my last analysis on this is attached to comments.

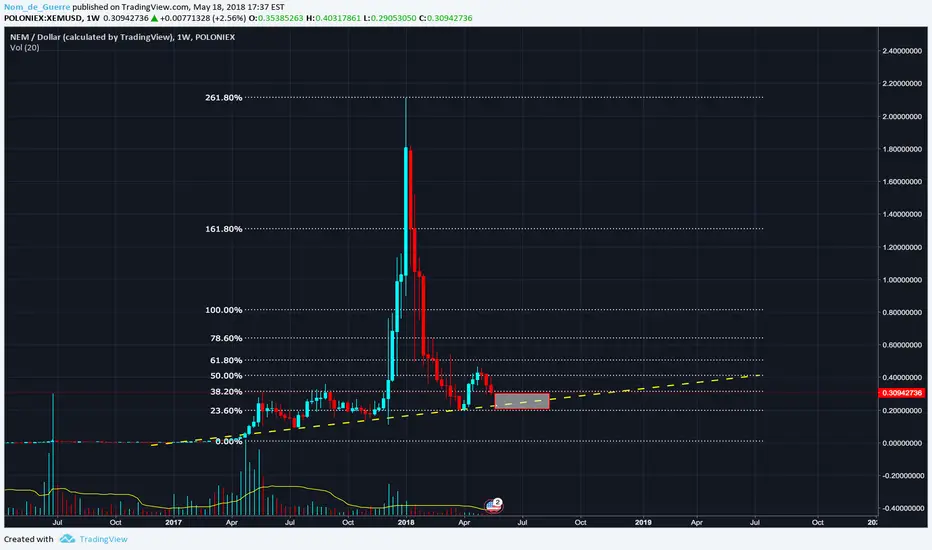
NEM Rejecting Second SupportSince the end of April NEM has corrected down strongly, while it moved from $0.45, down to $0.22. At $0.22 it found the support at 88.6% Fibonacci retracement level that has been rejected. Following wave up resulting in a growth towards $0.27 and then a small correctional wave down.
On a correction NEM/USD yet again found the support at 61.8% Fibs, that is $0.24, and at the same time bounce off the upper trendline of the broken descending channel. The rejection of two supports could mean that trend is slowly starting to reverse to the upside, targeting $0.4 level, which is 76.4% Fibs.
The downtrend could only continue if NEM will break and close below $0.22. In that case a potential double bottom formation near $0.2 could take place.

[XEM] Channel support (log scale)If we assume parallelity, XEM could soon bounce of this log bottom channel support, then a target could be the top trending line of the channel. If it breaks bellow this support and the RSI support and that we see divergence on MACD then XEM could go bearish.

NEM is gem...or only pump&dump scheme. Whatever it is, if downtrend will be continued, XEMcoin should be accumulated (by smart peoples with strong hands and buts too;))
Intresting levels for now are: 18,12, and 4 cents. Everyone should think about money management and that this entries can be (partially or as a whole) holded on longterm basis (3 moths to even one year from now on).
Not a trading advice!

XEMUSD Dont miss this Long Hi there, Watch bottom for long and buy as much as you can. On lower time frame we can see one more bearish wave before we see rise. Get ready for long on bottom.
Good Luck.


XEM is delicious - Get sated!Looking good, we're ~80-90% down from the current all-time-high(2.1 USD). If we look at the red midline in the middle of the pitchfork, we can see that it's time to accumulate like a champion. Looking to buy a lot in the next few months.
