TLRYWhat i have learnt on this stock is they have two way now, rise aggressively or normaly but this stock gone a go up for sure after few months. On the other hand chart shows that they are on bit of confuse way as well.
2HQ trade ideas

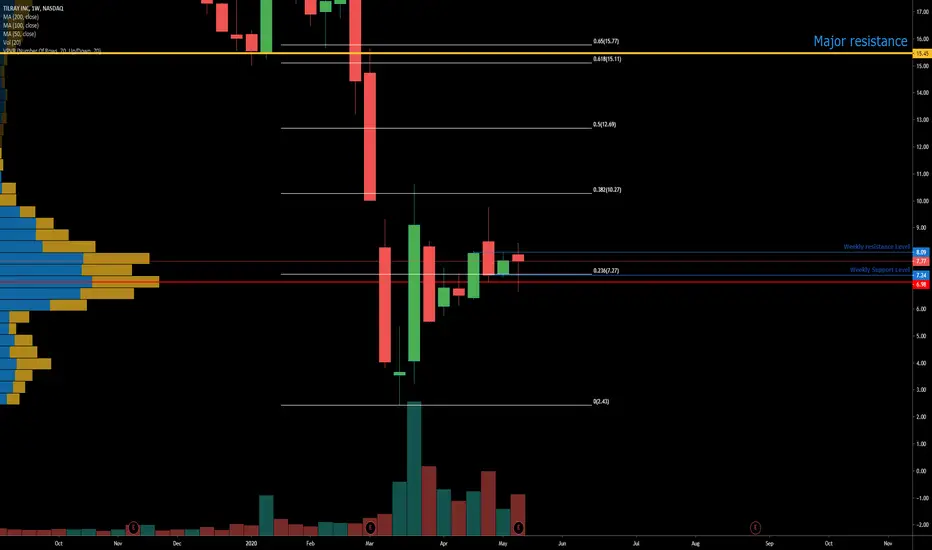
[TLRY] Boxed in w/ Nowhere to Go but Down, Load Up Pre EarningsBest case scenario TLRY bounces between $7 and $10 until earnings. I think it'll crack below the support there along with overall market weakness and tumble back down, who knows how low, really doubt it'll retest lows ($2.5 is a crazy steal) but anything under $7 really is a great value buy here especially after what ACB just demonstrated but if you're stingy like me you're probably aiming to buy in the $4-$5 range.
The industry gravity seems to be having an especially depressing effect on TLRY (aside from the overall climbing support line). Even as ACB soared and CGC, OGI, APHA and hell even the black sheep of the industry, SNDL and HEXO, made double digit gains, TLRY stayed mostly put.
Everything now reverting to mean because industry gravity is too high, that's only going to pull TLRY lower.
Eventually that gravity will dissipate and all these companies will soar, just a matter if that happens this earnings or next, but will happen.

$TLRY Weekly Review
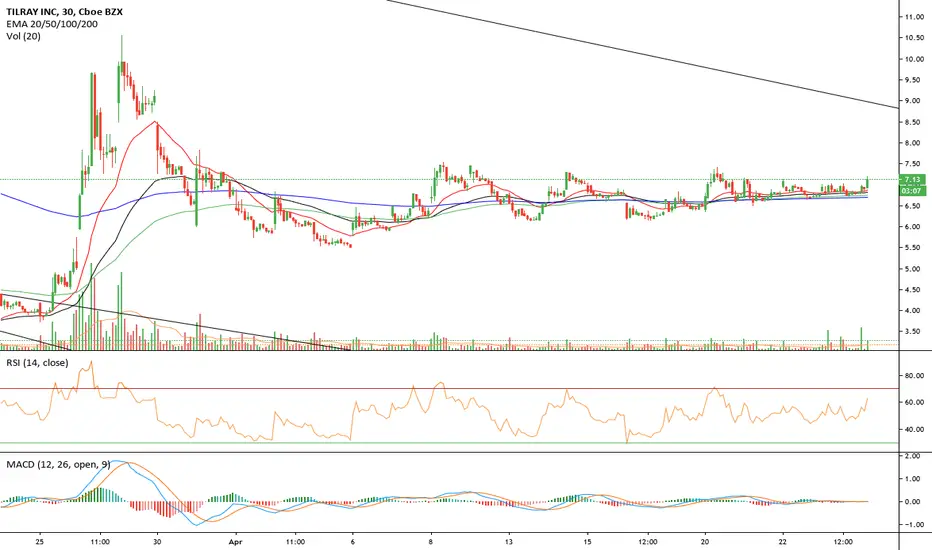
Major support at $7.25 has held for 3 weeks upon several key tests.
Key levels to watch for possible increased exposure $9.50 & $10.00
Price resistance above these levels are quite weak until the $15.00 level.
If we get a short squeeze its very possible to reach $15 in 1 session.
Lets hope the bottom may be in for the sector after ACB's huge move Friday.
PLEASE GIVE US A LIKE OF LEAVE A COMMENT IT REALLY HELPS TO MAKE OUR CONTENT VISIBLE.
HEXOrequest. is the bottom finally in? with the NYSE warning notice and the very low price, will insider investors start loading up?

Technical Analysis on TLRYNASDAQ:TLRY
Wow what a chart. Down over 95%. Will the bleeding finally stop?
Drop to 1.618 support with inverted hammer signals a reversal. Previous drops after pops have acted similarly as show on the chart with fibs charted out.
It is down out of that huge descending trend area, lost that long time support which could act as major resistance. Very interesting indeed.
Some chart info:
Moving averages are exponential. Indicator is by LazyBear called 8x MA with configurable lengths
Green: EMA 10
Skinny Red: EMA 20
Thicker Red: EMA 26
Orange: EMA 50
Light Blue: EMA 100
Dark Blue: EMA 200
Skinny Black: EMA 250
Skinny Purple: EMA 300
Bottom indicators are:
RSI (14, CLOSE)
Stoch RSI (3,3,14,25, CLOSE)
Stoch (5,3,3)
ADX and DI (14,20)


TLRY BUY (TILRAY INC)Hi there. Price is forming a reversal pattern to change its direction. Watch strong price action at the current price for buy

$TLRY - Wedge Breakout$TLRY looks like its ready to break through our STP Trendline indicator to the UP side! Big move coming here for earnings top of the move is near that $9.5-$11 dollar area!!
Good luck if you like this idea please follow us :)

TLRY 1D Possible LONGTLRY on 1 day chart corrective wave triangle if i did drought correct triangle lower line than we are in bullish flag and if we will break major resistance line top line of triangle to the top plus TLRY on top of 50 moving average now with conformation doji and Stochastic had higher high at same time chart/candles showing low high thats lost of momentum its BULISH sign. I say LONG but top triangle line have to be broken upwards first. Please make your own decision i make mistakes but market always correct so its easy just follow the market, manage ur risk, plus size ur positions correct, be very discipline, no emotions in trading and u will make money
link:
s3.amazonaws.com

Buy the DipFirst off I don’t like providing price targets. Wait for price conformation to buy. The market should still rise a little next week but I still believe we have one more leg down. TLRY should finish up next month. This quarter will be the low in the market as a whole. Capital will flee to the US market since we have no where else to go. Hold cash and wait for the dip.

$TLRY Finally Breaks the 50Day Moving Average
Earnings approaching on the 11th may and as per usual this will be a battle ground
The stock has been building a consistent base and has finally broken above the 50MA
lets look deeper into the technical .
PLEASE GIVE US A LIKE OF LEAVE A COMMENT IT REALLY HELPS TO MAKE OUR CONTENT VISIBLE ABOVE THE FAKES.

$TLRY: $10 Short Potential [Currently < than IPO Price]First off, please don't take anything I say seriously, or as financial advice. That being said, let me get into a few of my key insights. Tilray is currently only $8.05 which is lower then the $17 price it was entry into the market. The stock peaked at $240 before starting to tumble down bearishly entering into 2019. Cannabis was a fad or bubble waiting to be popped. That being said, as a 750+ employee company that is revamping, it isn't a bad stock pick and may be a steal at its current price. Many analyst are neural on it, but I think it has light in the tunnel for growth. Today it had a high of $9.75, before going down to $8.05. Overall, day over day, the stock's close price went down -0.74%. Today was a notoriously bad day for the market, and this performance was better than expected. Overall, a short of $10 is reasonable, and this is one of those stocks that can likely be flipped multiple times for a day trader or trading bot. It seems to also have long potential, and I believe it will likely reach another bullish run.

$TLRY Sits at a Trend Identity CrossroadsTLRY is fighting to regain posture above the 50-day MA. The $10 level is bottling things. But the $15 area is a natural target if a breakout ripens from here. That said, you don't want to see consecutive closes back under the new upward sloped trendline.

TLRY - for all you 420 lovers!I still think TLRY wants to go higher. Constructively working its way up. Looks like a quick digest of the recent run-up and it will attack the swing high off the bottom.