Opening (IRA): AMD Feb 21st 100/105/126/131 Iron Condor.. for a 2.01 credit.
Comments: Earnings announcement (2/4) volatility contraction play.
Metrics:
Max Profit: 2.01
Buying Power Effect: 2.99
ROC at Max: 67.22%
50% Max: .52
ROC at 50% Max: 33.61%
AMD trade ideas

AMD After earningsAMD after earnings. My idea on how to play. I expect a fade. Don't think it will gap and go because:
1. Earnings were not that bad. AMD beat estimates but in the data center segment which is why the market is punishing it
2. Bears will take profit meaning there is a chance for a fade.
3. Initial response to earnings after hours last night was up. Algos Moved it all the way up to 126 which might be a reason to see how it will play
Why it could be a gap an go
1. There is no support. Next support could be 100 (round number) and 95 and 75 (100 Monthly SMA)
2. Big volume yesterday which could be some kind of Bull squeeze (all bulls are trap this morning and will be trying to close their positions)

Fundamental Weakness Meets Technical Strength, AMD at a Turning?Hello readers,
Advanced Micro Devices (AMD) posted strong Q4 earnings, with a 24% year-over-year revenue increase to $7.66 billion, slightly surpassing estimates. Adjusted EPS came in at $1.09, just above expectations.
However, the data center segment underperformed, bringing in $3.86 billion a 69% YoY increase but below the $4.1 billion analysts had anticipated. Additionally, CEO Lisa Su cautioned that data center sales may decline by 7% in the next quarter. This guidance, combined with the revenue miss, led to an 8.2% pre-market drop in AMD’s stock price.
Technical Perspective
The price has finally arrived at the first key area of interest. This level has been anticipated for some time, and the fundamental reaction has now drawn the price close to the marked zone.
For those considering this as a potential investment, I can provide a small but valuable confirmation: from a technical standpoint, this is not a mistake to take, as this area holds the potential to generate strong liquidity for further growth.
Key criteria:
1. Strong horizontal price zone around the $100
2. The round number itself $100
3. The trendline since 2018
4. Channel projection
5. Equal waves from the top
For a more in-depth technical analysis, visit my Substack channel - content is now available for English readers. Simply go to my profile and click on "Website."
Regards,
Vaido
Disclaimer: This is not financial advice. Always conduct your own research and consider risk management before making any investment decisions.

AMD PRICE ACTION FEB 5TH 2025This is the price action of AMD at its very best & exclusively for viewers on trading view.
I have discussed in depth price action of AMD and if you have any doubts feel free to leave a message or your comments below.

Ascending traingles on AMD higher time frame chartLooks like AMD will be bottoming soon (~90's)
AMD is following the ascending triangle pattern and the descent it is experiencing right now is very similar to the ABC it had before. Similar projection from the top of ABC and if the similarity continues, it will fall on the green/support trendline and bounce. The stock might hit the trendline when the price is around 90's or it might just wick down to the trendline and bounce too.
Anything in the 90's should be a BUY in my opinion. Feel free to share your thoughts.

Go long at 103I have had 103.20, lets just say 103 area, marked off on my chart for over 3 years. MASSIVE SUPPORT AREA. Great area to start building a position, if it dips below then just average down.

AMD LONGThe chart looks ready for some upside after consolidating. Previous breakouts share this same downward consolidation pattern. Strong support at the 200MA on weekly chart provides a safe floor to buy and hold shares. Earnings reported today 2/2/25 were positive.


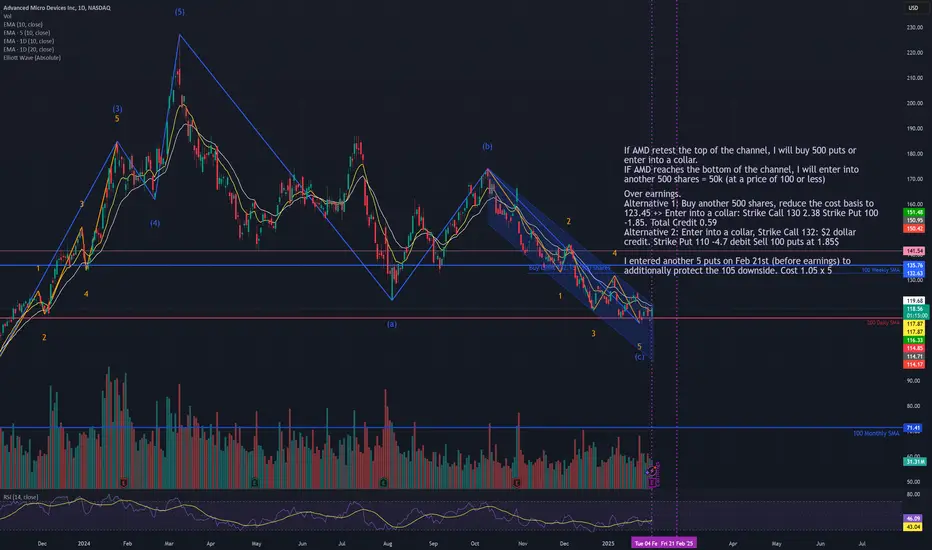
Further to my previous AMD idea of managing the positionHere I am trying to further develop some ideas on how I am managing my AMD position.
AMD Advanced Micro Devices Options Ahead of EarningsIf you haven`t bought AMD before the previous earnings:
Now analyzing the options chain and the chart patterns of AMD Advanced Micro Devices prior to the earnings report this week,
I would consider purchasing the 113usd strike price Calls with
an expiration date of 2025-2-21,
for a premium of approximately $7.20.
If these options prove to be profitable prior to the earnings release, I would sell at least half of them.

AMD: Looks like bottom, finally!NASDAQ:AMD : Looks like bottom, finally!
Weekly Chart Analysis:
- 200D MA
- Volume Shelf
- Bottom of Falling wedge
- S/R Zone
- Divergence on the Wr%
$135 ▶️ $165 Incoming 🎯
Not financial advice

AMD'S Technical rating indicator monthly !Still pretty high comparing with historical data all way back to IPO. Still high
even with last low ( 2 Green circles) Even though we might have a bounce big time
20%-40% up on a monthly we are still on the high side or readings comparing an
Apple for Apple all else absolute.!

AMD LongAMD has setup what looks to be a bullish flag on the 7D.
Touching support on the 0.118(115.27) buyers picking up liquidity at this area prior to JUN 2023.
Volume shows sellers running out of pressure.
If this setup is confirmed we can be looking for an upside back to the resistance level of 1(205.57).

AMD - Advanced Money DestroyerWell, YOLO/FOMO/HODL/BTD whatever your acronym, One day, this may pay!
Here is my opinion, the good, the bad, the ugly.
While actually, the ugly would be the pretty in the long run....
I'm calling AMD my large cap Spec play for 2025/26
As soon ass NVDA hits it's low, I', stacking this also

AMD - quo vadis ? Reversal ahead or down to 94 - 74$ ?AMD, some traders here call it Advanced Money Destroyer.
Certainly no stock to just buy and hold anymore.
I am confident that AMD will turn and deliver significant gains again, but the key will be to find that turning point.
Currently I can see three scenarios: turning here at 115$ trend line support after good earnings on Tuesday or down it goes to major fib supports at 94$ or 74$.
I am keeping an eye on the 30D EMA. Once that is crossed I'll start thinking about a long position.

AMD 200 WMA support, Fib retracement and MFI under 20
As stated in the title, the stock has found support at the 200 WMA and coincides with the 75% Fibonacci retracement. The Money Flow Index is also in oversold territory. If the earnings report is favorable, the stock could gain renewed momentum.

XABDC Gartley on AMD. Advanced Micro Processors. Bull incoming.
Beutiful gartley on AMD. With AI in a narrative this is all setup to go back to all time highs.
1st target is $158, 2nd $187 and third is $207.

AMD Channel Down bottomed on RSI Bullish Divergence.Advanced Micro Devices (AMD) have been trading within a Channel Down pattern since the March 08 2024 All Time High (ATH). The pattern is currently on its 3rd Bullish Leg and is below its 1D MA50 (blue trend-line) for exactly the past 3 months.
This Bearish Leg has however most likely come to an end as the 1D RSI is on Higher Lows against the price's Lower Lows, showcasing a Bullish Divergence similar to May 01 2024. As a result, we can expect the new Bullish Leg to start, with the previous minimum being +32.85%. Target $148.00.
-------------------------------------------------------------------------------
** Please LIKE 👍, FOLLOW ✅, SHARE 🙌 and COMMENT ✍ if you enjoy this idea! Also share your ideas and charts in the comments section below! This is best way to keep it relevant, support us, keep the content here free and allow the idea to reach as many people as possible. **
-------------------------------------------------------------------------------
💸💸💸💸💸💸
👇 👇 👇 👇 👇 👇

AMD with a bullish movement on the horizonWe have an AMD fulfilling its common pattern of a stoch RSI on the floor and a lack of strength in its movement. It always resulted in an upwards movement.
This is 100% an accumulation zone to enjoy the profit in the near future.

AMD'S Monthly indicators are still high Different indicator are still elevated and suggests that there is more room to the down side in the next few months or even 2 years. We have seen much lower numbers accross the board when having a major troughs.

AMD'S Short sell volume is screaming for a trough BUT downgradedMost analyst following AMD are downgrading its fundamentally because of the
AI new software coming from small company in China. Well, technically we are completely
going into the other direction which is we are having a major trough in coming weeks/months
in 2025 with + 50% move.
- The big question is when and where ?
WARNING: Some Elliottions are calling for a 1929 bear mkts !!!!!!!!!!

AMD stock predictionJust put aside on fundamental analysis for this stock regarding they`re left behind compare to its fierce competitors like NVIDIA,TSMC, META, GOOGLE, in AI/ GPU market. By technical analysis we can learn that history will repeat itself and with just simple analysis, we can see that the same pattern will occur. Just following your risk & management then you can do good in this turbulence market.
