AMD Major Lower Highs/ 1W MA50 break-out.It was only 9 days ago (June 16, see chart below) when we called for a potential bullish break-out on Advanced Micro Devices (AMD) above the 1W MA50 (blue trend-line):
The break-out did happen, this 1W candle is already considerably above its 1W MA50 and based also on the level the 1W RSI is at right now, it may resemble more the March 13 2023 1W candle instead of the January 30 2023 as previously thought.
The reason is the major break-out of the All Time High (ATH) Lower Highs trend-line that came along with the 1W MA50. As you can see, it was on the March 13 2023 1W candle that AMD broke above that trend-line with the 1W RSI being on the same level (66.00) as today.
This candle formed a short-term Top, with the price initiating a 1.5 month pull-back that re-tested the 1W MA50 as Support and then moved on to complete the +143.12% Bullish Leg from the Channel Up bottom.
As a result, we can't rule out the first wave of short-term profit taking by next week. But a potential 1W MA50 test, will be another long-term buy entry in our view. Our $185.00 Target remains intact.
-------------------------------------------------------------------------------
** Please LIKE 👍, FOLLOW ✅, SHARE 🙌 and COMMENT ✍ if you enjoy this idea! Also share your ideas and charts in the comments section below! This is best way to keep it relevant, support us, keep the content here free and allow the idea to reach as many people as possible. **
-------------------------------------------------------------------------------
💸💸💸💸💸💸
👇 👇 👇 👇 👇 👇
AMD trade ideas

AMD – Choppy Structure May Confirm Full ABC Correction From $76AMD surged from $115 to $130 with strong volume, but failed to attract follow-through buying interest. Since May 20, price action has become increasingly choppy and indecisive.
This raises the probability that the entire move from $76 may be forming a completed ABC corrective structure.
A sustained drop below $125 would test the diagonal base. If broken, it could expose $116 and $110 as next downside targets.

AMD Wave Analysis – 25 June 2025
- AMD rose above the resistance level 136.16
- Likely to rise to resistance level 150.00
AMD recently broke the resistance zone between the resistance level 136.16 (former strong support from 2024) and the 61.8% Fibonacci correction of the downward impulse from last October.
The breakout of this resistance zone accelerated the active short-term impulse wave 3, which belongs to the multi-month upward impulse sequence (3) from the start of April.
AMD can be expected to rise to the next resistance level 150.00, former monthly high from November and the target for the completion of the active wave (3).

The next Intel or the next Nvidia?Neither, AMD has it's own path with destiny. The cyclical nature of semiconductors makes this an interesting stock to analyse through TA. The fundamentals remain strong, whilst they are clearly behind Nvidia and Broadcom, there's also closely following behind and have a far smaller market cap. In a risk on mode, I think this offers far better upside than a 3 trillion dollar Nvidia stock.
It looks like much of Nvidia's stock price has been baked in the revenue growth into the stock price. Not even an earnings beat was enough to satisfy investors. People are panicking, 10 year yields are dropping, the market is in freakout mode.
Meanwhile, AMD remains bearish, there is no doubt about that. The question is where is the bottom?
I have a very strong buy zone here at $91-100. I think the risk to reward here is quite compelling. Using stop losses to minimise potential capitulation, risk management would have saved a lot of headache for anyone who has purchased since 06/03/24, almost a year ago, as they are down on their position and were better taking a small calculated loss.
Not financial advice, do what's best for you.

AMD 1W: If Not Now — Then When?The weekly chart of AMD looks like it’s holding its breath: a well-defined falling wedge, double bottom support, and price pressing right against long-term trendline resistance. Everything’s in place — now it just needs to break and run, preferably without tripping over nearby Fibonacci levels.
The stock is trading around $114 and attempting to hold above the 50-week MA. Just ahead is the 200-week MA (~131) — not only a technical hurdle but also a psychological pivot. A move above it could reignite talk of $150+ targets.
The wedge has been narrowing since late 2024. After repeated bounces off support, price has returned to the top of the pattern. A confirmed weekly close above the wedge could trigger a real breakout. Without that — it risks yet another scripted pullback.
Key Fibonacci levels:
0.618 — $133.60
0.5 — $151.42
0.382 — $169.25
0.236 — $191.30
0.0 — $226.95 (all-time high)
The roadmap looks clean — but only if volume follows through. There are signs of quiet accumulation at the bottom, but no explosive buying just yet.
Fundamentals:
AMD delivered solid Q1 results: revenue is growing, EPS beat expectations, and margins are holding. More importantly, the company launched a new $6 billion stock buyback program — showing clear internal confidence in its long-term trajectory.
There’s also a strategic AI partnership underway with a Middle Eastern tech group. This move positions AMD to challenge not just for GPU market share, but for future AI infrastructure dominance — long game stuff.
Analyst sentiment has turned bullish again, with new price targets in the $130–150 range. All of this makes the current chart structure more than just technical noise — it’s backed by strong tailwinds.


AMD Trade Thesis – Navigating the Derivatives DimensionNASDAQ:AMD continues its calculated ascent through equilibrium, now challenging the upper liquidity void. Today's Smart Money Concepts chart reveals a breakout from the discount range, aligning with institutional footprints and volume confirmation.
🧠 WaverVanir DSS Forecast:
📍 Current: $129.58
🔄 15-Day Projection: $127.91 (−1.3%)
📈 30-Day Projection: $132.32 (+2.1%)
🧪 Sentiment Score: 40.9 → Calm confidence, no euphoria. Perfect conditions for silent positioning.
📐 Chart Outlook:
Equilibrium passed; acceleration toward imbalance zones likely.
Resistance above at:
$150 → Institutional anchor
$169.56 → Strong liquidity cluster
$226.38 → Final Fibonacci expansion (1.618 level)
📊 Strategic Alignment:
This is not a pursuit of capital—it’s a derivative strategy aligning time, volatility, sentiment, and fractal geometry. Money is the echo. We move with the source.
We don’t chase the surface—we code the undercurrent. Derivatives are our dimension, and AMD is the current signature.
🔐 This post is for informational and educational purposes only—not financial advice. Always manage your risk in accordance with your strategy.
#AMD #QuantTrading #SmartMoney #SMC #AITrading #WaverVanir #VolanX #Derivatives #DSS #MarketPrediction #Fibonacci #Leadership #StrategicLiquidity #OptionsFlow #TradingView #WaverVanirInternational

AMD: Second round trip!AMD: Second round trip!
How did you enjoy the journey, are you ready for round 2?
.
US STOCKS- WALL STREET DREAM- LET'S THE MARKET SPEAK!

Inverse head and shoulders complete The price has completed the formation of an inverse head and shoulders pattern and is preparing for an upward movement.
The price has already tested the neckline; the breakout above $132 will initiate the bullish trend

Powerful AMD Trade Opportunity BreakdownAs I was going through AMD’s daily chart today, something stood out — and not in a subtle way. Amid a steady bullish trend, the June 16 candle formed a clean imbalance, opening up a textbook Fair Value Gap (FVG) that screams institutional activity.
This gap offers a clear zone of interest — between $126.58 and $117.88 — where smart money might be eyeing positions. That’s where my focus locked in.
But it didn’t stop there. I dug deeper and spotted an incredible bounce off support from August 5, 2024 — lining up perfectly with the zone. That’s not coincidence. That’s structure.
With the Squeeze Momentum showing light green and AlgoPro Support & Resistance confirming an uptrend, the case builds stronger. If momentum stays bullish on the lower timeframes, this could be our green light to strike.
Targets are clear:
📍 TP1: $132.80
📍 TP2: $135.70
And true to the VEP Trader Strategy (Vision, Execution, Precision), I’ll be dropping into 5M or 2M charts — watching for a liquidity sweep, a FVG confirmation, and a solid EMA retest.
No guessing. No hype. Just clean structure, liquidity, and calculated confirmation.
#AMDStock #DayTradingSetup #TechnicalAnalysis #SmartMoney #VEPStrategy #FairValueGap #LiquidityZones #MomentumTrading #SqueezeMomentum #TradingCommunity #StockMarketEducation #TradingSetup #TradeWithPrecision #SwingTradeIdeas #SniperEntry #PriceActionTrading #TradeSmart #InstitutionalTrading #StockAnalysis #MarketBreakdown

$AMD supercycle ; PT $300-350 by 2027- NASDAQ:AMD has likely entered a supercycle and we have entered Agentic AI world where inferencing is the main area of investment.
- Model Training is still important but we have entered a stage where lot of open source models and many proprietary vendors are close to each other when it comes to performance.
- Companies are trying to monetize their investments and one critical thing is model inference i.e making predictions.
- NASDAQ:AMD is poised for the agentic ai boom and therefore next 2 years are golden years for $AMD.
AMD IS READY FOR A STRONG BULLISH MOVENASDAQ:AMD Right now, am extremely bullish on AMD.
I expect AMD to give a good bullish run to trail NVIDIA.
Technically, AMD is supper bullish right now, having had a multiple bullish break of structure on the daily time frame.
I took a long entry on the bullish break of structure on daily time frame. Stop loss is below the recent structure swing low.
What do you see on your chart?

Nice chart AMD profit zoneGreen zone, up vs down performance. AMD is underforming this year giving us a chance to invest in AI company with great outlook going fwd.


Bulls eating dips like a fat man eats chips! AMD hitting my next target here around 126, short term dip into new trend support is possible, looking for 140s after this small consolidation period is over..
pretty simple, boost and follow for more! ❤️🔥

AMD: Mapping Cycle via 3 FibsWaveform
High To High cycle Fib interconnection
Extension to the right matches recent bottom.
Expanding and anchoring the structure on L2L cycle
Levels around 3 intersections expose highest probability density.

$AMD Short to $105Personally I am avoiding the hype & FOMO on this stock. Big money is selling the headlines while retail FOMO get trapped. I will reenter longs in the $95-105 range. Setting stops around $128.

AMD at Decision Point — Will $125 Hold or Break into Gamma Gap?🔬 GEX (Options Sentiment) Breakdown:
* Call Walls / Resistance:
* $128.89 = Gamma Wall (Highest positive NET GEX)
* $130.69 = 2nd CALL Wall
* $132–$135 = Heavy call congestion, unlikely unless breakout with macro tailwind
* Put Support Walls:
* $125 = Current Gamma Flip Level (critical)
* $122 / $121 = PUT support zone (GEX cluster + structure)
* $113 = 2nd PUT Wall (flush risk zone)
* Options Flow Metrics:
* IVR: 15.6 (modest)
* IVx avg: 48.3
* Call Flow: 33.8% (bullish leaning)
* GEX Sentiment: 🟢🟢🟢🟢 (moderately bullish, but fading under $126)
* Interpretation:
* AMD is trapped just below $128.89 Gamma Wall, failing to reclaim the high.
* If $125 breaks, dealer gamma hedging could intensify toward $122–$121.
🧠 15-Minute Smart Money Price Action:
* Current Price: $126.95
* Structure:
* CHoCH confirmed after rally peaked at $130.69.
* Supply rejection zone (pink box) held hard — price reversed and dropped into trendline test.
* Currently compressing between $126.40 and $125.06, right above the CHoCH floor.
* Volume:
* Fading volume = consolidation after weakness
* Watch for a volume spike at the $125 line to confirm breakout or bounce
* Trendlines:
* Still above ascending trendline, but momentum weakening.
🧭 Trade Scenarios for June 18:
🟥 Bearish Breakdown Setup:
* Trigger: Clean break and 15-min close below $125.06
* Target 1: $122.00 (PUT wall + support)
* Target 2: $121 → possible gamma flush zone
* Stop-loss: Above $127.20 (above minor CHoCH reclaim)
Gamma + SMC breakdown at $125 = likely acceleration to $122. Volume confirmation critical.
🟩 Bullish Continuation Setup:
* Trigger: Reclaim and 15-min close above $127.50
* Target 1: $128.89 (Gamma wall)
* Target 2: $130.69 (previous high + 2nd CALL Wall)
* Stop-loss: Below $125.50
Only valid if macro supports or SPY/QQQ bounce. Otherwise, just a fade opportunity for premium sellers.
💭 My Thoughts:
* AMD is hovering above a critical gamma/structure level at $125 — if it breaks, expect dealer flows to push it quickly toward $122.
* Volatility is still relatively low → options are priced favorably for directional trades.
* Watch SPY/QQQ correlation — if market remains weak, AMD likely leads tech breakdowns.
* Patience pays here — don't front-run. Wait for candle close confirmation at $125 or reclaim of $127.50.
✅ Summary for June 18:
* Bias: Neutral → Bearish
* Key Breakdown Level: $125.06
* Bearish Targets: $122 → $121
* Bullish Reclaim: Above $127.50 = potential move to $130
* GEX Danger Zone: Below $125
Disclaimer: This analysis is for educational purposes only. Always trade your own plan and manage your risk.

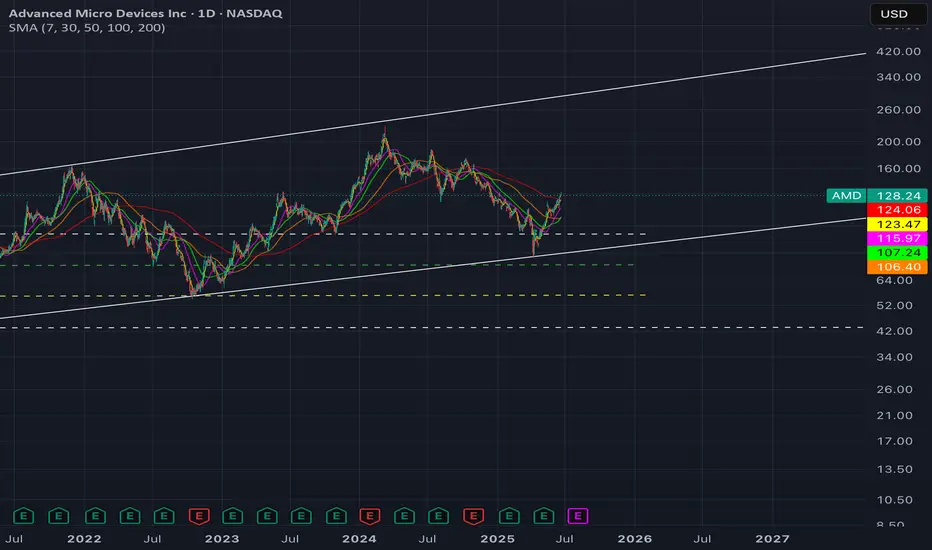
AMD's Long Awaited Reversal Advanced Micro Devices (AMD) has maintained a well-defined long-term ascending channel since 2019, marked by cyclical touches at both the upper and lower bounds. The current setup signals a bullish reversal following a successful retest of the channel’s lower boundary
AMD now shows a strong bullish reversal:
✅ Broke above a multi-year downtrend line with volume support
📈 Currently retesting resistance $128, a breakout zone historically met with selling
🎯 Channel target projection: $300, offering 140% upside from current price
🔄 Price action consistently respects this trend structure with rhythmically timed expansions every 18–24 months
🧾 Fundamental Tailwinds (2024–2025 Context)
🔥 1. AI Infrastructure & Data Center Dominance
AMD’s MI300X AI GPU series has gained significant traction against Nvidia, with major cloud customers like Microsoft Azure and Meta adopting it for inference workloads.
Revenue from AMD’s Data Center segment surged >80% YoY in Q1 2025, driven by hyperscaler demand and Genoa EPYC chips.
Guidance for 2025–2026 includes double-digit YoY growth across AI and cloud sectors.
🧠 2. Product Roadmap Strength
AMD maintains competitive momentum with Zen 5 CPU launches and RDNA 4 GPU architecture set to arrive late 2025.
Management reaffirmed commitment to high-margin enterprise products and scalable AI inference.
📉 3. Valuation Reset + Earnings Reacceleration
After correcting from $164 to under $100, AMD entered a consolidation phase, allowing for multiple compression reset.
Now trading at ~35x forward P/E (down from 60x peak), with EPS expected to grow >25% YoY into FY2026.
💵 4. Balance Sheet & Buyback Support
Over $5.7B in cash, near-zero debt, and an active $8B share buyback program reinforce shareholder value.
Gross margin in Q1 2025 stood at ~51%, with continued improvements expected from data center mix shift.

AMD - Reject or break the down trend?Been a long time AMD bull, even though it was the Advanced Money Destroyer under $100.
My position became a bit too large as I DCA, today I took off 30% of my position.
I am in a full position currently.
It has ran up nicely and can still run more in my opinion.
I would like to see it break the trend line and confirm a weekly close above it, then retest it as support in the low $100's
GLTA

AmdRising wedge here approaching 130-133 double top resistance..
Daily candle extended outside bband..
Look for a pullback to 96-105
Entry 127-131..
Stop loss - A close above 134.00
SOXL (Chip sector) hasn't broken out and the weekly candle finished bearish so I don't think AMD will move over 130
If price does close above 134 then 180 is incoming

AMD Explodes +9%! Will Momentum Continue or Fade? Jun 17AMD Explodes +9%! Will Momentum Continue or Fade into the Gamma Ceiling? 🧠
🧬 GEX Options Sentiment Breakdown:
* Key Gamma Zones:
* Gamma Wall / CALL Resistance: $125 – currently the pivot zone, also the NET GEX peak.
* CALL Walls:
* $128.12 → Local high, thin resistance.
* $130 → 2nd CALL Wall.
* $135 → Final ceiling (GEX9/10 cluster).
* PUT Walls:
* $114–$113 → Major PUT support and gamma flip danger zone.
* Below $114 could trigger accelerated dealer hedging to the downside.
* Options Metrics:
* IVR: 12.3 (low vol, potential expansion)
* IVx avg: 46.7
* Calls Flow: 47.2% — highly bullish options flow
* GEX Sentiment: 🟢🟢🟢🟢 (strong bullish tilt)
* Interpretation:
* AMD is parked at the Gamma Resistance Wall (GEX max zone) — further upside requires volume + broad strength.
* A rejection could push price back toward $120–123, which is also where gamma flips to neutral.
📉 15-Minute SMC Chart Breakdown:
* Current Price: $125.09
* Structure:
* Clean BOS (Break of Structure) from $116 → $128.
* Now experiencing CHoCH (Change of Character) at the supply zone, signaling possible short-term pullback.
* Price just tapped the supply zone and reversed; currently consolidating around the Gamma Wall.
* Trendline + Demand Zones:
* Strong ascending trendline holds above $120.
* Multiple demand zones from $117.8 → $115 (where volume initiated the breakout).
* Watch for retests of the gap zone (shaded FVGs) for bounce entries.
🧭 Trade Scenarios:
✅ Bullish Continuation Setup:
* Trigger: Break and hold above $128.12
* Target 1: $130 (2nd CALL Wall)
* Target 2: $135 (GEX9 cluster)
* Stop-loss: Below $124.50 (if fails to hold breakout)
This would confirm dealer chasing and continuation of the breakout move.
🚨 Bearish Reversal Setup:
* Trigger: Clean break below $124.00 and failure to reclaim
* Target 1: $120–$123 (gamma flip + support zone)
* Target 2: $117.80 → Demand box
* Stop-loss: Above $126.50
Ideal for short-term PUTs or premium fade. Watch for volume confirmation below supply.
🧠 My Thoughts:
* Strong move today, but now sitting at the gamma apex — could magnetize or reject hard.
* IV is still low (IVR 12), so options premiums may expand if volatility reenters.
* Volume surged on breakout — likely institution-backed. But if price fails to reclaim $126–$128, profit-taking could kick in.
* Stay nimble — this is not the ideal place to chase unless price cleanly reclaims highs.
📌 Conclusion:
AMD has printed a textbook breakout and is now testing the Gamma Wall at $125. If bulls reclaim $128+, the move to $130+ is on the table. Otherwise, expect a pullback toward $120–$123 as dealer positioning cools off.
Disclaimer: This analysis is for educational purposes only and does not constitute financial advice. Always trade with proper risk management.
