Before GER40 Roars, It WhispersHey guys👋
Here’s the latest GER40 analysis I’ve prepared for you:
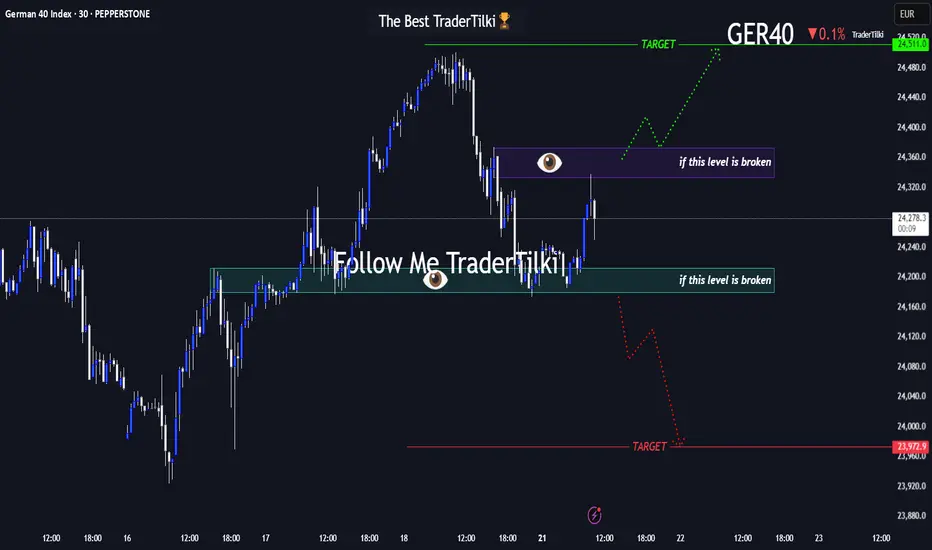
🔻 If the **24,179** support level breaks, the next target is **23,972**.
🔺 If the **24,373** resistance level breaks, the next target is **24,511**.
🎯 I’ve shared two key levels with you — please monitor them carefully.
Every like from you gives me a big boost of motivation 🙏
Thanks to everyone who supports my work — truly appreciate it 💙
DAX trade ideas
Bullish momentum to extend?DAX40 (DE40) is falling towards the pivot which has been identified as a pullback support and could bounce to the pullback resistance.
Pivot: 23,059.10
1st Support: 22,177.80
1st Resistance: 24,630.42
Risk Warning:
Trading Forex and CFDs carries a high level of risk to your capital and you should only trade with money you can afford to lose. Trading Forex and CFDs may not be suitable for all investors, so please ensure that you fully understand the risks involved and seek independent advice if necessary.
Disclaimer:
The above opinions given constitute general market commentary, and do not constitute the opinion or advice of IC Markets or any form of personal or investment advice.
Any opinions, news, research, analyses, prices, other information, or links to third-party sites contained on this website are provided on an "as-is" basis, are intended only to be informative, is not an advice nor a recommendation, nor research, or a record of our trading prices, or an offer of, or solicitation for a transaction in any financial instrument and thus should not be treated as such. The information provided does not involve any specific investment objectives, financial situation and needs of any specific person who may receive it. Please be aware, that past performance is not a reliable indicator of future performance and/or results. Past Performance or Forward-looking scenarios based upon the reasonable beliefs of the third-party provider are not a guarantee of future performance. Actual results may differ materially from those anticipated in forward-looking or past performance statements. IC Markets makes no representation or warranty and assumes no liability as to the accuracy or completeness of the information provided, nor any loss arising from any investment based on a recommendation, forecast or any information supplied by any third-party.

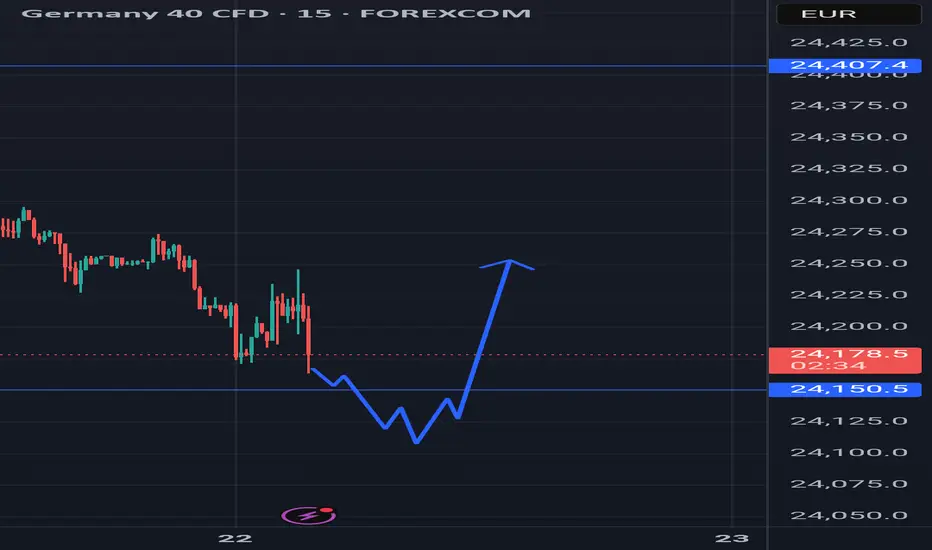
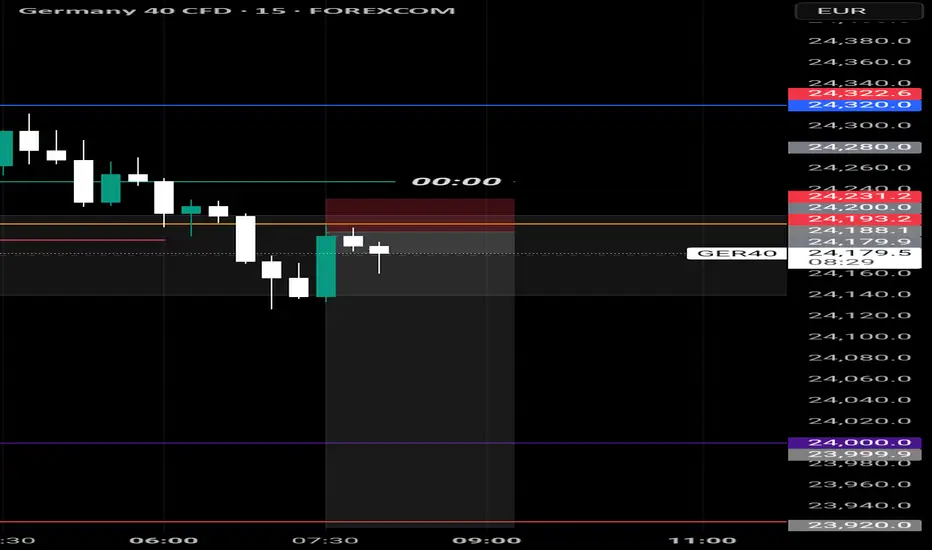
GER40 in Motion: This Setup Speaks Volumes 🌅 Good morning, my friends,
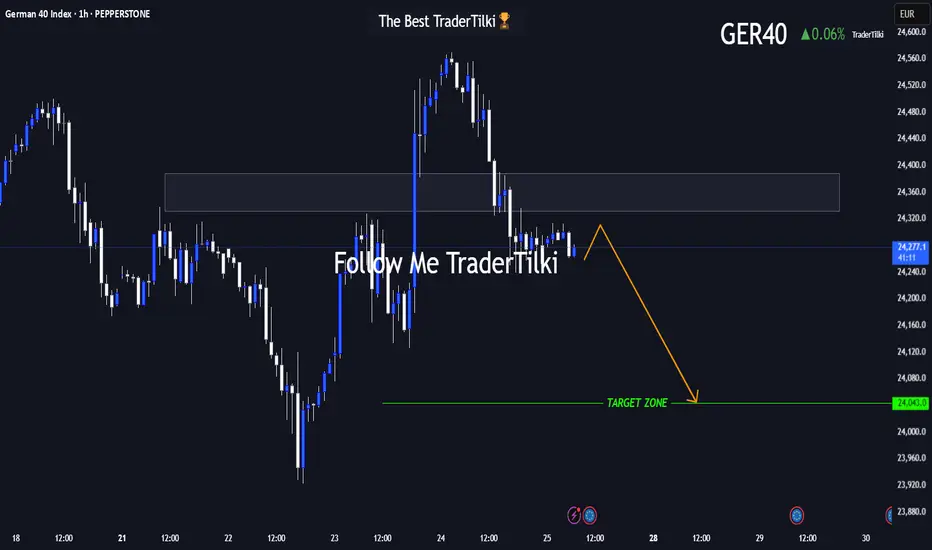
I’ve put together a fresh GER40 analysis just for you. Even if the 1-hour timeframe shows some upward momentum, I fully expect the price to reach my target level of **24,050**.
I'm holding firm until that level is hit.
Every single like from you is a massive source of motivation for me to keep sharing analysis. Huge thanks to everyone supporting with a tap!
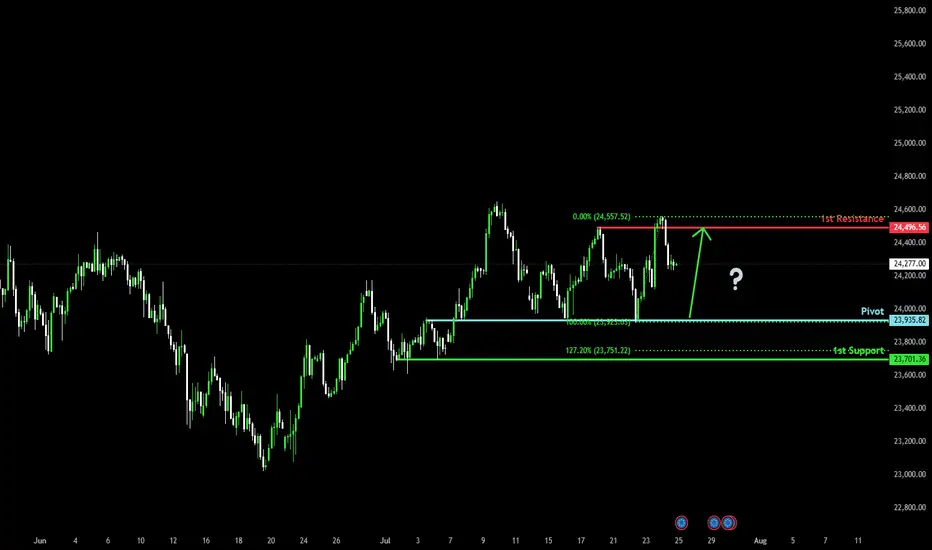
Bullish bounce off major support?DAX40 (DE40) is falling towards the pivot, which has been identified as an overlap support and could bounce to the 1st resistance.
Pivot: 23,935.82
1st Support: 23,701.36
1st Resistance: 24,496.56
Risk Warning:
Trading Forex and CFDs carries a high level of risk to your capital and you should only trade with money you can afford to lose. Trading Forex and CFDs may not be suitable for all investors, so please ensure that you fully understand the risks involved and seek independent advice if necessary.
Disclaimer:
The above opinions given constitute general market commentary, and do not constitute the opinion or advice of IC Markets or any form of personal or investment advice.
Any opinions, news, research, analyses, prices, other information, or links to third-party sites contained on this website are provided on an "as-is" basis, are intended only to be informative, is not an advice nor a recommendation, nor research, or a record of our trading prices, or an offer of, or solicitation for a transaction in any financial instrument and thus should not be treated as such. The information provided does not involve any specific investment objectives, financial situation and needs of any specific person who may receive it. Please be aware, that past performance is not a reliable indicator of future performance and/or results. Past Performance or Forward-looking scenarios based upon the reasonable beliefs of the third-party provider are not a guarantee of future performance. Actual results may differ materially from those anticipated in forward-looking or past performance statements. IC Markets makes no representation or warranty and assumes no liability as to the accuracy or completeness of the information provided, nor any loss arising from any investment based on a recommendation, forecast or any information supplied by any third-party.
The Kiss of Death Trade & Other Reasons for EntryFollowing up on the 2618 opportunity that we looked at on the FOREXCOM:GER40 this past weekend the market has now created more potential trading opportunities to get involved.
1) A bullish bat pattern that has completed due to a result of a complex pullback into the original double bottom.
2) A potential Kiss of Death trading opportunity
3) A bigger potential bullish gartley pattern IF the current 2618 opportunity is violated.
Please leave any questions or comments below & feel free to share your opinion on the setup.
Akil

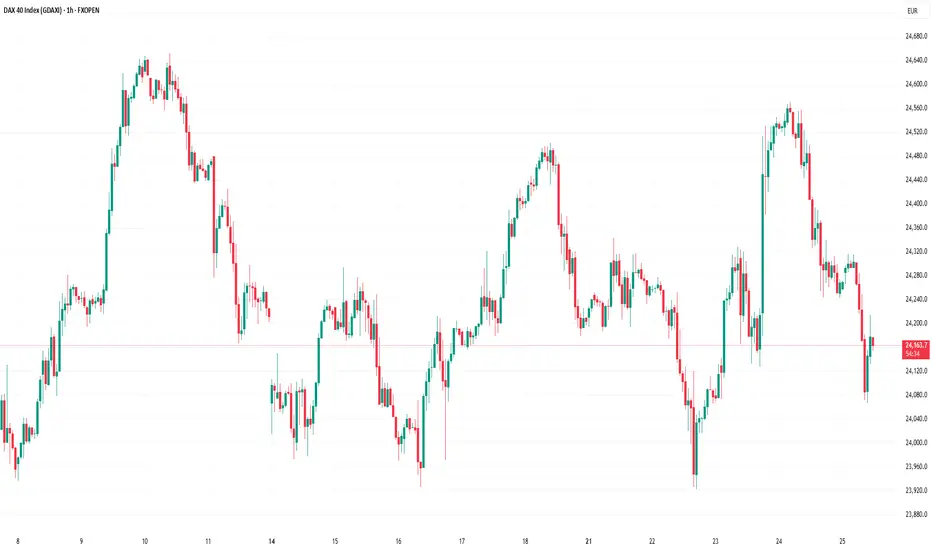
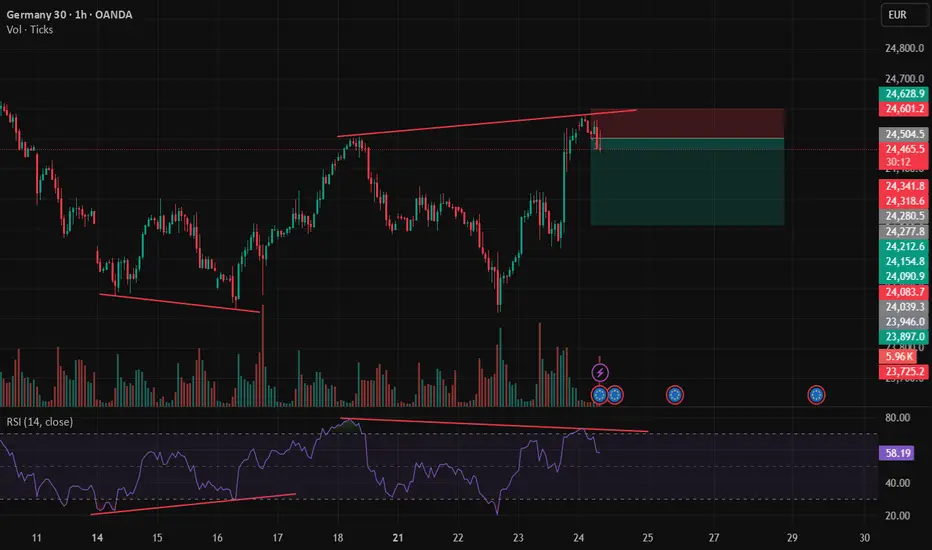
The DAX Index Is Losing Its Bullish MomentumThe DAX Index Is Losing Its Bullish Momentum
At the end of May, we noted that the German stock index DAX 40 was exhibiting significantly stronger performance compared to other global equity indices. However, we also highlighted the 24,100 level as a strong resistance zone.
Two months have passed, and the chart now suggests that bearish signals are intensifying.
From a technical analysis perspective, the DAX 40 formed an ascending channel in July (outlined in blue). However, each time the bulls attempted to push the price above the 24,460 level (which corresponds to the May high), they encountered resistance.
It is worth noting the nature of the bearish reversals (indicated by arrows) – the price declined sharply, often without intermediate recoveries, signalling strong selling pressure. It is likely that major market participants used the proximity to the all-time high to reduce their long positions.
From a fundamental standpoint, several factors are weighing on the DAX 40:
→ Ongoing uncertainty surrounding the US–EU trade agreement, which has yet to be finalised (with the deadline approaching next week);
→ Corporate news, including disappointing earnings reports from Puma, Volkswagen, and several other German companies.
Given the above, it is reasonable to assume that bearish activity could result in an attempt to break below the lower boundary of the ascending blue channel.
This article represents the opinion of the Companies operating under the FXOpen brand only. It is not to be construed as an offer, solicitation, or recommendation with respect to products and services provided by the Companies operating under the FXOpen brand, nor is it to be considered financial advice.
Ger30 on bullish Ger30 indicates a strong continuation of an uptrend on different timeframe , and the bullish bar on the support on H4 evident enough to start looking for an entry rn
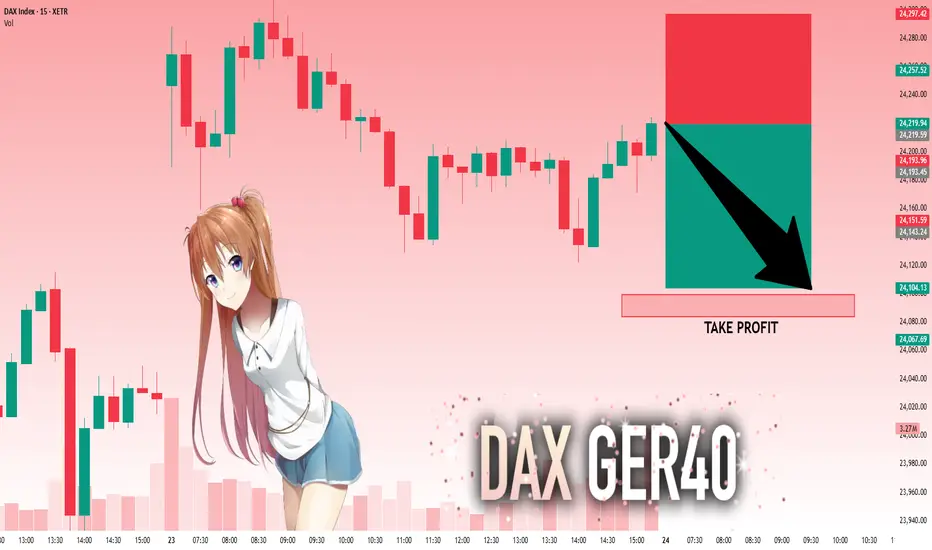
DAX: Target Is Down! Short!
My dear friends,
Today we will analyse DAX together☺️
The recent price action suggests a shift in mid-term momentum. A break below the current local range around 24,219.59 will confirm the new direction downwards with the target being the next key level of 24,099.27.and a reconvened placement of a stop-loss beyond the range.
❤️Sending you lots of Love and Hugs❤️
Double top Double top on the Dax with RSI regular divergency. If are feeling brave enough you could let this run all the way down to 24k.
How To Trade A Bullish 2618 Setup on the GER40A walkthrough of the 2618 Trading Strategy which is a secondary or more conservative way to enter a double top/bottom. In this case, due to the overall directional analysis of the Dax, this also might be a good opportunity to hop on a pullback for a larger bullish trend continuation trade.
2618 RULES
Step 1 - Look for double top or double bottom.
Step 2 - Wait for violation of peak.
Step 3 - Look for pullback into a minimum 61.8 Fibonacci retracement.
Hope you guys have a great week of trading and remember to let me know which profit target method you think you would go with.
Akil

Bearish drop?DAX40 (DE40) has rejected off the pivot and could drop to the 1st support.
Pivot: 24,312.44
1st Support: 24,094.70
1st Resistance: 24,490.38
Risk Warning:
Trading Forex and CFDs carries a high level of risk to your capital and you should only trade with money you can afford to lose. Trading Forex and CFDs may not be suitable for all investors, so please ensure that you fully understand the risks involved and seek independent advice if necessary.
Disclaimer:
The above opinions given constitute general market commentary, and do not constitute the opinion or advice of IC Markets or any form of personal or investment advice.
Any opinions, news, research, analyses, prices, other information, or links to third-party sites contained on this website are provided on an "as-is" basis, are intended only to be informative, is not an advice nor a recommendation, nor research, or a record of our trading prices, or an offer of, or solicitation for a transaction in any financial instrument and thus should not be treated as such. The information provided does not involve any specific investment objectives, financial situation and needs of any specific person who may receive it. Please be aware, that past performance is not a reliable indicator of future performance and/or results. Past Performance or Forward-looking scenarios based upon the reasonable beliefs of the third-party provider are not a guarantee of future performance. Actual results may differ materially from those anticipated in forward-looking or past performance statements. IC Markets makes no representation or warranty and assumes no liability as to the accuracy or completeness of the information provided, nor any loss arising from any investment based on a recommendation, forecast or any information supplied by any third-party.

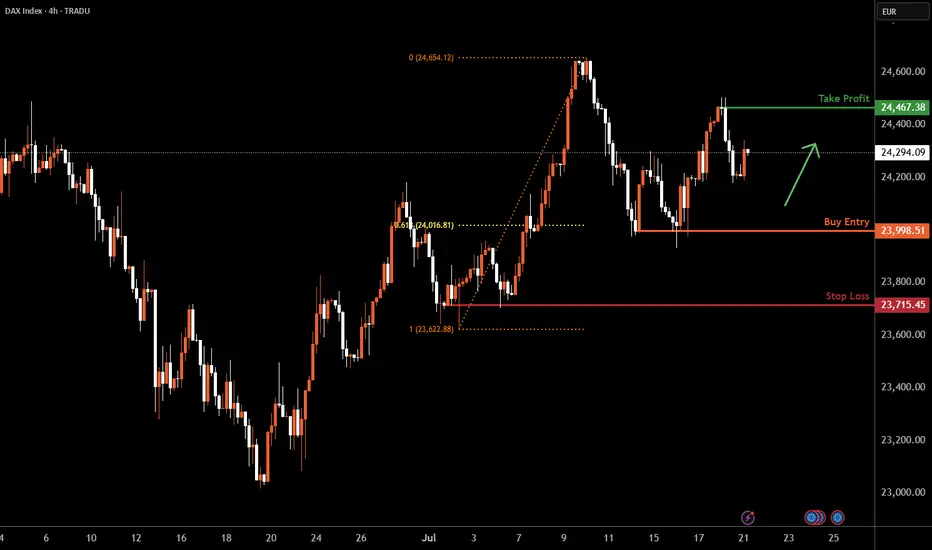
DAX H4 | Multi-swing-low support at 61.8% Fibonacci retracementThe DAX (GER30) is falling towards a multi-swing-low support and could potentially bounce off this level to climb higher.
Buy entry is at 23,998.51 which is a multi-swing-low support that aligns with the 61.8% Fibonacci retracement.
Stop loss is at 23,715.45 which is a swing-low support.
Take profit is at 24,467.38 which is a swing-high resistance.
High Risk Investment Warning
Trading Forex/CFDs on margin carries a high level of risk and may not be suitable for all investors. Leverage can work against you.
Stratos Markets Limited (tradu.com ):
CFDs are complex instruments and come with a high risk of losing money rapidly due to leverage. 66% of retail investor accounts lose money when trading CFDs with this provider. You should consider whether you understand how CFDs work and whether you can afford to take the high risk of losing your money.
Stratos Europe Ltd (tradu.com ):
CFDs are complex instruments and come with a high risk of losing money rapidly due to leverage. 66% of retail investor accounts lose money when trading CFDs with this provider. You should consider whether you understand how CFDs work and whether you can afford to take the high risk of losing your money.
Stratos Global LLC (tradu.com ):
Losses can exceed deposits.
Please be advised that the information presented on TradingView is provided to Tradu (‘Company’, ‘we’) by a third-party provider (‘TFA Global Pte Ltd’). Please be reminded that you are solely responsible for the trading decisions on your account. There is a very high degree of risk involved in trading. Any information and/or content is intended entirely for research, educational and informational purposes only and does not constitute investment or consultation advice or investment strategy. The information is not tailored to the investment needs of any specific person and therefore does not involve a consideration of any of the investment objectives, financial situation or needs of any viewer that may receive it. Kindly also note that past performance is not a reliable indicator of future results. Actual results may differ materially from those anticipated in forward-looking or past performance statements. We assume no liability as to the accuracy or completeness of any of the information and/or content provided herein and the Company cannot be held responsible for any omission, mistake nor for any loss or damage including without limitation to any loss of profit which may arise from reliance on any information supplied by TFA Global Pte Ltd.
The speaker(s) is neither an employee, agent nor representative of Tradu and is therefore acting independently. The opinions given are their own, constitute general market commentary, and do not constitute the opinion or advice of Tradu or any form of personal or investment advice. Tradu neither endorses nor guarantees offerings of third-party speakers, nor is Tradu responsible for the content, veracity or opinions of third-party speakers, presenters or participants.
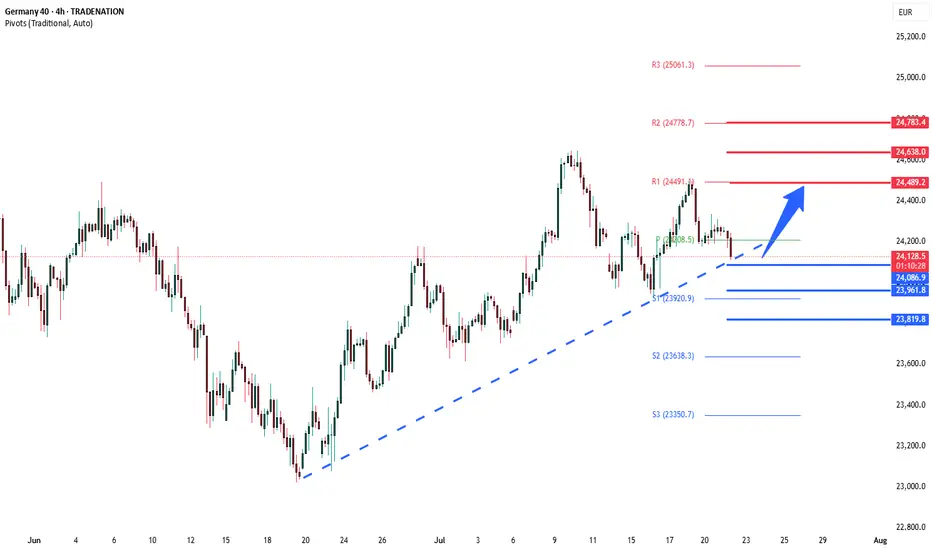
DAX40 Support retest at 24085The DAX remains in a bullish trend, with recent price action showing signs of a resistance breakout within the broader uptrend.
Support Zone: 24085 – a key level from previous consolidation. Price is currently testing or approaching this level.
A bullish rebound from 24085 would confirm ongoing upside momentum, with potential targets at:
24490 – initial resistance
24640 – psychological and structural level
24780 – extended resistance on the longer-term chart
Bearish Scenario:
A confirmed break and daily close below 24085 would weaken the bullish outlook and suggest deeper downside risk toward:
23970 – minor support
23800 – stronger support and potential demand zone
Outlook:
Bullish bias remains intact while the DAX holds above 24085. A sustained break below this level could shift momentum to the downside in the short term.
This communication is for informational purposes only and should not be viewed as any form of recommendation as to a particular course of action or as investment advice. It is not intended as an offer or solicitation for the purchase or sale of any financial instrument or as an official confirmation of any transaction. Opinions, estimates and assumptions expressed herein are made as of the date of this communication and are subject to change without notice. This communication has been prepared based upon information, including market prices, data and other information, believed to be reliable; however, Trade Nation does not warrant its completeness or accuracy. All market prices and market data contained in or attached to this communication are indicative and subject to change without notice.
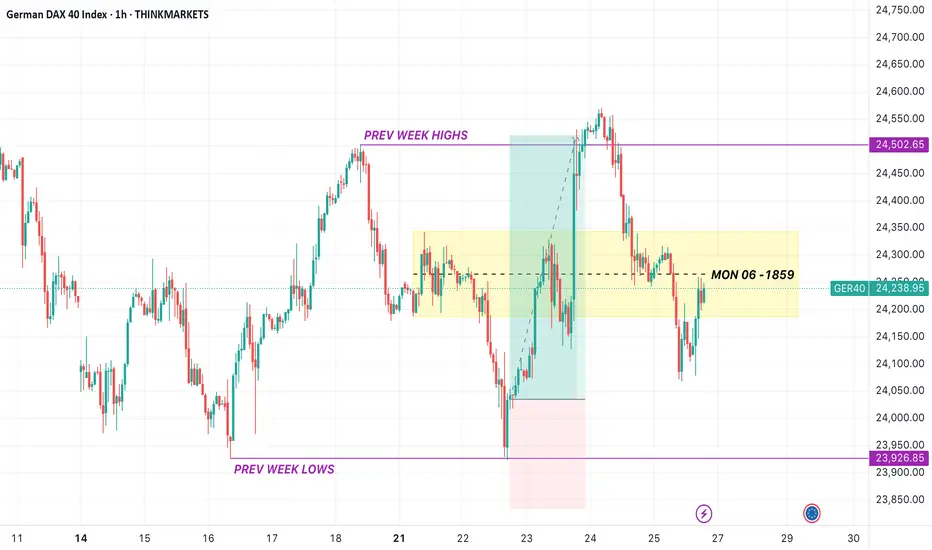
Intraday Pullback Understanding the higher timeframe is going to make a run for liquidity,
Intraday it will need to try to take out the shorters of last week.
Expecting a long on the 5m and the 15m towards Poi
Trade the plan & Plan the trade!
Trojan Trading Academy

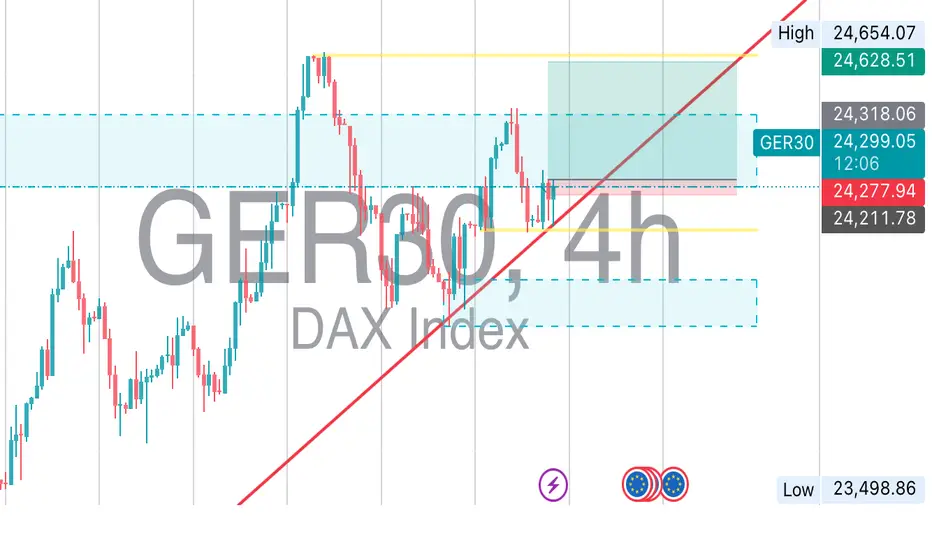
DAX / GER40: Double Long tradeGood morning traders,
I just received an alert from my LuBot Ultimate indicator of a Long signal on a good uptrend structure.
From the weekly chart I see that we are surfing on the wave of the second swing after the last bearish retracement, however on the daily the first swing has just begun after a slight minimum made in the last few days.
On the 4H this opportunity presents itself which I take advantage of in a doubly way, that is:
-I insert a trade on correction with stop at the level suggested by the indicator and TP to be defined based on the trend.
-I insert a second trade, again on correction, but with stop below the latest lows and take profit on the latest highs, the invested capital is much lower in this case in order to contain the loss but optimize any profit.
👍 If you want to see other similar posts, like/boost
🙋♂️ Remember to follow me so you don't miss my future analyses
⚠️ Disclaimer: This post is for informational purposes only and does not constitute financial advice. Always do your research before making investment decisions.
AMEX:EWG BMFBOVESPA:DAX1! FPMARKETS:GER40 PEPPERSTONE:GER40 ACTIVTRADES:GER40 XETR:DAX

DAX / DE30 Long Day TradeXETR:DAX / ICMARKETS:DE30 taking a pullback towards up, catching this pullback.
These are good levels if you trade nicely.
Use proper risk management
Looks like good trade.
Lets monitor.
Use proper risk management.
Disclaimer: only idea, not advice

Trendline BreakThe price has broken a bullish trendline followed by a pullback and now the price looks to go short
WE ONLY TRADE PULLBACKS

DowJones corrective pullback supported at 23920Key Support and Resistance Levels
Resistance Level 1: 24490
Resistance Level 2: 24640
Resistance Level 3: 24780
Support Level 1: 23920
Support Level 2: 23790
Support Level 3: 23646
This communication is for informational purposes only and should not be viewed as any form of recommendation as to a particular course of action or as investment advice. It is not intended as an offer or solicitation for the purchase or sale of any financial instrument or as an official confirmation of any transaction. Opinions, estimates and assumptions expressed herein are made as of the date of this communication and are subject to change without notice. This communication has been prepared based upon information, including market prices, data and other information, believed to be reliable; however, Trade Nation does not warrant its completeness or accuracy. All market prices and market data contained in or attached to this communication are indicative and subject to change without notice.

GER40 SELLGER40 SELL
SL & TP as shown
Entry on 24180,24160,24120
Adjust your SL accordingly
Could be a scalp trade according to your taste
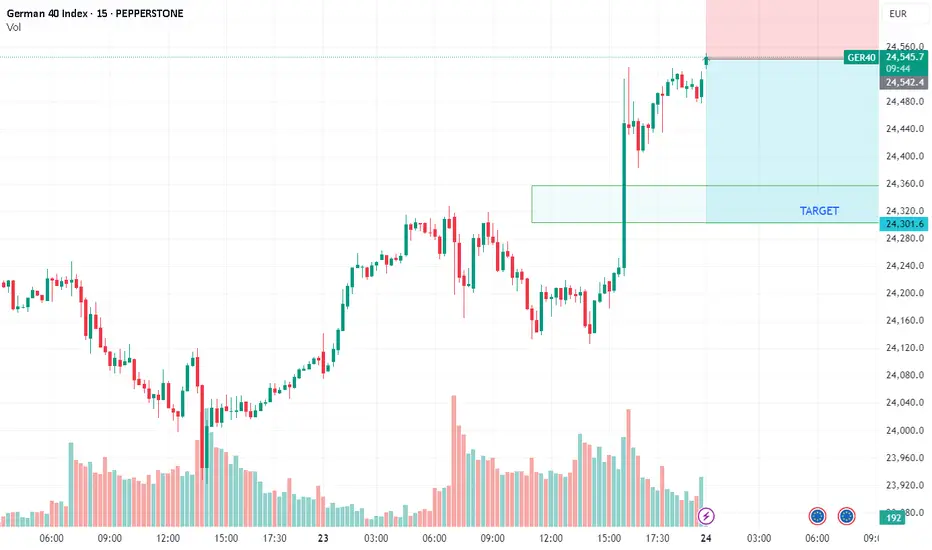
DAX/GER30 - TIME TO SHORT AT CURRENT PRICETeam, great win for the US30 on trade surplus 26 billion last month
expect to have great trade surplus over 300 billion
the Japanese went crazy 3.5% due to tariff drop from 25% down to 15%
The whole market has been pumping
We find an opportunity to SHORT THE DAX/GER 30 at the current level 24543-24556
STOP LOSS AT 24650
WITH TARGET at 24360-24320
PLEASE NOTE: once the price drop below 24500, bring stop loss to BE to protect your trade.
STICK TO THE PLAN.
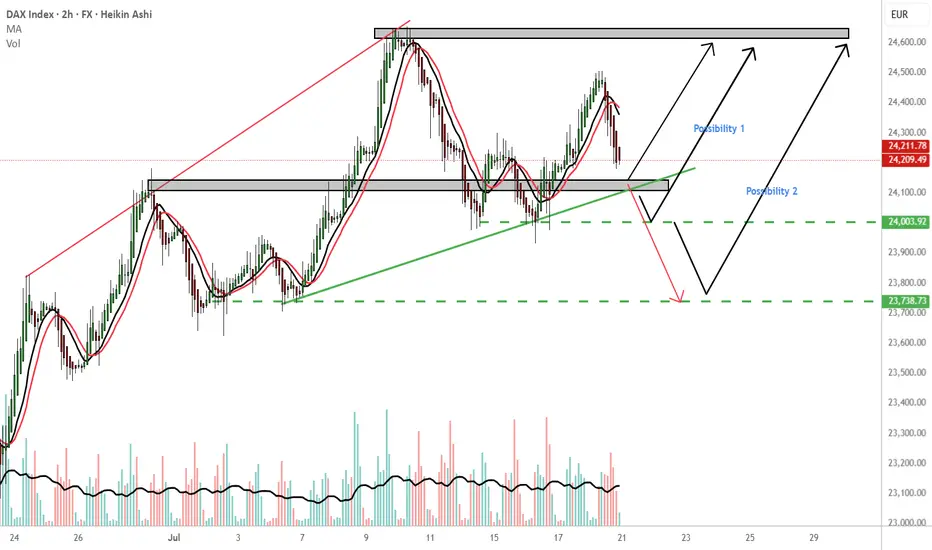
GER 30 endless possibilitiesMy most immediate outcome is reversal 24,140 price area. TP:24,600
Possibility 1: If Ger 30 holds the 24,000 price area i would consider a buy to 24,600.
Possibility 2: If Ger30 holds the 23,730 price area that would be another possibility for a buy. TP 24,600.
WCS: Worst case scenario, continuation downwards from the 24140 PL. Consider the red arrow. The 24,140 is a important price area please wait for confirmation
Please follow your trading plan.
THOUGHTS????