Meta .. (Where we stand)Long term, I think this stock is headed back to 300-400...
Short term I think it's a high chance we see 740-800...
Let me explain
Back in Feb we tagged our long term resistance, corrected and then we retested it with a lower high on the RSI (Bearish divergence) that you can see on the monthly and weekly time frame
Last few weeks Meta has pulled back while chips have pumped with good tariff news. I think Meta could be ready for another bounce here
My reasons
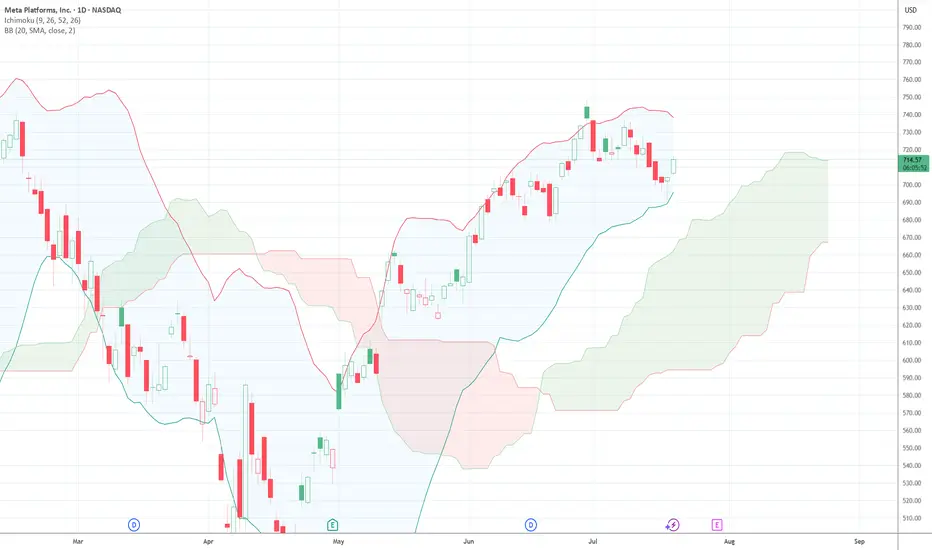
1. On the lower edge of daily Bollingerband
2. The 3-4 hour money flow is too oversold here. Last 4 times this happened, Meta mover 5-7%
3. Daily hammer candle with volume
Near the 50ema
4.
Meta closed below is 20ma at 715 also has stiff price action also at
So the best entry would be either to wait for a break over 720.00 then long it to 740-750..
Or 698-700
Meta would only be bearish immediately with a close below 680 price action and 50sma
Keep on mind googl has earnings this week and Meta will trade in sympathy on any advertising news
The best short setup long term is to wait for a test of 780-800 on the monthly trend .
FB2A trade ideas
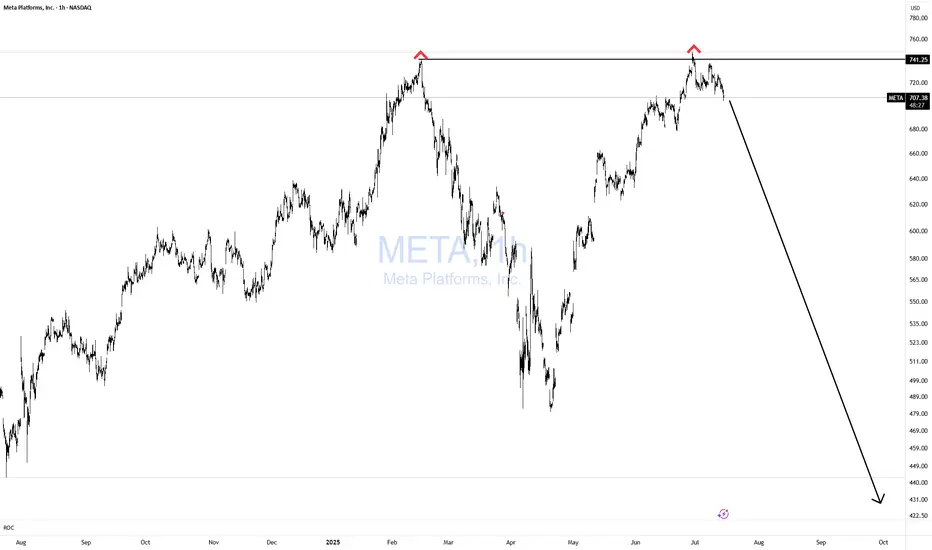
META Double Topping!Does it get any easier than this? NOPE!
If you can't spot this pattern from 1000 miles away, then you need a lot more time in the seat, training yourself in TA.
Simple with great risk reward!
Bulls GTFO!
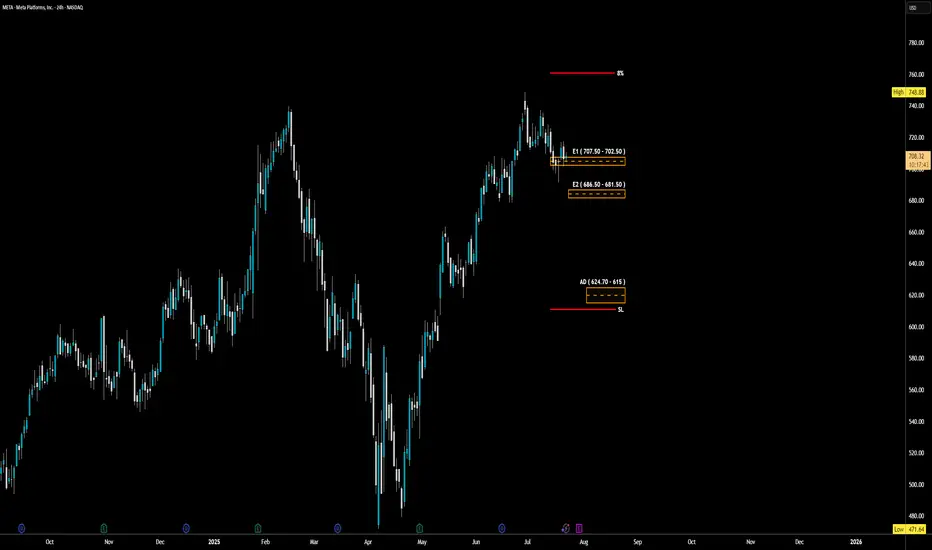
META - LONG Swing Entry PlanNASDAQ:META - LONG Swing Entry Plan
Entry Zone 1: $707.50 – $702.50
→ Open initial position targeting +8% from entry level.
Entry Zone 2: $686.50 – $681.50
→ If price dips further, average down with a second equal-sized entry.
→ New target becomes +8% from the average of Entry 1 and Entry 2.
Edit Zone (Aggressive Demand): $624.70 – $615.00
→ If reached, enter with double the initial size to lower the overall cost basis.
→ Profit target remains +8% from the new average across all three entries.
Risk Management:
Stop Loss:
Risk is capped at 12% below the average entry price (calculated across all executed positions including the Edit Zone).
Position Sizing Approach:
Entry 1: 1x
Entry 2: 1x
Edit Zone: 2x
→ Total exposure: 4x
→ Weighted average determines final TP and SL calculations.
______________________________________
Legal Disclaimer
The information provided in this content is intended for educational and informational purposes only and does not constitute financial, investment, or legal advice or recommendations of any kind. The provider of this content assumes no legal or financial responsibility for any investment decisions made based on this information. Users are strongly advised to conduct their own due diligence and consult with licensed financial advisors before making any financial or investment decisions.
Sharia Compliance Disclaimer: The provider makes no guarantees that the stocks or financial instruments mentioned herein comply with Islamic (Sharia) principles. It is the user’s responsibility to verify Sharia compliance, and consultation with a qualified Sharia advisor is strongly recommended before making any investment decisions
META CANT KEEP THE HULK DOWN!!!!META has been consolidating for a few weeks now, but it's still in this bull flag that looks like it might break out soon, hopefully before earnings on Wednesday, July 30. I love technical analysis on charts, and this inverse head and shoulders pattern has been effective on most semiconductor names lately. We will know for sure next week.

New Setup: METAMeta is now setting up for a potential bounce now. If the Markets can be positive tomorrow, we should see Meta also participate.

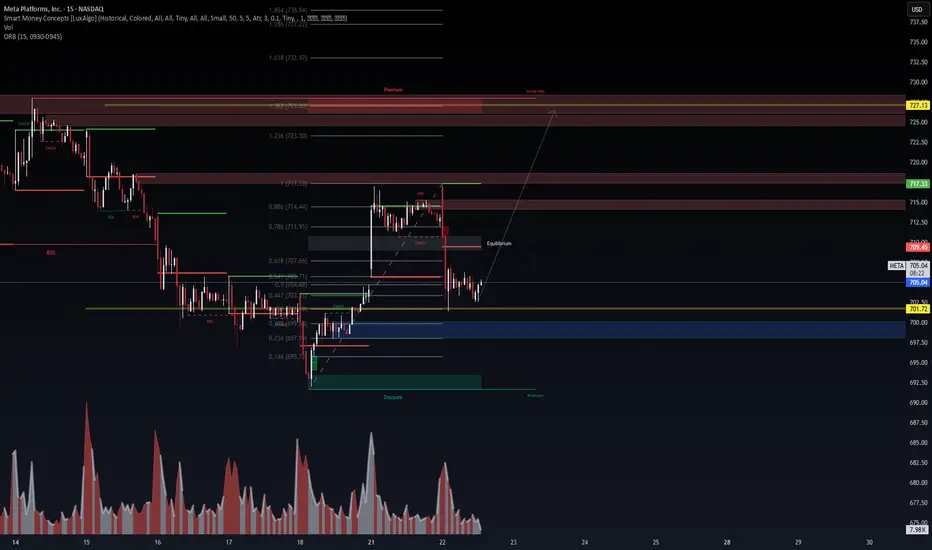
META: That weird drop looks like it was planned :P📊 META (15M) | Smart Money Concepts Setup
🔍 Powered by VolanX Protocol | WaverVanir International LLC
META is showing signs of reclaiming equilibrium after a clear CHoCH -> BOS -> EQH sweep. Price tapped into a premium inefficiency zone and is now consolidating at the equilibrium of the latest impulse leg, suggesting a potential long opportunity.
🧠 Thesis:
Order Block + EQH rejection aligns with a key Fibonacci confluence zone.
Strong demand sits near the 701.72–700.00 area.
Bullish continuation setup toward:
TP1: 717.33 (ORB + EQH target)
TP2: 727.13 (1.382 Fib extension + liquidity sweep zone)
⚠️ Risk Management:
Invalid if price closes below 697.00 (Discount OB)
Ideal entry near 703–705 with confirmation (candle body close over 707.66 Fib)
🛡 VolanX Score: High Confluence | SMC + Fib + Volume Spike
📈 Watching for a bullish engulfing or clean mitigation inside the OB for confirmation.
📎 For educational purposes only – not financial advice.
#VolanX #WaverVanir #META #OptionsFlow #SMC #Fibonacci #SmartMoney #TechStocks #TradingView
Stocks SPOT ACCOUNT: META Shares Buy Trade with Take ProfitStocks SPOT ACCOUNT:
NASDAQ:META shares: my buy trade with take profit.
This is my SPOT Accounts for Stocks Portfolio.
Trade shows my Buying and Take Profit Level.
Spot account doesn't need SL because its stocks buying account.
Looks good Trade.
Disclaimer: only idea, not advice

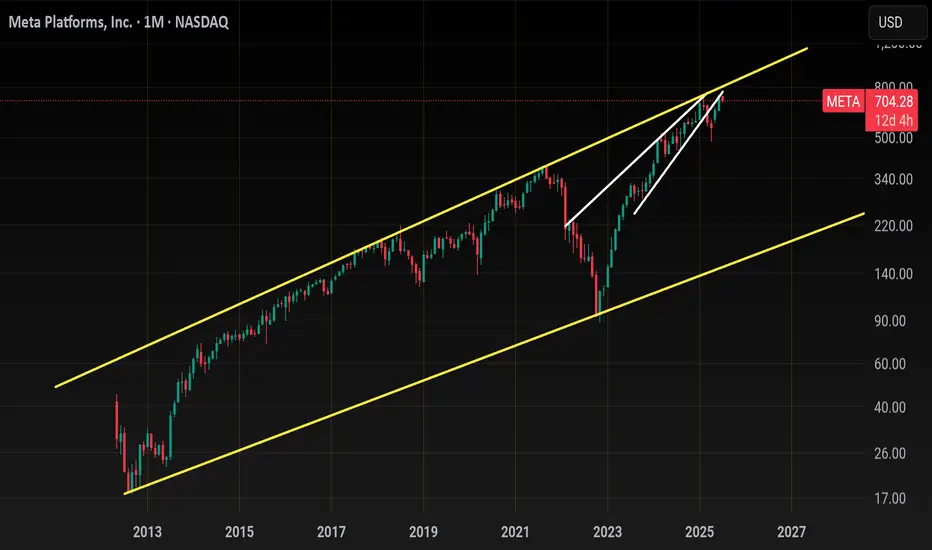
Meta - The breakout in question?🪓Meta ( NASDAQ:META ) is retesting major structure:
🔎Analysis summary:
After Meta perfectly retested a major previous support trendline in 2022, the trend shifted bullish. We have been witnessing an incredible rally of about +700% with a current retest of the previous all time highs. Time will tell but a bullish breakout remains quite likely.
📝Levels to watch:
$750
🙏🏻#LONGTERMVISION
Philip - Swing Trader

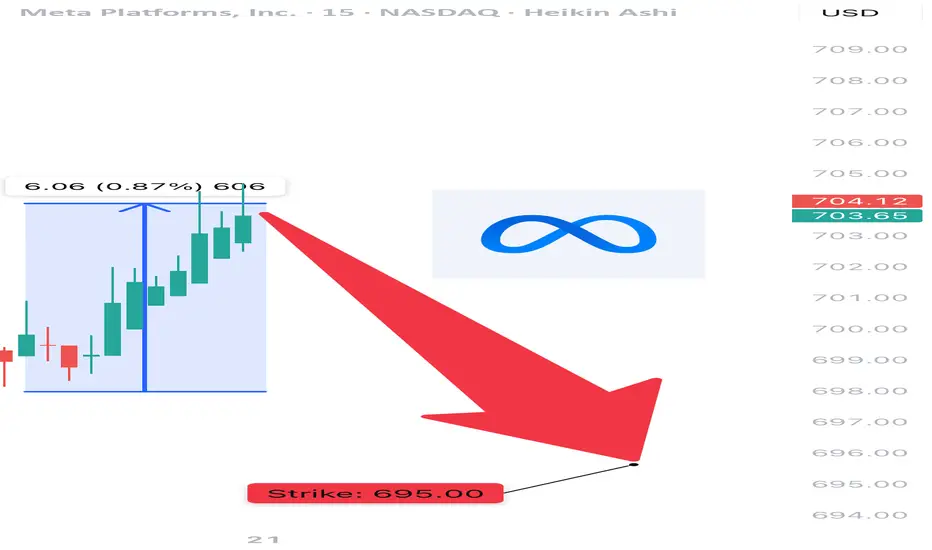
META Bearish Swing Alert – Bear in Hiding? Watch for Breakdown B
🔻 NASDAQ:META Bearish Swing Alert – Bear in Hiding? Watch for Breakdown Below $690 🐻
📅 Posted: July 18, 2025
💡 All models say “bearish,” but volume is the wildcard. Tight play, big potential.
⸻
🧠 AI Consensus Summary: Bearish But Not Triggered
Model Bias Key Notes
Grok 🐻 Bearish RSI 40.5, weak volume, neutral options flow. No clear flow bias.
Claude 🐻 Bearish Same indicators. Recommends conditional entry.
Gemini ⚠️ Bearish Wait Bearish bias but no trigger yet due to low volume.
Llama 🐻 Cautious Bear Trade only if breakdown below $678 with volume.
DeepSeek 🐻 Bearish No bull signals. Neutral options flow confirms low conviction.
⸻
⚙️ Setup Details – META Naked Put
🎯 Strike: $695.00
📅 Expiry: August 1, 2025
💰 Entry Price (Premium): $22.70
💵 Profit Target: $30.00
🛑 Stop Loss: $14.00 (~40% of premium)
📏 Contract Size: 1
📈 Confidence Level: 70%
⏰ Entry Timing: Market open — only if price breaks below $690 with volume confirmation
🕒 Signal Timestamp: 2025-07-18 @ 10:54 AM EDT
⸻
🔍 Why This Works
• ✅ Technical Trend: RSI < 45, negative 5-day/10-day momentum
• 🧊 Options Flow: Flat — no bullish bias = clean downside setup
• 🧨 Trigger Level: Breakdown below $690 = institutional exit confirmed
• ⚠️ Key Caveat: Weak volume = don’t front-run the breakdown
⸻
📌 Levels to Watch
• ⚠️ Breakdown Confirm: Below $690 with volume > 1.25x
• 🧱 Target Zone: $678 support
• ❌ Invalid If: Bounces back over $705 on volume
⸻
🚨 Risk Warning
This isn’t the “all-in” moment — it’s a sniper trade.
No volume = no entry. Tight stop. Fast hands. Smart size.
⸻
📊 TRADE SNAPSHOT
{
"instrument": "META",
"direction": "put",
"strike": 695.0,
"expiry": "2025-08-01",
"confidence": 0.70,
"profit_target": 30.00,
"stop_loss": 14.00,
"size": 1,
"entry_price": 22.70,
"entry_timing": "open",
"signal_publish_time": "2025-07-18 10:53:53 UTC-04:00"
}
⸻
🔁 Follow for more AI-backed trades
💬 Is META breaking down — or faking out?
👀 Drop your entry thoughts in the comments.
7/3/25 - $meta - Still a buy sub $1k/shr7/3/25 :: VROCKSTAR :: NASDAQ:META
Still a buy sub $1k/shr
- reality is, why would you bet against zuck
- his platforms are hitting on all strides. he is willing to internally build the best AI when he's falling behind by hiring the best talent and it is a LOT cheaper to hire for collectively $500 mm than say pay billions for a developed product and internalize it. great move Zuck!
- and their ad tools are second to none and don't suffer as much from "Google search" narrative as the ecosystem is one of those that's incrementally chipping away from Google.
- at mid 20s + PE, the stock is not "cheap" but it's actually quite affordable for the environment we're in
- some market POV: I think we've seen the "garden variety" pullback already. believe it or not... when you look at the individual names from recent highs, we've seen a lil 3 to 10% shuffle and not all on the same day (take for instance the TSLA dip the other day, large, and not on a day where nasdaq or other Mag7's were red).
- i continue to see small caps failing on large cap peers
- i see more money still floating lager caps higher at the expense of small caps, even tho it might look the opposite in the immediate term (this is a story as old as time... newbs chase quick thrills, get squashed and can afford less of the assets they should be buying to begin with). so word to the wise: if you've made some nice tendies lately on slightly more degen plays... buying stuff like Mag7's or even indices at highs is not necessarily a "bad" buy.
- anyway i like NASDAQ:META at sub $1k and sub 35x PE into the print
- would like to own more, so would be buying dips
- but think this is a winner in 2H
V

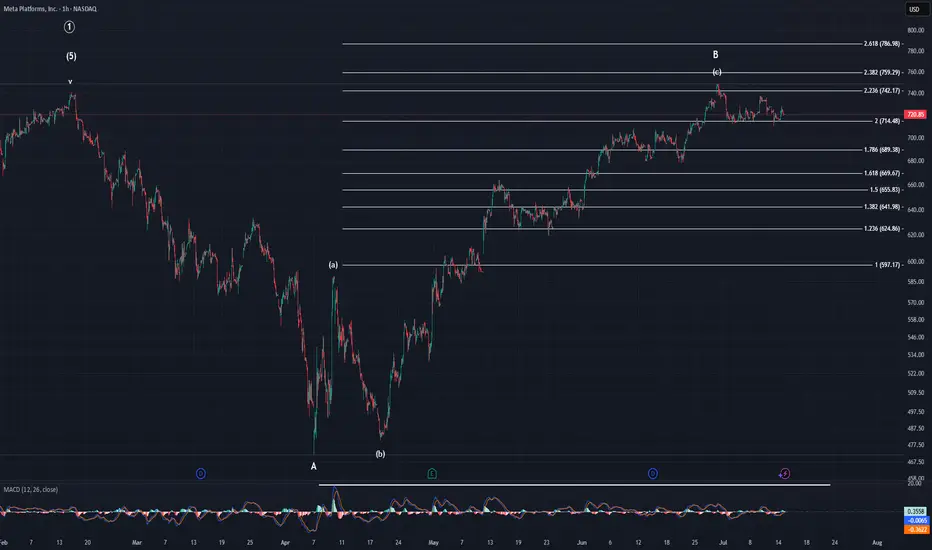
MetaSince the last post I made price has yet to make a new high. It has managed to chop in this area with a slight downward bias. If we're on the verge of the top of the indices, there is no reason to think Meta will continue higher much longer. This pattern, which is clearly corrective in nature, is way overextended. We started off with a 3-wave move higher off the April low and have risen all the way to the 2.236. Even if you could somehow say this is impulsive, it would still be over extended. So, no matter how you look at this pattern, it is in need of a correction. The question is how will that correction look. IMO, it will look like a minor C wave of intermediate (A). However, if it is somehow impulsive, then it would look like either minor A just now starting, or a smaller degree wave 2.
Is Meta breaking down?It's too early to tell. But investors need to keep an eye out for key support levels at $680 - $700
META | Accumulation Zone Identified — Road to $990?🧠 META | Accumulation Zone Identified — Road to $990?
📊 Ticker: META (Meta Platforms Inc.)
🕒 Timeframe: 1H
📍 Current Price: $717.36
📈 Bias: Bullish accumulation → Expansion
🔍 WaverVanir DSS Thesis
Our system has flagged a liquidity harvesting and accumulation phase between $676–$740. Institutional behavior suggests price is returning to equilibrium before a potential reaccumulation and markup.
🔑 Key SMC Zones:
🔺 Premium Zone: $729–$740 — recent rejection + liquidity engineered
🔻 Discount Zone: $676–$696 — ideal accumulation range
🔵 Equilibrium Pivot: ~$705
🟦 Volume Cluster: $716–$718 → short-term magnet and likely chop area
📐 Fibonacci Confluence:
0.786 Fib = $729.37 (converging with premium zone)
1.272–1.618 extensions → Targets = $870, $990+
0.618 retracement = $676.60 — deep discount level
🚨 VolanX Execution Logic:
Wait for sweep + displacement below $700
Watch for internal BOS + higher low formation
Confirmed entry above $729 = breakout of accumulation
Scale-out zone: $870 → $990+
🧬 Trade Strategy:
Leg Action Level Risk
A Accumulate $680–$705 Low
B Confirm Break $729+ Medium
C Profit Zone $870 / $990 High reward
⚡ Alpha Outlook: META is in a controlled markup with engineered pullbacks. This is where narratives shift, and the smart money loads. VolanX signals strong alignment with SMC zones — this may be a high-conviction multileg long.
#WaverVanir #VolanX #META #SmartMoney #TradingAlpha #SMC #Accumulation #Gamma #OptionsFlow #LSTM #DSS #AITrading #TechStocks #GrowthEquity #Fibonacci #TradingView

META WEEKLY TRADE SETUP – JULY 25, 2025
📈 META WEEKLY TRADE SETUP – JULY 25, 2025 📈
🔥 Institutional Bulls Are In Control — 3.05 C/P Ratio!
🚨 BUT — It’s 0DTE Friday, so don’t get caught in gamma fire.
⸻
🧠 Model Consensus:
✅ All Models = STRONG BULLISH
⚠️ Entry Timing: Monday preferred (due to gamma + time decay)
📉 Volume still weak = caution on conviction
⸻
🔍 META Flow Stats:
• 🟢 Calls: 65,379
• 🔴 Puts: 21,409
• 📊 C/P Ratio: 3.05 = Institutional bulls stepping in hard
⸻
✅ RECOMMENDED TRADE – PLAN FOR MONDAY
🎯 Instrument: META Call Option
🟢 Strike: $720
📅 Expiry: August 1, 2025
💵 Entry Price: $0.97
💰 Profit Target: $1.45
🛑 Stop Loss: $0.49
⚖️ Confidence: 75%
🕒 Entry Timing: Market open Monday
⸻
⚠️ TRADE NOTES:
• Don’t enter on Friday – too much gamma risk
• Wait for volume confirmation Monday morning
• Expect short-duration swing (hold 3–5 days max)
⸻
📊 Smart money is bullish, timing is everything.
👍 Like & Follow if META is on your radar!
#META #OptionsTrading #0DTE #GammaSqueeze #BullishSetup #TradingView #WeeklyOptions #TechStocks

META Slows Down For A Correction Within UptrendMeta has seen a strong recovery recently, but barely retested February highs around 740, from where we can see some nice pullback, but it appears corrective, since it’s unfolding in three waves, and forming a potential bull flag — likely wave 4. A breakout above the downward channel on a daily close could signal the start of wave 5 and a push to new highs.
However, keep a close eye on the 666.1; a break below this level would invalidate the bullish view and suggest a deeper consolidation phase may follow.
Highlights:
Direction: Up (pending breakout)
Structure: Wave 4 bull flag; wave 5 possible soon
Support: 680 / 690

META Double Top? Think Again. Hello, my name is The Cafe Trader.
As part of our MAG 7 Series, we tackle META next on the list.
This article is for:
– Long-Term Investors
– Long-Term Hedges
– Swing Traders
– Options Traders
⸻
Brief Notes:
1. Meta is going all-in on AI, integrating it across all platforms (Instagram, Facebook, WhatsApp…).
2. 97% of Meta’s revenue still comes from ads. They’ve rebounded strongly from Apple’s policy changes—thanks in large part to AI targeting.
3. Meta is thinking long-term with AR/VR.
4. International user growth has exploded.
Conclusion: Bullish winds continue to blow behind META.
⸻
Long-Term Levels
• Aggressive Buy = $701.59 → Marked as “Top of Demand.” This is where aggressive buyers are looking to add.
• Good Value = $626–$635 → Marked “Bottom of Demand.”
• STEAL = $496–$501 → Marked “Extreme Demand.”
Why not buy at the ‘Heavy Demand Zone’?
Great question. If bears take out those buyers above this zone, it suggests something major has shifted in sentiment around META.
Even though there’s heavy demand here, I’d want to observe how sellers approach the area. You’ll likely get multiple chances to enter if buyers defend it. But if it breaks down, the best pricing lies at “Extreme Demand.”
For long-term holders looking to hedge downside, I suggest a Bear Put Spread or outright puts. More on this under the Red Scenario Options.
⸻
For Traders
Let me be real—this chart is tricky.
The V-shaped recovery signals strong bullish interest. That insane rally took out a major seller, further fueling the bulls.
That said, how we pulled away from the previous ATH (all-time high) shows weakness—low buying interest, followed by a real seller stepping in.
So yeah, I’m mixed on sentiment. But I’m confident in identifying liquidity and managing exits fast.
⸻
Two Scenarios
✅ Green Scenario
– Stock:
The bounce off “Top of Demand” is a strong bullish signal. Bears will be under pressure around $729, though I expect one more rejection before we break through.
I liked the original entry at “Top of Demand.” If entering again, I’d wait for a crack below that zone and watch the close—if we recover and close above it (especially if the dip was deep), that’s a strong signal to re-enter.
Target: take partial or full profits around $729. Hold the rest for highs or a breakout.
– Options:
If you can grab the 715 Calls with 3–5 days out for under $4.50, this setup could easily hit 2–3R.
Even better if you can get closer-to-the-money contracts for cheaper.
⸻
❌ Red Scenario
– Stock:
I believe this “new seller” is a fabricated seller—likely to get squeezed.
But if no new buying interest shows up to challenge that seller, we could see pressure on “Top of Demand” and a legit correction, maybe even a broader consolidation range.
Next few days will reveal the strength of buyers.
If no aggressive buying steps in, I like the short setup, targeting “Bottom of Demand” for TP.
– Options:
Long-Term Holders:
Use 2–3% of your META share value on a Bear Put Spread or put options.
If using puts, get 2–3 weeks of time. Go as close to the money as your risk allows.
Active Traders:
This could move fast if it plays out. If you can grab a 710 Put with 3–5 days for under $1.00, hold until a big red candle (3–5%) forms.
If it keeps dragging down, roll into a new contract the following week.
⸻
Follow for more analysis and updates — and as always,
Happy Trading.
📲 @thecafetrader

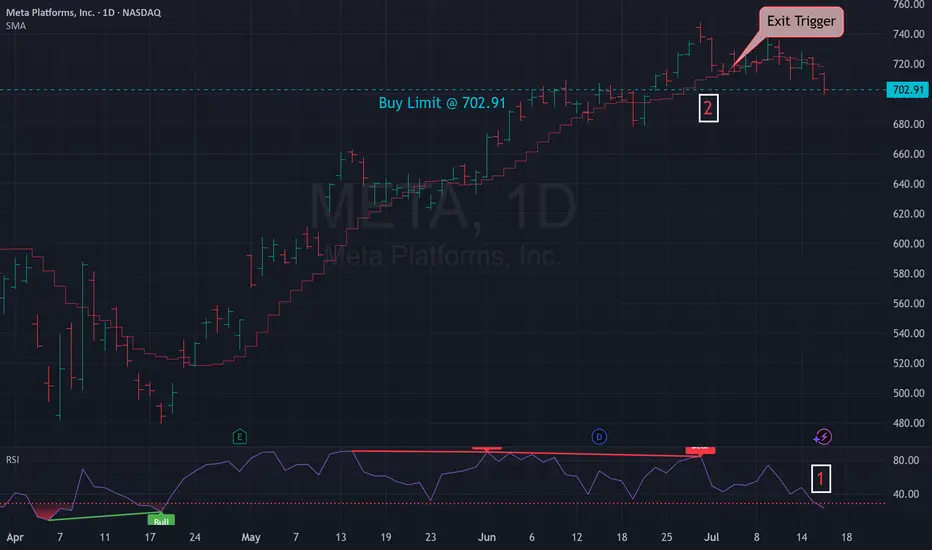
Mean Reversion Trade: META1. RSI in oversold region
2. Price likely to rebound back the the mean
Trade Rules:
Entry Trigger - RSI has cross below oversold region, enter limit buy at close price
Exit Trigger - Close at market when close price cross above exit trigger (Red step line)
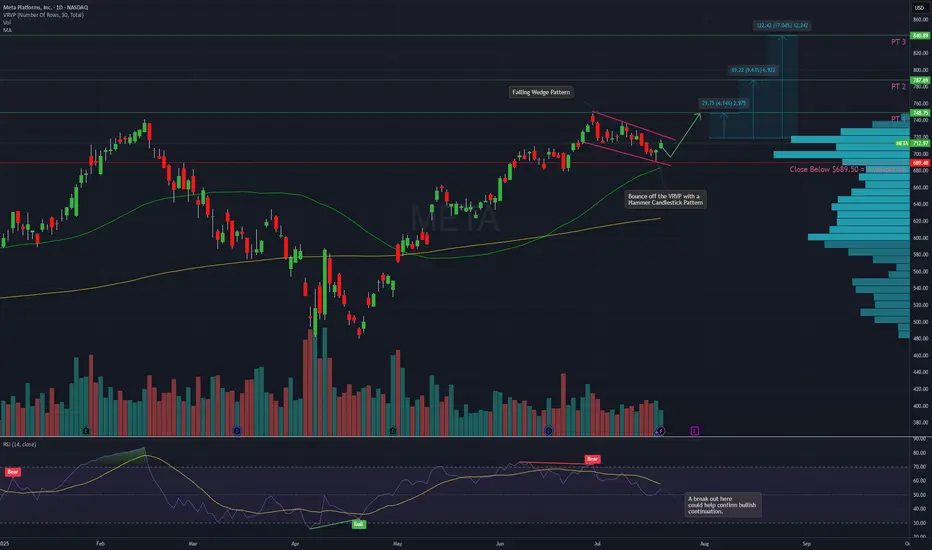
META – Falling Wedge Breakout Setup with Strong Risk/RewardDescription:
Meta (META) has been consolidating within a textbook falling wedge pattern, now showing signs of a potential breakout and bullish continuation.
Price Action Highlights:
Multiple rejections near 748 resistance
Recent bounce off the high-volume node on the VRVP with a hammer candlestick pattern
Holding above the 50-day moving average
RSI showing signs of reversal, approaching a key trendline breakout
Bullish Signal Criteria:
A breakout above the 720–725 range confirms wedge breakout
Watch for volume expansion to validate the move
Targets:
PT1: 748
PT2: 787
PT3: 840
Invalidation Level:
Close below 689.50 invalidates the setup
This setup offers a clear structure for continuation with well-defined risk levels and upside potential. Monitoring volume and RSI confirmation will be critical in the coming sessions.
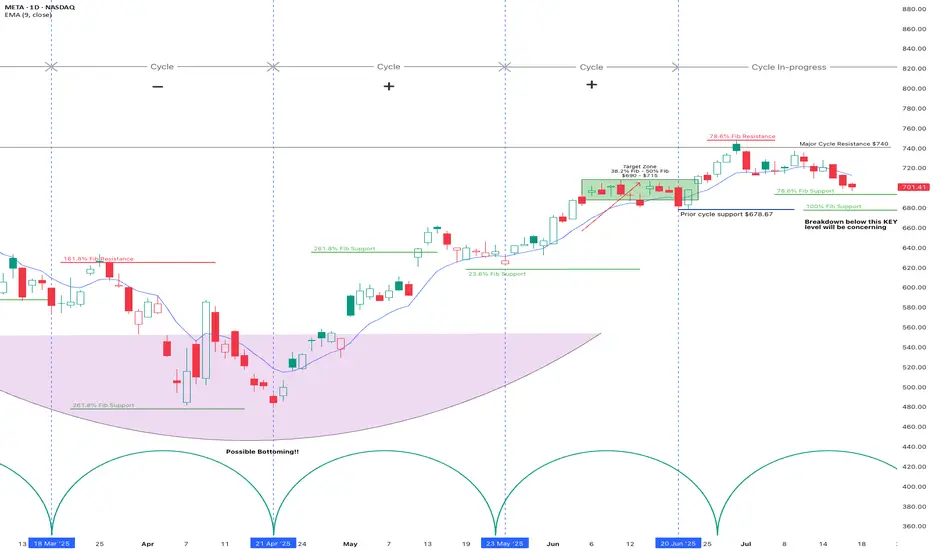
Meta Stock Risks Breakdown Amid Slowing Growth and Rising CostsMeta (NASDAQ: META), the parent company of Facebook, will report second-quarter 2025 results on Wednesday, 30 July, after the close of trading in New York. The social media giant is expected to report that earnings growth slowed to 14.2% to $5.89 per share, as revenue growth decelerated to 14.4%, reaching $44.7 billion. CAPEX is expected to more than double from a year ago, increasing to $17.5 billion from $8.1 billion.
For the third quarter, analysts expect the company to guide revenue to $46.0 billion. CAPEX for full year 2025 is forecast at $64.7 billion. The options market is pricing in a post-earnings move of about 6.5%.
The stock has formed a potential 2B top reversal pattern when it briefly rose on 30 June, closed above the high seen on 14 February, but was unable to maintain it. Now, the stock has fallen below an uptrend that began on 1 May, as well as below technical support at around $705. Meanwhile, the Relative Strength Index has rolled over, suggesting momentum has shifted from bullish to bearish. There is considerable technical support for Meta between $680 and $700 per share, and a move below that support region could lead to the shares falling below $600 over time.
From an option gamma perspective, $700 appears to be the put wall, which also suggests there is solid support around this level. However, the overall call delta values are high, indicating that the options market is very bullish. Therefore, after the company reports, it is possible there could be significant call value decay, leading to the unwinding of hedges and potentially pushing shares below the $700 support region. However, if the stock can hold support at $700, it stands a chance to move higher towards the call wall at $750 and potentially as high as $800.
Written by Michael J. Kramer, founder of Mott Capital Management.
Disclaimer: CMC Markets is an execution-only service provider. The material (whether or not it states any opinions) is for general information purposes only and does not take into account your personal circumstances or objectives. Nothing in this material is (or should be considered to be) financial, investment or other advice on which reliance should be placed.
No opinion given in the material constitutes a recommendation by CMC Markets or the author that any particular investment, security, transaction, or investment strategy is suitable for any specific person. The material has not been prepared in accordance with legal requirements designed to promote the independence of investment research. Although we are not specifically prevented from dealing before providing this material, we do not seek to take advantage of the material prior to its dissemination.
$META Day Trade Update | 15m TF📈 NASDAQ:META Day Trade Update | 15m TF
VolanX DSS framework still intact. Price broke out cleanly from a descending triangle, retested the breakout zone near 713.8, and is now stabilizing above 714.6. We’re printing a bullish structure with momentum building toward:
🎯 Primary Target: 725.99
🧠 Fib Levels in Play:
0.618 = 711.47 (support held)
0.786 = 713.89 (pivot zone)
1.618 = 725.99 (target in sight)
📌 Key Observations:
Retest successful, no wick violation below triangle
Volume holding steady post-breakout
RSI/MACD divergence resolved on lower TFs
If momentum sustains, META may front-run 725 with a sweep into 728–731.5 extension. We’ll adapt based on order flow and price action near 722.5 resistance.
📡 Protocol: VolanX DSS | SMC + Fib + Triangular Structure
🔁 Still stalking. Exit at 725 or scale-out from 722 based on intraday momentum.

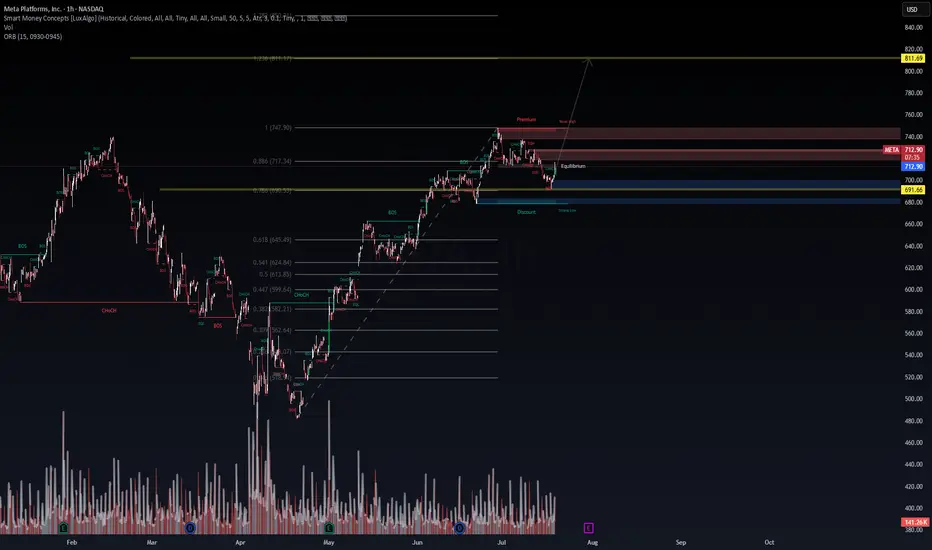
META – Institutional Buy Setup Active | VolanX Protocol Update📡 META – Institutional Buy Setup Active | VolanX Protocol Update
🧠 Price Intelligence Framework: WaverVanir DSS
The institutional model forecasts META to reach $760.64 in the next 15 trading days with a 95% confidence interval between $748.81 – $762.83. Signal is confirmed by 9/9 bullish model consensus.
🔍 Smart Money Concepts (SMC)
Price is rebounding from Equilibrium Zone (~$712.98) after discount mitigation. Liquidity structure favors bullish continuation toward:
🎯 Target 1: $727.63
🎯 Target 2: $760.64
🏁 Extended Target: $811.69 (1.272 extension)
📉 Risk Parameters (From DSS):
Entry: $713.36
Stop: $684.68 (4.0% risk)
Risk/Reward: 1.65:1
Volatility: 1.54% (low)
Capital Allocation: 25% of strategy layer
📈 Options Flow Validation:
Unusual activity observed across $720–$750 calls (Jul 25–Aug 22). Institutions are loading positions aggressively with >$2M notional in call sweeps.
Thesis: META is in an SMC bullish structure with alignment from AI forecasting, liquidity mapping, and options flow. VolanX Protocol confirms directional probability with low variance risk.
📌 Watch zone: $760 → $811
📌 Increased momentum if $717.34 (0.886 Fib) breaks cleanly
📌 Invalidation on close below $684
#META #VolanX #WaverVanir #SmartMoneyConcepts #OptionsFlow #TradingView #AITrading #InstitutionalSignals #Fibonacci #BreakoutSetup #LSTMForecast #TechnicalAnalysis
$META Cup & Handle? Wish I would have posted this pre market but I still like it for this week. Tapped the bottom band and it's bouncing and getting really tight now. Looks like a cup and handle near the all time high.
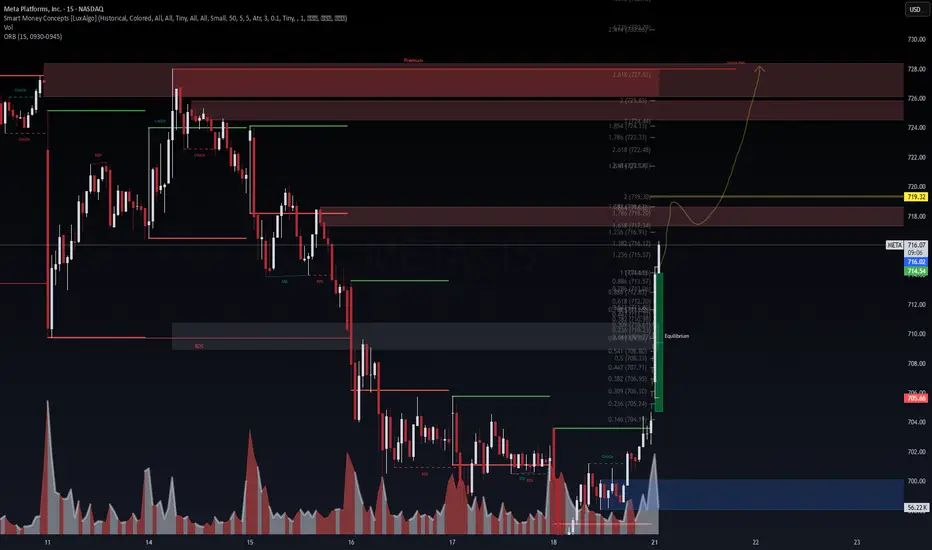
META 15M | Daytrade Setup – VolanX Protocol📈 META 15M | Daytrade Setup – VolanX Protocol
NASDAQ:META just delivered a high-confidence Break of Structure (BOS) + Change of Character (CHOCH) confluence off a low-volume sweep near the Equilibrium Zone (~$704).
Key Signals (VolanX Protocol):
✅ Smart Money Accumulation confirmed at blue demand zone
✅ Strong impulsive candle post-CHOCH (Volume Spike + Displacement)
✅ Fibonacci extensions line up with institutional targets:
📍 1.618 → $718.28 (First liquidity grab zone)
📍 2.0 → $719.30 (Equilibrium breakout target)
📍 3.618 → $727.62 (Full range sweep + premium zone)
🎯 Trade Thesis:
Targeting $719–$727 based on liquidity engineering and algo sweep probabilities.
🧠 VolanX Probability Curve:
📊 Move to $719.3 = 78% (aligned with 2.0 fib and historical rejection level)
📊 Move to $727.6 = 62% (final premium zone; sweep of June supply + “Strong High”)
⚠️ Retrace to $710.8 = 40% (retest demand or shakeout)
⏱️ Valid only for 07/21 NY session unless full structure invalidated.
💡 This setup reflects institutional liquidity dynamics governed by VolanX Smart Flow model. All insights are educational and part of the DSS framework.
🔁 Stay adaptive. Monitor BOS/CHOCH sequences. VolanX protects capital through real-time recalibration.
#WaverVanir #VolanX #META #DayTrade #SMC #DSS #AITrading #LiquidityHunt #VolumeProfile #TechStocks #TradingView