KHC 28/02/2022 LongAsset and Time frame -2W, KHC
Entry Price - 39.13
Exit(Stop Loss) 36.98
Exit(Take Profit) -49.13
Technical Analysis - Price has bounced from the bottom of the up-trending channel after a previous higher high was made and overbought on 2W chart.
We have the 2W 100 MA as support + very decent volume and an engulfing bullish pattern.
Volume √
Pattern √
Structure √
RSI √
Good Luck
KHNZ trade ideas


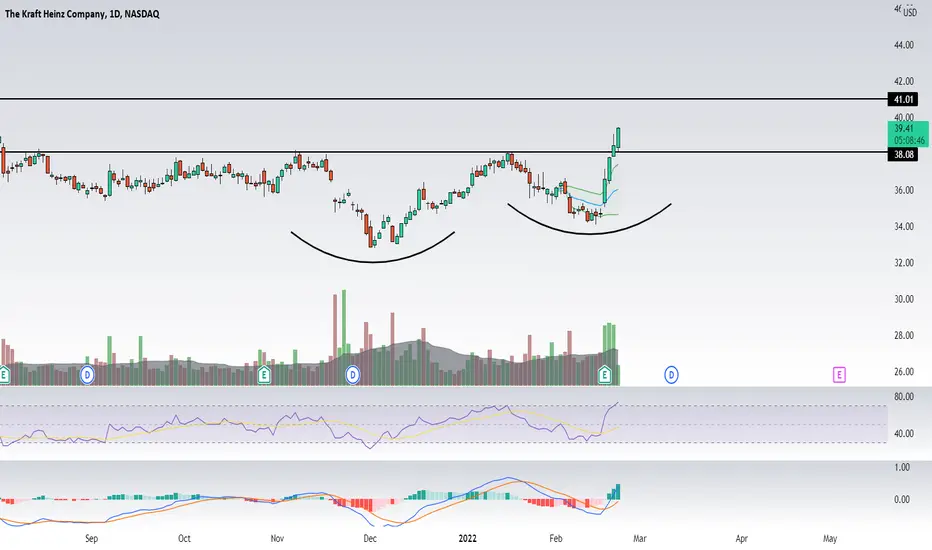
kraftbullish push today, a bit extended but even a pull back support retest at 37.62 could be a solid dip buy. ill be setting alerts for tomrrow to watch this guy

$KHC long idea Kraft Heinz reported earnings recently and raised guidance. The multinational foods giant increased its long-term growth targets for organic net sales to between 2% and 3%, from 1% to 2% previously. It also raised the long-term adjusted earnings per share growth target to 6% to 8%, from 4% to 6% previously.
Kraft Heinz falls under the consumer staple category which could be looked at as a safe haven during this inflation period and higher rate environment. A company that projects itself to grow during times of uncertainty and continues to pay a dividend shows real confidence. Hard not to be confident when almost every American has your product in their pantry.
The technical side of Kraft Heinz shows some real accumulation via volume indicator on the daily chart following ER. We are now seeing strong follow through after the breakout of 38.
Next targets are 40 and 42.
OptionsSwing Analyst
Daniel Betancourt
Anyone else seeing this?Warren Buffet loves Mac and Cheese. Apparently so do bears and inflation...
Following earnings, 3 days of higher than normal volume, a nice stochastic, and a MACD cross-over into positive territory, KHC has managed to surpass the 200 EMA by about 4%.

Kraft Heinz is ready to take off eventually !
An ABC in the form of a target of an inverted contraction triangle
+ This ABC is in the form of a large X-wave after deep shaving or a three-wave in the form of a triangle or a diamond that is forming in a larger scale.
+ Target is minimum of $ 49 and maximum of $ 70( which can achieve the goal of the classic Cup pattern).

KHC LongTrendline break
At support Zone
Entry 37
Stop 35
Target 47
Risk management is much more important than a good entry point.
The max Risk of each plan should be less than 1% of an account.
I am not a PRO trader. I trade option to test my trading plan with small cost.

KHC LONG TERM BUYHere is KHC creating a big green bullish candle on the monthly time frame. This is the perfect time to enter. We have a upward channel that I do believe it will be in support with. It hit a large area of support and plan on it creating new found Higher Lows and Higher Highs. This stock long term is looking great. Great potential.

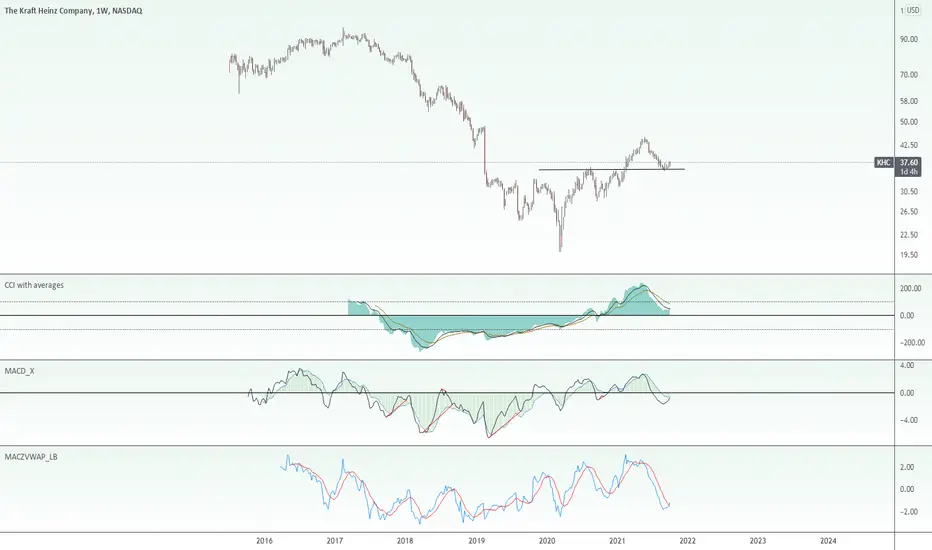
KHC is the 5th holding of Berkshire. What can we expect? Today we will look at Kraft Heinz, a stock in the top 5 holdings of Berkshire Hathaway, that has not been performing yet with stellar results, but that may change, or not... So first, let's look at some conclusions from a technical perspective.
-From 2017 to 2019, the price was clearly on a bearish trend, defined for the most external trendline (white line)
-From 2019 until the beginning of 2021, we observed a consolidation period where the price moved sideways between 37.00 and 27.00
-From 2021 until now, we observed the beginning of a slightly bullish trend and the first breakout of the bearish trendline
-Now, we can see a corrective pattern on the edge of the previous trend (this type of behavior is typical to see when the price is about to break a key level (trendlines, or support/resistance. We will tend to observe any type of corrective patterns.
Ok, what now? What's your view? I have defined activation, invalidation levels, and targets based on all the previous elements. IF the price reaches the green horizontal line, I will consider that my analysis is active, and I will think it is no longer valid if the price reaches the red horizontal line. The target for this movement is 64.00 (on the next resistance level), which means a 60% increase from the activation level.
Regarding time , I think a movement like this will need around a year to happen (if it happens, of course...)
What if the price never reaches the activation level and keeps falling? Then I will cancel my view.
Are you trading this with your personal account? No, I'm not taking this setup. However, I find it an interesting chart, from a technical perspective and under the idea that it is the number 5 holding of Berkshire Hathaway.
Thanks for reading; feel free to share your view in the comments.

Long | KHCNASDAQ:KHC
Evidence: Price Action,
TP1: 35.6$
TP2: 36.4$
TP3: 37.10$
Call options Strike 37$, 10TH Dec 2021 Delta 0.15
Call options Strike 35$, 10TH Dec 2021 Delta 0.45
100% Profit at 36$
*This is my idea and could be wrong 100%

KHC ready to bounce bigKHC seems ideal to go long here. We had a nice bounce in the rising trend channel floor. SL if it breaks down from the channel. TP at prior peak, if you are patient wait for channel roof.


khc buykhc buy ..buy at 38. 31 ...first target the resistance level ..finally target at 47.21 .. stoploss under the support level and under 200 ma

khckraft, they sell mustard, ketchup,snacks, cheese. again trading view wants more info. 2nd try here. they sell food and make money. Last post here, sorry, too much of my time pleasing the bots for info. Adios
KHC: Short term buyAll trade in sell order/buy order, might not trigger, cancel if the price has run too far.

working on my Elliott Wave countsThis was a 5 minute TA, and a work in progress. My plan is to tweak over the next few weeks and months.

Kraft KHC longBeen a relitiviety easy stock to trade. Its filled the gap and crap, had a failed breakout and now its sat above support at 35$. One can only predict that itll bounce from this level and push back up again to retest resistance.

$KHC long term$KHC approaching previous supply area, looking for a dip down to low $36s to start adding into a long term position.

$KHC 5th wave turn wants to appear Heinz coming off a clear wyckoff bottom, still needs to finish its 5h wave up. Im accumulating these levels still and looking for fib extensions target.

$KHC Back to $60+Great area to start building long position. Will add to position at lower channel bounds and retracement zones if we visit them looking for $60 target.

$KHC "V" PotentialWe can see $KHC has begun the right side turn. By mirroring the past decline we gain potential trajectory. Mid-term target of $58 with potential to retest previous highs and beyond, moving out further.

Heinz Kraft rounding bottomWith a positive stream of earnings beating estimate, the stock looks ready to move up. The closing above 42.50$ level indicates a potential rally for the 48.50$ level then 54.25$.
Buying at market open, stop loss 10% below entry price.

The cheapest consumer-defensive stock for long-termCraft Heinz's earnings report came out today and it was pretty good. However, the price may go a little lower, so I would recommend to buy @ $35-37 and hold this stock for a few years.
