First support at 99Nvidia broke the long term uptrend it was on since the end of 2022. Mid-feb it tested this trend line successfully, thereby bouncing off. Then it crossed the 200dma last week and is now on track to form a lower low, thereby 'officially' entering a downward trend. First support is at the 38% fibonacci level at 99 USD. This also coincides with previous support/resistance levels seen in sep24 and mar24. Don't catch a falling knive (yet).
NVD trade ideas

NVIDIA Stock Goes Diving-Dressed ahead of Dotcom Crash RepeatingNvidia’s stock recently experienced a significant decline, tanked to 6-month low reflecting a mix of investor sentiment shifts, market dynamics, and company-specific concerns.
Here’s our @PandorraResearch Team ̶M̶u̶m̶b̶o̶ ̶j̶u̶m̶b̶o̶ fundamental and technical breakdown of what is going on with Nvidia stock NASDAQ:NVDA and why:
1. Cooling AI Enthusiasm
Nvidia has been at the forefront of the AI boom, with its chips powering advanced AI platforms. However, investor optimism about AI-related stocks has begun to wane. While Nvidia reported impressive revenue growth (122% in recent earnings), its future guidance failed to meet sky-high expectations. Investors are increasingly concerned that the returns from AI investments may take longer to materialize than initially anticipated. This cooling enthusiasm has led to a reassessment of Nvidia’s valuation, contributing to the stock's decline.
2. High Valuation Concerns
Nvidia’s price-to-earnings (P/E) ratio had soared to levels significantly higher than industry averages, reflecting lofty expectations for its future growth. At its peak, Nvidia was trading at 45 times expected earnings, compared to the S&P 500’s average of 22 times. Such high valuations often make stocks vulnerable to corrections when market sentiment changes or growth slows. The recent sell-off suggests that some investors are beginning to view Nvidia’s stock as overvalued.
3. DOJ Antitrust Investigation
Another factor weighing on Nvidia’s stock is news of a U.S. Department of Justice (DOJ) subpoena investigating potential antitrust violations. The probe reportedly focuses on whether Nvidia’s business practices limit customer options or stifle competition. While no formal charges have been filed, such investigations create uncertainty and make investors jittery about regulatory risks.
4. Broader Market Pressures
The decline in Nvidia’s stock also coincides with broader market challenges. Rising interest rates and concerns about the U.S. economy have led many investors to shift away from high-growth tech stocks like Nvidia toward more stable, rate-sensitive investments. Additionally, a general downturn in the Nasdaq Composite index has amplified the pressure on Nvidia shares.
5. Profit-Taking After a Massive Rally
Before its recent drop, Nvidia had seen meteoric gains—its stock surged over 120% in one year and briefly became the world’s most valuable company. Such rapid growth often attracts profit-taking as traders sell off shares to lock in gains. Analysts described this as a "routine selloff" after an extraordinary rally.
Technical challenge
The main technical 3-month log scaled graph for Nvidia's stock indicates on unattainable highs never seen before since Dotcom crash, reached through a massive long term path inside upside channel.
Conclusion
Nvidia’s stock decline is driven by a combination of factors: tempered AI optimism, valuation concerns, regulatory uncertainty, broader economic pressures, and profit-taking after an exceptional run-up. While some analysts remain bullish on Nvidia due to its dominance in AI hardware, others see the pullback as a natural correction in response to overextended valuations and shifting market conditions.
--
Best schadenfreude wishes,
@PandorraResearch Team 😎

NVDA short alarm!As the price breaks out of the support line, it’s a great time to set up a short position.
And here’s some great news for everyone—I won the leap at 65th place!

NVDA Stock: Under $120 pressured? $111 Break Signals $100 RiskIs NVIDIA (NVDA) stock in trouble? As long as NVDA stays under the 120 area, it’s under serious pressure, and the red flag is a drop below 111, opening the door to a fall to the 100 area. In this video, we dive into the latest NVDA stock analysis, breaking down how U.S. export controls have slashed sales to China—now just 15% of total revenue—spooking investors. Could this be the catalyst for a bigger crash? We explore technical levels (120, 111, 100), the impact of CEO Jensen Huang’s sales warning, and what it means for NVDA stock price in near term. Don’t miss this critical update— Drop your thoughts in the comments: Is NVDA a buy or a sell at these levels?

nvda long confirmationnvda corrected in 4 hours or the correction fails to break the last low at 115. big support in 1d for more than 2 years.
breakage from the top of the compression zone

NVDA: Buy ideaOn NVDA as you can see on the chart we would have a hight probability to have an uptrend if and only if we have the breakout with force the resistance line and the vwap by the buyers.

$165+ END OF YEAR! HUGE PUMP INCOMING!If the stock holds above $135, it may regain momentum toward its next resistance near ALL-TIME HIGHS and BEYOND!

NVIDIA Plan for next 3 month!!The chart shows NVIDIA Corporation in a consistent downtrend with Heikin Ashi candlesticks on a daily timeframe, and it is testing significant support levels. The critical observation from the chart is the downward trajectory towards a future buying zone projected between $75 and $80. This is visualized by the yellow line, which indicates anticipated movements and potential buying opportunities in this lower price range.
Thought Process:
Trend Identification: The prevailing downtrend is clear, with lower highs and lower lows being established. The support level at $116 is currently being tested, and if this breaks, the next significant support and target buying area is between $75 and $80.
Candlestick Patterns: Continuous red candlesticks indicate a strong selling pressure. Watching for any transition or stabilization in these patterns could hint at temporary reversals or slowing momentum.
Volume Analysis: Increasing volume during price declines typically confirms the strength of the downtrend. Observing volume changes as the price approaches the $75-$80 range will be key to determining the strength of potential buy signals.
Trade Strategy:
Entry Point: The major buying region is identified around $75-$80, where historical support and the projected path suggest a significant rebound could occur.
Profit Targets: Upon entering at this lower range, initial profit targets might be set at a retracement to $116, with further targets near $132 if the price recovers strongly.
Stop Loss: A stop loss should be considered below $75, to protect against the possibility of an unanticipated continued decline.
Rationale: This strategy is based on the anticipation of a significant bounce from the $75-$80 support zone, informed by historical price levels and current trend analysis. By entering at these lower levels, the potential for a favorable risk-reward ratio increases, given the historical volatility and price recoveries of the stock.
Risk Considerations:
Extended Downtrend: Continued bearish market sentiment or negative industry news could push prices lower than expected.
Market Conditions: Broader market trends will significantly influence the stock's behavior, necessitating continuous monitoring of market conditions and sentiment.
This trading plan offers a structured approach to capitalize on the anticipated low-price opportunity, with clear risk management tactics in place to safeguard investments while aiming for strategic entry points based on thorough market analysis and price action.

Nvidia Long term Puts if we look at the one week on nvidia we can see a long term put at Level 84.99.
Disclaimer- This what i think it will go

NVDA on the Verge of a Reversal or Further Drop? Key Levels to WBased on the recent market news and Trump’s speech, here are a few technology stocks that could be worth watching:
Nvidia (NVDA)
* Why? Nvidia remains a dominant player in AI and GPU markets. Despite recent volatility due to tariff concerns, long-term demand for AI chips remains strong.
* Risk: Any tariffs on semiconductor imports could increase costs, but Nvidia’s pricing power could offset this.
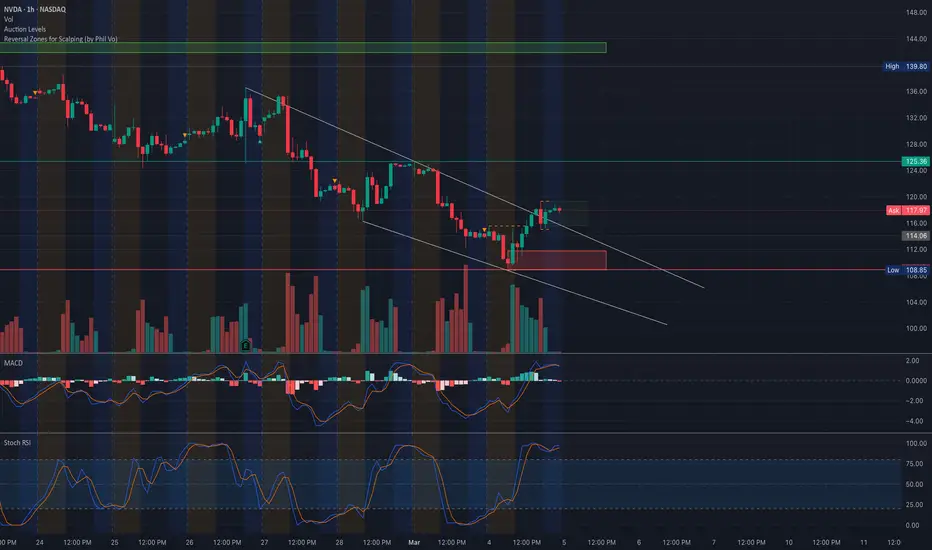
Market Structure Overview:
* NVDA has been trading in a descending channel, testing lower support zones.
* Recent price action suggests a potential breakout attempt, but it needs confirmation above $122-$125.
* A strong support zone around $110-$115 is holding, aligning with key volume profile areas.
Supply & Demand Zones:
* Support: $110-$115, major liquidity zone where buyers have stepped in.
* Resistance: $122-$125, aligning with the descending channel’s upper trendline and volume profile high.
Order Blocks & Volume Profile:
* POC (Point of Control): $115.96, indicating this level as a high-volume area.
* VAH (Value Area High): $125.36, which aligns with a breakout level.
* VAL (Value Area Low): $108.85, marking the last line of defense before a bigger drop.
Key Indicators:
* MACD: Showing early signs of bullish crossover, but not fully confirmed.
* Stoch RSI: Overbought, which may indicate a short-term pullback before a continuation.
* Volume: Increasing on the upside, suggesting a potential shift in momentum.
Options Flow & GEX Analysis
Gamma Exposure (GEX) Breakdown:
* Put Walls: Heavy put support at $110 & $115, indicating strong downside defense.
* Call Walls: Major resistance at $130 & $140, suggesting limited upside unless a breakout occurs.
* HVL (High Volatility Level): $122-$125, the key zone where price could see explosive movement.
Implied Volatility & Sentiment:
* IVR: 47.4, showing moderate IV levels.
* Options Oscillator: Call positioning is 14.3%, indicating bullish bets are picking up.
* GEX Signals: Still bearish but decreasing, which means potential for a reversal if buyers step in.
Trade Scenarios & Actionable Plan
Bullish Scenario:
* Entry: Break and hold above $122.
* Target 1: $125.36 (POC Resistance).
* Target 2: $130-$140 (Gamma Call Walls).
* Stop Loss: Below $115.96 (POC).
Bearish Scenario:
* Entry: Rejection at $122-$125.
* Target 1: $115.96 (POC Support).
* Target 2: $110 (Major PUT Wall).
* Stop Loss: Above $125.36.
Final Thoughts & Market Direction
* If NVDA clears $122-$125, we could see a strong push towards $130+.
* If it fails, expect a retest of $115-$110 before another attempt.
* Watch volume and options flow for directional bias confirmation.
🚨 Stay cautious with stop losses and watch the breakout zones! 🚨
📌 Disclaimer:
This analysis is for educational purposes only and does not constitute financial advice. Always do your own research and manage risk accordingly before trading. 🚀📉
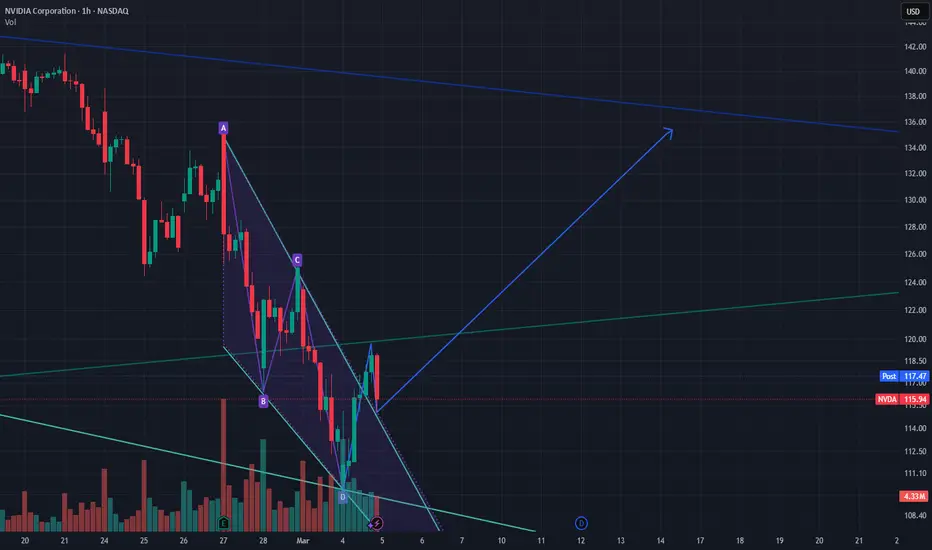
Rising Wedge BreakdownNvidia needs to reclaim the bottom of a rising wedge it just lost and failed to reclaim on the last two daily candles.
It did wick back above it with the most recent daily candle but failed to reach the 200 day EMA, and closed below.
There could be further tests, but the most likely scenario here is down towards the two take profit targets shown on the chart.
A halfway point to TP 1 is the dashed grey line, which may also be a stopping point along the way down.

NVDA Falling Wedge Pattern Setup after retestAnother falling wedge pattern has formed on NVDA's hourly chart, with price action contained between two converging downward trendlines. The stock shows a potential bullish reversal setup after testing major support at 109. Volume has been declining during the pattern formation, which is why a falling wedge. Pull back to retest upper trendline.
SL at 108 1st target 131
Nvidia’s Sharp Decline: Market Turbulence or Buy Opportunity?Nvidia ( NASDAQ:NVDA ) shares took a steep dive on Monday, falling nearly 9% after former President Donald Trump confirmed that tariffs on imports from Canada and Mexico will take effect on Tuesday. This sharp drop contributed to broader market weakness, with the Dow tumbling 800 points (-1.8%) and the Nasdaq Composite sliding over 3%.
Despite Nvidia’s recent earnings beat, its stock has fallen over 13% since last Wednesday, erasing its $3 trillion market cap and bringing its valuation down to $2.79 trillion. However, Tuesday’s trading session saw a notable rebound, with NASDAQ:NVDA gaining 3% as buying pressure returned. Given the technical setup and macroeconomic factors at play, is Nvidia poised for a comeback?
Tariff Fears and Supply Chain Scrutiny
Nvidia’s revenue surged 78% year-over-year to $39.33 billion in its latest earnings report, surpassing analysts’ expectations. However, investor sentiment remains cautious due to the uncertainty surrounding new trade tariffs.
Trump’s 25% tariff on imports from Mexico and Canada could impact Nvidia’s supply chain. While most of Nvidia’s chips are manufactured in Taiwan, other high-end components and full computing systems are assembled in Mexico and the U.S., making them subject to the new duties.
Technical Analysis
Despite Monday’s sharp sell-off, Tuesday’s market session saw a 4% bounce, signaling potential recovery. Key technical indicators suggest a possible shift in momentum. Nvidia’s relative strength index (RSI) has dipped close to oversold territory, suggesting the stock may be due for a reversal. NASDAQ:NVDA is trading at levels last seen in September, a historically strong support area that could trigger buying interest.
With traders digesting tariff implications and market conditions stabilizing, Nvidia could see a short-term bounce if momentum continues.

$NVDA to $130, then a crucial decision.Sure, NASDAQ:NVDA is in a downtrend, but the $114 bottom has been confirmed, which should lead to $130. After reaching $130, we'll see if the king is back.
A double bottom pattern is a classic technical analysis formation indicating a significant trend change and momentum reversal from a previous downtrend. It involves a security or index dropping, rebounding, dropping again to a similar level, and then rebounding once more (potentially starting a new uptrend). This pattern resembles the letter "W." The twice-touched low is now seen as a crucial support level. As long as these two lows hold, there is new potential for an upside.
BUY $130 NOW and enjoy the ride

Downside on NVDA warned on end Jan 2026Pat on the back...
Gave an early warning on NVDA on end Jan 2026....
Down, down all due to Trump... Maybe he is a market crasher in the 2nd term lol...

NVDA: Buy ideaHigh probability of buying on NDVA as you can see on the chart after the break of vwap and resistance line.

NVIDIA, GAY BEAR Forgot to publish this last friday. Hate to say it but being a gay bear is profitable.

Nvidia (NVDA) Stock Hits New Yearly LowNvidia (NVDA) Stock Hits New Yearly Low
The NVDA stock chart shows that during yesterday’s trading session, the price dropped to $112.16, marking:
→ A new low for 2025, surpassing the previous bottom set on 3 February.
→ The lowest price in nearly five months.
Why Is Nvidia (NVDA) Stock Falling?
Bearish sentiment may be driven by:
→ A Wall Street Journal report stating that Chinese companies can still access Nvidia’s latest Blackwell chip despite Biden-era restrictions. Investors may fear tighter regulations, as the U.S. aims to limit technological advancements for geopolitical rivals.
→ The impact of Trump’s trade tariffs, which continue to disrupt global markets.
Technical Analysis of NVDA Stock
As noted in our report five days ago, NVDA’s price is forming a more defined downward channel (red) while moving further away from the Rising Wedge pattern (blue).
How Low Could Nvidia (NVDA) Stock Drop?
Despite NVDA’s weak performance relative to the broader market, investors may seek long positions in this former 2024 market leader.
Potential support levels:
→ The lower boundary of the red channel.
→ The psychological $100 mark.
If the Rising Wedge plays out, bears may target $85, based on the A-B range projected from point C.
A high-risk bullish argument could suggest that yesterday’s drop was a false bearish breakout below the 3 February low.
NVDA Stock Price Forecast
Analysts remain optimistic, possibly due to last week’s strong earnings report.
According to TipRanks:
→ 38 out of 41 analysts recommend buying NVDA.
→ The 12-month average price target is $178.
Trade on TradingView with FXOpen. Consider opening an account and access over 700 markets with tight spreads from 0.0 pips and low commissions from $1.50 per lot.
This article represents the opinion of the Companies operating under the FXOpen brand only. It is not to be construed as an offer, solicitation, or recommendation with respect to products and services provided by the Companies operating under the FXOpen brand, nor is it to be considered financial advice.

NVIDIA start of a bear market?After a double top Nvidia fell strongly and closed weekly candle under the 21 EMA for the first time in more than two years. If there will be retest and rejection by the moving average it can indicate that bears are in control and we will see further downward movement.

NVIDIA At The 1/4 Line - Secure Profits Now?
Currently at the 1/4 line, we can expect a potential pullback. So, if you want to secure some of your fat profits, just do it.
Why not 50% ?
If it goes up again, you have secured 50%.
If it goes down, you still have 50% for a runner.
However, I'm still follow the rule-set and the trading-framework of the Medianlines. Doing this, I know that prices PTG is the Center-Line.

NVDA - Do it again Sam - Insider only sold, not boughtI have posted enough about what's going on in NVDA. It's important in this Stock, to not going crazy, not matter what one thinks it "will" or "could" happen.
A great Hint by Unusual Whales is, that insiders had only sold in the last year, never bought their one Stock.
...what does that telly us?
May profits be with us §8-)

NVDA is Testing Major Support! Will It Bounce or Sink?📊 Technical Analysis (TA):
1. Trend & Structure:
* NVDA remains in a strong downtrend, with multiple Break of Structure (BOS) signals confirming bearish control.
* A recent Change of Character (ChoCH) attempt suggests a possible reversal, but confirmation is needed.
* Key Resistance: ~120-126 (supply zone)
* Support Zone: ~110-113 (current demand area)
2. Indicators Suggesting a Possible Reversal:
* MACD: Starting to show signs of slowing momentum, potential for a bullish crossover.
* Stochastic RSI: Deeply oversold, indicating a possible mean reversion bounce.
* Volume Spike: Increasing volume at support suggests institutional accumulation.
🔹 GEX & Options Flow:
1. Call Walls (Resistance) 🚧
* 126-130: Strong resistance where gamma resistance intensifies.
* 140: Major call wall, unlikely to be tested without a strong reversal.
2. Put Walls (Support) 🛑
* 110: Highest negative NETGEX, meaning a breakdown could accelerate selling pressure.
* 100-95: Next major support levels if 110 fails.
3. IV Rank & Skew:
* IVR 54.5, indicating mid-to-high implied volatility.
* Puts are dominating, at 81.35% of second-wall exposure.
* Calls only 11.2%, suggesting bearish sentiment remains strong.
📌 Trading Plan & Suggestions:
* Bullish Reversal Scenario:
* If NVDA holds 110-113, expect a short squeeze rally toward 120-125.
* Ideal trade: April 115C or 120C, targeting a reversal move.
* Bearish Breakdown Scenario:
* If NVDA loses 110, downside targets extend to 100-105.
* Ideal Put Play: Buy March-April 110P or 105P targeting 95-100.
⚠️ Key Warning: A strong bounce is possible, but failure to reclaim 115 quickly will favor more downside.
🔥 Conclusion: NVDA at a Pivotal Level – Rebound or Freefall?
NVIDIA is testing a key support area with early reversal signals, but bears still dominate options flow. The next few sessions will determine if bulls can defend this zone or if we see another leg down. Stay cautious and watch price action near 110-113 before making a move. 🚀📉
🚨 Disclaimer:
This analysis is for educational purposes only and does not constitute financial advice. Always do your own research and trade responsibly.

$NVDA Market Update📊 NASDAQ:NVDA Market Update
Welcome to today's analysis! Let’s break down the current price action on NASDAQ:NVDA and its potential movement.
🌐 Overview: NASDAQ:NVDA Approaching Key Support
📉 NASDAQ:NVDA is approaching the green support zone, a key level where buyers might step in to trigger a bounce.
🔄 Current Scenario:
If NASDAQ:NVDA holds the green zone, we could see a bounce from this level.
To cancel the bearish structure of lower highs (LH) and lower lows (LL), the price needs to break out of the blue resistance zone.
🔑 Key Levels to Watch
🟢 Support Zone: Green Level (Potential bounce area)
🔵 Breakout Above Blue Resistance Zone: Could confirm the end of the bearish structure (LH and LL)
🛠️ Trade Scenarios
📌 Bullish Scenario (Bounce from Support & Breakout Above Blue Zone)
If NASDAQ:NVDA holds the green support, buyers could step in and push the price higher.
A breakout above the blue resistance zone would confirm a trend shift, invalidating the bearish structure (LH & LL).
📌 Bearish Scenario (Break Below Support)
If NASDAQ:NVDA fails to hold the green zone, the price could continue its downtrend, leading to further declines.
📌 Conclusion
NASDAQ:NVDA is at a key decision point—holding the green support zone could lead to a bounce, but for a bullish reversal, the price must break out of the blue resistance zone to cancel the bearish structure
