Overweight $XYZ ; Raising Price Target to $140+- BOATS:XYZ has been included to S&P 500 . It's a big news for BOATS:XYZ , this was one of the undervalued stock, treated like a dog but this company is always innovating and has strong talented employees.
- On top of that now BOATS:XYZ will get passive funds which is massive and bullish for the company.
SQ3 trade ideas

A BNPL Bubble Is Actually Why I'm Bullish, For NowBNPL is growing and inflating at an increasing rate. From concert tickets to burritos, everyone is using buy now pay later. The global market is projected to hit 560 billion dollars in 2025, up from around 492 billion in 2024, and climb to 912 billion by 2030 at a compounding growth rate of 10.2%. Just in the U.S. alone, demand is expected to reach 122 billion next year and scale to 184 billion by the end of the decade. The trajectory is steep, with the structural weaknesses already showing.
Block is positioned at the center of BNPL. In Q1 2025 they reported:
2.29 billion in gross profit, up 9 percent YoY
466 million in adjusted operating income, up 28%
10.3 billion in GMV through Afterpay, with 298 million in BNPL gross profit, up 23% YoY
The stock took a hit. It dropped 9 percent in February and another 21 percent after missing Q1 earnings, but this is seen as typical early bubble behavior. There is short term fear but continuing growth and acceleration. Klarna’s credit losses, IPO delays, and regulatory friction are not problems, they are actually signals that the sector is growing faster than the market, or quite frankly, anyone can control.
BNPL is becoming the default credit system for younger consumers. It is overused and expanding too fast. That is the formula for both upside and implosion. However with that, timing will be everything here, and knowing when to close will be crucial if BNPL can't stabilize.
Baseline expectation: SQ trades in the 80 to 90 range in the short term
Midterm upside: 120 by 2027
Long-term target: 180 to 220 if BNPL stabilizes and Block captures its runway

Block Inc (SQ) – Macro Reaccumulation Play into S&P Breakout🧠 Block Inc (SQ) – Macro Reaccumulation Play into S&P Breakout 📈
WaverVanir VolanX Protocol | Long-Term Thesis | Smart Money Structure
🗓️ Chart as of July 19, 2025 | 1D Timeframe | DSS Score: High Conviction Long
📍 Technical Analysis – VolanX SMC Layer
Block Inc (SQ) is forming a macro reversal base after years of distribution and downside compression:
✅ Break of Structure (BOS) off deep discount zone
✅ CHoCH and BOS cluster near $48–$55 suggests institutional accumulation
✅ Price reclaimed Equilibrium (~$72.80) with clean volume breakout
🟥 Red zone = supply / inefficiency from 2022
🟨 Target zone = $147.62, the 2021 fair value gap top
🌐 Macro + Fundamental Catalysts
🧾 S&P 500 Inclusion Confirmed
Block (SQ) has officially been added to the S&P 500 index (as of June 2025), unlocking large inflows from passive index funds and boosting institutional exposure.
💰 Fundamental Growth Narrative:
Gross profit set to exceed $8.65B in 2025
Cash App expanding with lending, rewards, and direct deposit capture
Bitkey wallet + Proto mining chip reinforce dual revenue from crypto hardware and Bitcoin transactions
Analyst median target: $75–90; VolanX scenario-adjusted upper target: $120–147
🧭 Trade Setup – WaverVanir Playbook
📌 Accumulation confirmed. Sentiment reset. Now preparing for revaluation.
Metric Value
Entry Zone $71–75
Stop Loss Below $66
TP1 $98
TP2 $122
TP3 (macro fill) $147.62
🔐 Narrative Bias:
“S&P inclusion acts as a flow catalyst. The macro regime now favors quality fintechs with crypto rails. Block is no longer speculative—it’s foundational.”
🔺 #WaverVanir #VolanXProtocol #SmartMoneyConcepts #SQ #SMP500 #MacroBreakout #OptionsFlow #BitcoinEquity #CashApp #CryptoRails #SMC #DSS #ChartAnalysis #InstitutionalFlow

$XYZ TP1 met, 60 next 63, 65 then 70+ breakout upon us.
NYSE:XYZ 100 SMA on the daily next target. 60 psych will be tough, but should be a parabolic move to 63 for next fib level.

"Breakout Eagle: Soaring Past Resistance XYZ!"Breakout Eagle: Soaring Past Resistance!"
📝 Trade Breakdown:
🚀 Setup:
XYZ just blasted past a key resistance zone with strong bullish momentum. The breakout is confirmed with a clean retest on both the trendline and horizontal support — a textbook long setup!
📍 Entry: $65.84 (on breakout retest)
🎯 Target: $68.20
🛡 Stop Loss: Below $65.00 support zone
📊 Risk-Reward: 2:1 — clean, calculated, and high conviction
🔍 Why It Stands Out:
Trendline breakout 📈
Resistance flip to support 🔄
Volume + price action confirm breakout ✅

XYZ - Looking good here for some long trade
Target 1 - 68
Target 2 - 74
Target 3 - 80
Target 4 - 92
But the path won't be a straight line as you know.
Stop loss - 50

Xyz slight pull back and headed to 70s I’m seeing in the 2 H chart a candle outside the outer upper Bollinger, a divergence in the RSI which is pinned around 70, and The MACD also showing signs of a pullback. I believe this will kiss $59 of so and bounce further to mid 60s.

Block XYZ Long IdeaSeeing some sentiment shifting for block stock, looks good TA wise, and some big money starting positions although profit taking as well. Holding this in our 401k accounts

XYZ breakout imminent? Block NYSE:XYZ looks like it's getting ready to breakout.
It was impressive to see this stock holding relative strength today as the markets were under pressure and selling off.
The OANDA:SPX500USD & NASDAQ:QQQ sold off and this stock closed green.
2 bullish patterns can be observed on the daily chart. A bull flag and and inverse head and shoulders.
The major indices broke key ranges to the downside and this stock has traded in a tight range.

Block XYZ aka $SQNYSE:XYZ : easy sell at $90+.
I like this company and will be watching it weekly. Once it breaks those resistances, an all-time high (ATH) is next.

A 12/19 call option I have executed on $XYZNYSE:XYZ __NFA__ this will be fundamentally fueled by an upside move in bitcoin and US markets. They have $7.77B in cash. Jack Dorsey is doing it right in the bitcoin space.

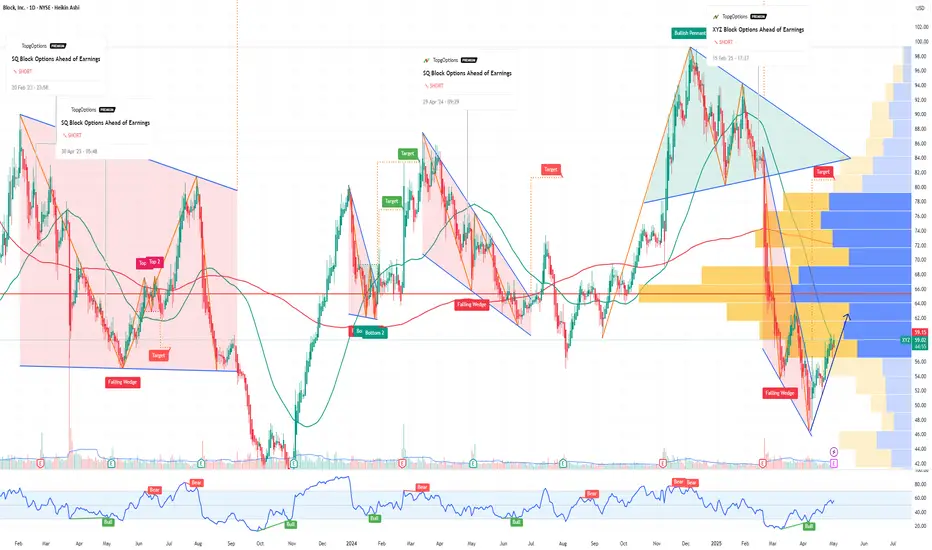
XYZ Block Options Ahead of EarningsIf you haven`t sold XYZ before the previous earnings:
Now analyzing the options chain and the chart patterns of XYZ Block prior to the earnings report this week,
I would consider purchasing the 58usd strike price Calls with
an expiration date of 2025-5-2,
for a premium of approximately $3.40.
If these options prove to be profitable prior to the earnings release, I would sell at least half of them.
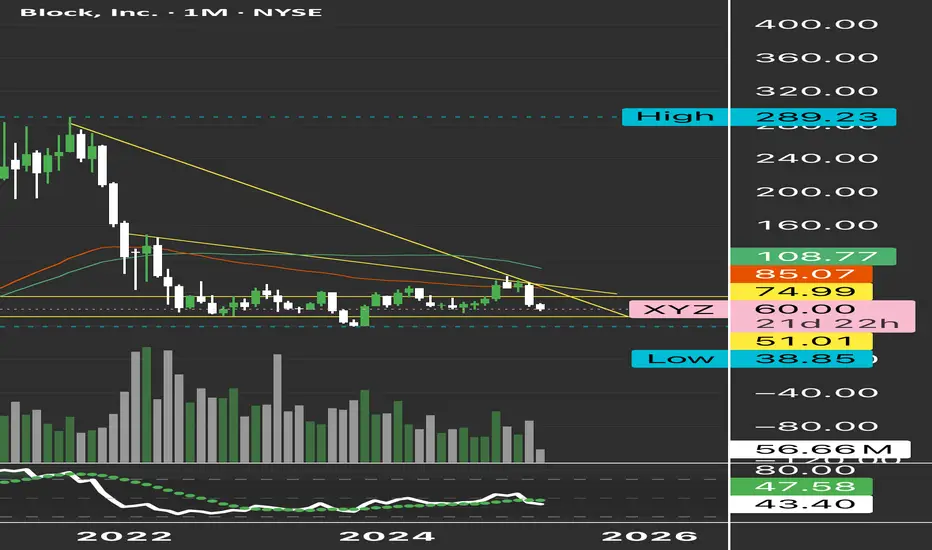
$XYZ Monthly Hammer & Weekly MACD PushingI like the monthly hammer candle on XYZ combined with weekly MACD curling. Some gaps above and honestly its an oversold 'real' company with revenue.

$XYZ pullback would be a gift for longsNYSE:XYZ back in bull trend here since tapping the 50 psych level. The 100WMA showing some confluence here with bull flag + trendline break from last month's disaster.
Fibs also coincide with some of the idea here with us currently in the golden zone
Short term, I'd take a stop here below 52.50 as it can get ugly back to 50, and would consider taking another long there at 50.
For now, 53-54 range looks good for long pullback. 54.60 is the 333SMA on the 1HR chart here. Looks like a great spot for starter entries. If the pullback does not come, a break above 57 (pm highs TODAY, 4/23) should see a nice push towards 60 psych level which could see some strong resistance. Targeting 62 if we break 60.
Leaps look great here with all this confluence. Easy stop below that 50 psych.
Targets on chart are assuming we do not get a pullback tomorrow. If we do, the r/r becomes much better to the long side. This chart does not look good for bears. Options flow
Thoughts on XYZ?

The ABC's about XYZ (formerly SQ)Update Daily Chart 1/29 - would like to see it hold support at 83.95. If not, support at 80 (0.5 Fib)seems tenuous. Lower support at 72.5 remains solid. sell cash secured puts $72 - $80 for income and a potential favorable entry price. RSI above 50 is neutral-positive with room for upside.
Ascending triangle forming, bias undetermined. MACD is neutral-positive with slight lean to the upside
Conclusion: Mixed. Right now it's "Stuck in the middle with you" amid general market and geopolitical uncertainties.
Upside: $103 - $140+ but has to break above resistance with volume. Support $80 - $60 and is strong at those levels.

Bearish chart pattern on XYZWeekend analysis complete. After monitoring NYSE:XYZ for weeks, my alert triggered on a daily H pattern coinciding with a death cross.
Planning put positions next week with targets at 50.87, 45.80, and 42.77. Expect a brief recovery early week before a significant drop ahead of April 2nd reciprocal tariffs.

XYZ eyes on $59.xx: Double Golden Fibs that bulls need to HoldXYZ got a nice bounce with the market but is pulling back.
Now at a key support zone of two Golden Fibs (Genesis+Covid)
$58.95 - 59.25 is the exact zone of interest that muss must hold.
========================================================
.

$XYZ - Something to considerNYSE:XYZ Since 2019, the price has broken below the current support level only two times, with quick recoveries. 👀

XYZ Possible Trend Up 60%Observed that XYZ touch the major support zone officially this week and more to see next week. Possible up trend may emerge from here again. RSI was broken and testing higher...

Largest Dark Pool Sweep Order Since 2023...On a ranked scale since inception, there was a relatively small DP sweep order ranked #58
Price purchased at $63.90.
The reason why its so substantial is that it was the largest trade made since 2023 when the stock found major support at levels we are still consolidating in to this day.
The even bigger reason on why this means we are most likely bottoming for the last time is that the #58 trade was a DP SWEEP. Meaning they bought the stock at market value to fill it as fast as possible.
They did not set a limit order and wait patiently.

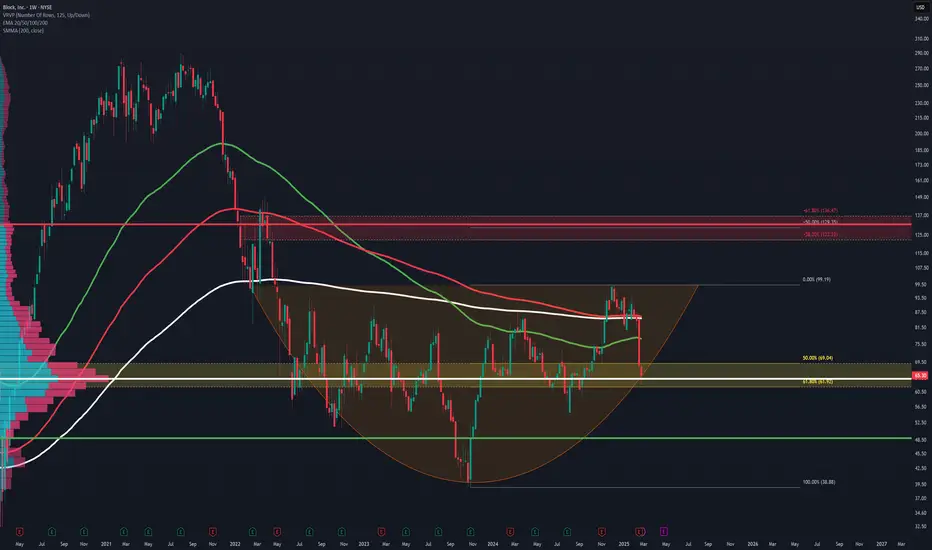
Possible?Any way you look at this, the chart looks insanely bullish.
The moves it has made in the arch looks a mirror to what it done throughout the years prior and gives me the impression we should see some aggressive moves upwards in the coming weeks. We can dip outside the arch as it has done that before, but it doesn't change its path. Lets hope it finds the momentum and reaches the Fibonacci target which is sitting in the 120-130 zone.
Alongside all of this, it's also testing a high volume level, so a bounce from here is more likely than not.
P.S:
Funnily enough, this is the exact same pattern as PYPL so I will be doing a copy and paste as the direction potential is the same.
Block | XYZ | Long at $64.84Block's NYSE:XYZ revenue is anticipated to grow from $24 billion in FY2024 to $32 billion in FY2027. With a current price-to-earnings ratio of 13.8x, debt-to-equity ratio of 0.36x, and rising cash flow in the billions, it's a decent value stock at its current price. Understandably, there is some hesitation among investors due to competitive fintech market and economic headwinds. But, like PayPal NASDAQ:PYPL , growth is building.
From a technical analysis perspective, the price dropped to within my historical simple moving average bands. Often, but not always, this signals a momentum change and the historical simple moving average lines indicate an upward change may be ahead. While the open price gaps on the daily chart in the $40s and GETTEX:50S may be closed before a true move up occurs, NYSE:XYZ is in a personal buy zone at $64.84.
Targets:
$80.00
$90.00
$100.00
[*) $134.00 (very long-term)
