Direct Access Trading SystemsDirect Access Trading Systems
Direct access trading systems (DATS) offer traders a direct line to financial markets. By bypassing traditional brokerage routes, DATS enable swift, precise trading, essential for strategies reliant on speed and accuracy. This FXOpen article delves into the workings, benefits, and considerations of DATS, providing valuable insights for both seasoned and aspiring traders navigating the fast-paced world of modern trading.
Understanding Direct Access Trading Systems
Direct access trading systems (DATS) revolutionise how traders interact with financial markets, typically in the realm of stock trading. Unlike traditional brokerage platforms, these systems offer direct market access trading, a method allowing traders to place orders directly into the market's electronic order book. Such immediate access is crucial for those who require precision and speed in their trading decisions.
Traditionally, orders placed through brokers are processed internally before reaching the market, potentially causing delays. However, brokers with direct market access provide a conduit for traders to bypass these intermediate steps. These systems typically appeal to day traders and other short-term investors who value the ability to respond swiftly to market movements.
Usually, direct access brokers list Level 2 quotes, where bid and ask prices alongside order sizes are given for the asset, providing an additional layer of valuable information. By offering a more direct link to financial markets, these systems may provide an enhanced trading experience that aligns with the needs of active traders.
Selecting the best direct access broker for day trading involves considering several key factors. Traders look for platforms that offer high reliability and uptime, as any downtime can significantly impact outcomes. Speed of order execution is crucial in capturing market opportunities. Additionally, traders assess the fee and commission structure to ensure it aligns with their trading volume and strategy.
How Direct Access Trading Systems Work
DATS offer a sophisticated network that connects traders directly to financial markets. These systems use specialised software platforms, helping traders make efficient and swift operations:
- Order Entry: Traders use the DATS platform to enter their orders. These platforms are equipped with various order types, such as market, limit, or stop orders, giving traders flexibility in how they execute trades.
- Order Routing: After order placement, DATS route these orders directly to the market instead of through a broker. The process often involves Electronic Communication Networks (ECNs), which play a critical role. ECNs are automated systems that match buy and sell orders for assets, eliminating the need for intermediaries like traditional stock exchanges. They also provide a venue for trading outside traditional hours, offering greater liquidity and potential efficiency.
- Execution: Orders are executed via these ECNs or other market venues. The rapid execution capability is a defining feature of DATS, enabling traders to capitalise on fleeting market opportunities.
- Feedback and Reporting: Following execution, the system promptly provides feedback. Traders receive immediate trade confirmations, including execution price and time, essential in maintaining transparency and control over trading activities.
Through this streamlined process, DATS offer a high-efficiency trading environment. Such a setup is particularly advantageous for strategies that require quick decision-making and execution, such as day trading or scalping.
Advantages of Direct Access Trading Systems
DATS offer several compelling advantages over traditional brokerage platforms, particularly for those who engage in frequent trading. These benefits cater to the needs of active traders seeking efficiency and control in their strategies.
- Speed of Execution: DATS enable traders to execute orders almost instantaneously. Rapid processing is crucial in fast-paced markets where prices can fluctuate within seconds.
- Enhanced Control: Traders have greater control over their orders, including the timing, price, and order type. This level of control is especially crucial in volatile market conditions.
- Access to Real-Time Market Data: DATS provide real-time data, allowing traders to make informed decisions based on the latest market movements.
- Lower Transaction Costs: By eliminating the middleman, DATS often result in lower transaction costs, a significant advantage for high-volume traders.
- Customisation and Flexibility: Many direct access trading platforms come with advanced charting and analysis tools. These tools can be customised to fit individual strategies and preferences.
- Direct Market Interaction: Traders can interact directly with market liquidity providers, potentially leading to better pricing and execution quality.
Risks and Considerations
While these systems offer several advantages, they also come with inherent risks and considerations:
- Increased Complexity: DATS are typically more complex than traditional brokerage platforms. They require a sophisticated understanding of market dynamics and trading strategies, making them better suited for experienced traders. The complexity also extends to the technological infrastructure needed to use these systems, which may involve higher setup and maintenance costs.
- Higher Costs: Using DATS may be more expensive than traditional online brokers. The costs go beyond technology requirements; for example, the price of direct access trading systems and the commissions for trades can be higher. This aspect makes it vital for traders to evaluate the cost-benefit ratio of using DATS compared to other trading methods.
- Stricter Trading Rules: Direct market access often comes with more stringent rules. This could include tighter regulations around repeat dealing, deal rejections if trading outside normal market sizes, and potential penalty fees for inactive accounts.
The Bottom Line
In summary, direct access trading systems may enhance efficiency, offering speed, control, and direct market insights. However, they require a careful approach due to their complexity and cost.
This article represents the opinion of the Companies operating under the FXOpen brand only. It is not to be construed as an offer, solicitation, or recommendation with respect to products and services provided by the Companies operating under the FXOpen brand, nor is it to be considered financial advice.
TL0 trade ideas

TESLA: Bulls Will Push
The price of TESLA will most likely increase soon enough, due to the demand beginning to exceed supply which we can see by looking at the chart of the pair.
Disclosure: I am part of Trade Nation's Influencer program and receive a monthly fee for using their TradingView charts in my analysis.
❤️ Please, support our work with like & comment! ❤️

TESLA Lagging BehindA compelling reason to buy Tesla stock now—despite it being beaten down—is the asymmetric risk-reward setup driven by its depressed valuation relative to long-term growth potential. Sentiment is currently low due to concerns about EV demand, competition, and Elon’s distractions, but this pessimism is largely priced in. Meanwhile, Tesla still holds massive optionality: AI-driven autonomy, energy storage, and Dojo supercomputing. If even one of these verticals scales meaningfully, current prices may prove a generational entry.
At the moment, we are hitting some of my key support levels being the anchored vwap from the low , as well as the previous Value Area High range retest within the formation of this broader triangle, suggesting a potential continuation to the upside should we get a strong breakout.
I will be watching for further down side as the current risk is only approx 6-7% for a potential upside of 60%-70% , a massive Risk to reward.
Should this reclaim the downtrend vwap, it can be a strong sign of strength for this stock to move back to ATH's as tesla is massively lagging behind.

One more drop. Another dip incoming — I just hope we don’t establish below around 260, that would turn bearish.
If we drop down to 260, I’ll be looking to buy again.

Musk-Trump Feud Sends Tesla (TSLA) Shares DownRenewed Feud Between Musk and Trump Drags Tesla (TSLA) Share Price Lower
The US Senate yesterday narrowly approved Trump’s so-called “big, beautiful budget bill.”
Elon Musk, who had previously criticised the bill for potentially adding $3.3 trillion to the national debt, warned that Republican lawmakers who supported it would face political consequences. In a post on X, Musk wrote:
“Every member of Congress who campaigned on reducing government spending and then immediately voted for the biggest debt increase in history should hang their head in shame! And they will lose their primary next year if it is the last thing I do on this Earth.”
He also reiterated his intention to establish a third political force under the name “America Party.”
In response, President Trump issued sharp threats:
→ to apply federal pressure on Musk’s companies by revisiting existing subsidies and government contracts (estimated by The Washington Post at $38 billion);
→ to deport Musk back to South Africa.
The market responded immediately to this renewed escalation in the Trump–Musk conflict. Tesla (TSLA) shares fell by over 5% yesterday, forming a significant bearish gap.
Technical Analysis of TSLA Stock Chart
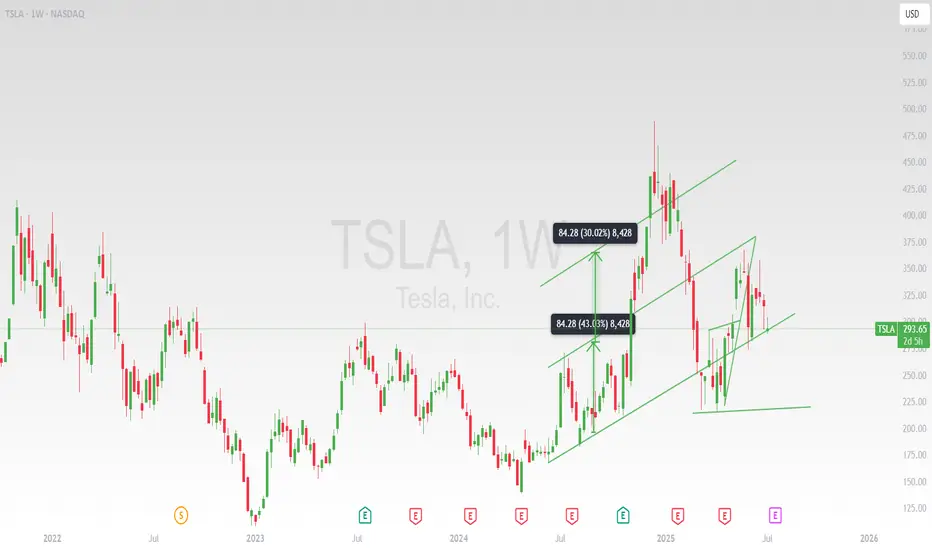
Eight days ago, we analysed the TSLA price chart, continuing to observe price action within the context of an ascending channel (indicated in blue). At that point:
→ In mid-June, when the initial Musk–Trump tensions surfaced, TSLA managed to hold within the channel. However, as of yesterday, the price broke below the lower boundary, casting doubt on the sustainability of the uptrend that had been in place since March–April;
→ The price breached the lower channel limit near the $315 level — a zone that previously acted as support. This suggests that $315 may now serve as a resistance level.
As a result, optimism related to the late-June launch of Tesla’s robotaxi initiative has been eclipsed by concerns that the Musk–Trump confrontation may have broader implications.
If the former allies refrain from further escalation, TSLA may consolidate into a broadening contracting triangle (its upper boundary marked in red) in the near term, ahead of Tesla’s Q2 earnings release scheduled for 29 July.
This article represents the opinion of the Companies operating under the FXOpen brand only. It is not to be construed as an offer, solicitation, or recommendation with respect to products and services provided by the Companies operating under the FXOpen brand, nor is it to be considered financial advice.

TSLA at the Edge of Breakdown? Here’s the Options PlayGEX-Based Option Strategy Insight:
TSLA’s GEX landscape reveals heavy negative Gamma Exposure lurking below $305. That’s a red flag — dealers are likely to short more as price falls, amplifying downside. The highest negative NET GEX zone sits around $310–315, right near the current price, indicating a major PUT support zone — if broken, could trigger a volatility spike.
* PUT Walls: Stack up at $310, $300, $295, with max pain potential down to $285–290.
* Call Walls: Far above at $325/337.5/340 — little gamma resistance above, but TSLA would need a strong reversal to challenge those.
📌 Options Sentiment:
* IVR is 29.7 (lowish), IVx avg is 72.3 → options pricing isn’t cheap anymore.
* Calls 44.3% vs Puts 55.7% → leaning bearish.
* GEX suggests downside acceleration under $300.
➡️ Trade Idea (GEX View):
If $300 fails, consider buying 295 or 290 PUTs (weekly or next week expiry).
Target $285–290 zone for exit.
Above $310 = exit.
1-Hour Chart Technical Setup (2nd image):
TSLA has been in a clear downtrend, marked by:
* Break of Structure (BOS) followed by lower lows.
* Price is hovering inside a potential accumulation zone, but has shown no bullish confirmation yet.
* Volume is weak, and we are still sitting under a steep downtrend resistance line.
📉 Bearish Play:
* Break below $300 = confirmation of continuation.
* Entry: $299.50–300.00
* Target: $293.21 > $290 > $285
* Stop: Close above $305 (tight).
📈 Bullish Risk:
* Only valid if price breaks $310 and flips the BOS area at $317.
* This could trigger a squeeze toward $320/325, but that’s lower probability for now.
Final Thoughts:
Until we reclaim $310+, TSLA leans heavy. GEX confirms dealer pressure below $300. Use tight stops and don’t chase — volatility will increase fast on a breakdown.
Disclaimer: This is not financial advice. Trade at your own risk and always confirm your thesis.

Stocks SPOT ACCOUNT: TESLA stocks buy trade with take profitStocks SPOT ACCOUNT: MARKETSCOM:TESLA stocks my buy trade with take profit.
Buy Stocks at 297 and Take Profit at 319.
This is my SPOT Accounts for Stocks Portfolio.
Trade shows my Buying and Take Profit Level.
Spot account doesn't need SL because its stocks buying account.

TSLA / Earning seasonNASDAQ:TSLA showing nice price action bounce off the base last week. With earnings season here, watch the $315 level — a breakout could send it toward $320 and $326 next 🚀📈 #TSLA

$Tsla $350 looks promisingNASDAQ:TSLA $350 looks promising in the upcoming weeks.
AMEX:SPY NASDAQ:QQQ NFA
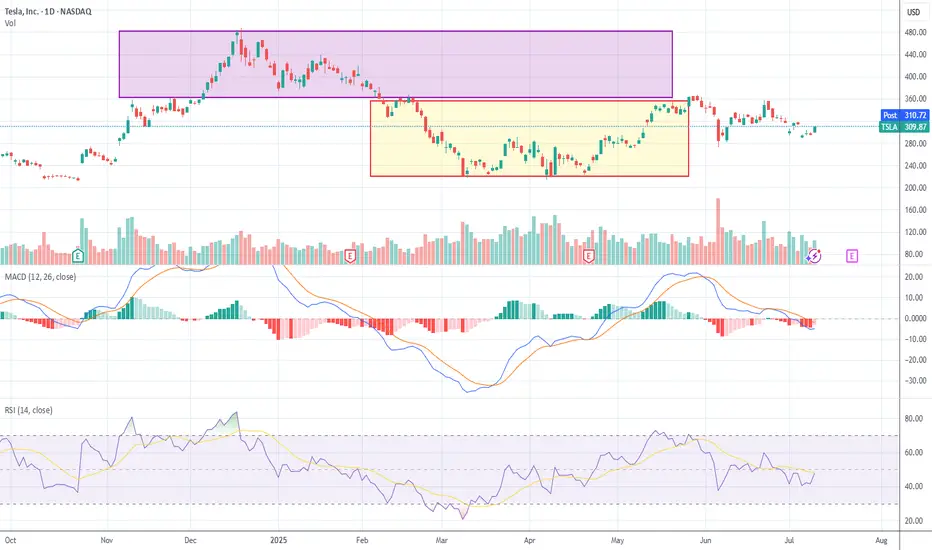
Tesla Flashes Bullish Reversal: Engulfing Candle and Volume PoinLet’s reassess TSLA now that we have this new candle (a big move +4.73%) in context. This changes things substantially, so I’ll reapply candlestick techniques, assess trend health, box positioning, and momentum.
Candlestick Analysis
The new candle:
Large white body (+4.7%) closing at $309.87. Engulfing prior 2 candles’ real bodies → this is a Bullish Engulfing Pattern. Occurs near the 50% retracement ($290) zone (previous support). Volume expanded vs prior days → adds validity. Bullish engulfing after a down leg is an early reversal signal.
Context:
This happens after weeks of indecision candles (spinning tops / dojis) → classic “coiling” behavior before expansion.
Trend Health & Momentum
MACD: Still below zero but histogram bars turning less negative → momentum starting to shift.
RSI: Up to ~47.6, breaking out of its down channel. A move >50 would confirm momentum pivot.
Box Dynamics
TSLA just punched through the upper edge of Box 2 ($300) with conviction.
Now entering “no man’s land” between Box 2 ($300–$360) and Box 1 ($360–$465).
For a sustained breakout it must close above $306–310 range for 2-3 days. Ideally see follow-through with a test of $328 (78.6% Fib).
Tactical Breakdown
✅ Breakout case (higher probability now):
Bullish Engulfing + volume expansion at support zone.
Closing above $306-310 increases odds of a run toward $328 (78.6%) and possibly $360.
❌ Reversal back down (lower probability):
Only if TSLA immediately rejects $310 and falls back below $300 in the next 1–2 sessions.
This price action looks like accumulation showing its hand. Large white candle suggests buyers absorbing supply at prior resistance.
Breakout above $306 confirmed if follow-through continues. Odds for a reversal lower just dropped sharply after today’s engulfing.
Tesla Share Price at Key Technical LevelTesla’s share price has returned to a well-established upward trendline. The key question now is: will this trendline act as support and trigger a bounce, or will it be breached, attracting further selling pressure and pushing the price lower?
We’d love to hear your thoughts — will the bulls defend this level, or are the bears gaining ground?
Tesla's Self-Inflicted Crisis of ConfidenceInvestors wanted Elon Musk to double down on EVs. Instead, they got a new political party and another reason to sell the stock.
Musk vs Trump: A Fight Investors Didn’t Ask For
Tesla’s latest sell-off has little to do with earnings or electric vehicles. Shares dropped 6.8% on Monday after Elon Musk announced plans to launch a new US political party, escalating his feud with Donald Trump and reigniting investor concerns about distraction at the top.
The fallout from Musk’s political re-entry has been swift. Tesla’s valuation has lost over $200 billion since late May, when Musk’s role in Trump’s short-lived government efficiency task force came to an end. His renewed focus on political activism contradicts April’s pledge to spend “far more” time on Tesla, and comes at a moment when the business is already under pressure from slowing EV sales and collapsing regulatory tailwinds.
Politics, Profits and a Shrinking Mandate
Trump’s so-called “big, beautiful bill” is slashing support for electric vehicles across the board. Gone is the $7,500 federal tax credit, set to expire in September. Gone too are the emissions penalties that allowed Tesla to bank billions in regulatory credits from legacy automakers. William Blair analysts estimate that over $2 billion in high-margin profit is now at risk.
The political clash is getting personal. Trump has mocked Musk’s behaviour as a “train wreck”, suggested deportation, and floated nationalising SpaceX. Investors, meanwhile, are left questioning whether Musk’s growing list of battles is starting to erode Tesla’s long-term advantage. The distraction risk is real, and the market is responding.
Technical Breakdown: Key Levels in Play
Tesla’s share price has woefully underperformed this year. The stock is down 22% year-to-date, while the S&P 500 is up 6%. Recent price action highlights just how vulnerable Tesla has become to the political whims of its CEO. The public fallout with Trump helped define a new swing high in May, which now acts as clear resistance. A new swing low was formed in early June, and that is now the short-term level bulls need to defend.
Adding Keltner Channels to the chart puts the recent volatility into perspective. The sideways bands and price bouncing between them show a market stuck in broad equilibrium. There’s little directional conviction, but that may be changing. Monday’s sell-off pushed Tesla below the volume-weighted average price anchored to the April lows. If the shares remain below this VWAP and break under the June swing lows, it would confirm the attempted recovery has failed and signal that the bears are back in control.
For now, Tesla isn’t trading like a high-growth innovator. It’s trading like a politically charged meme stock with no clear trend and no adult supervision.
Tesla (TSLA) Daily Candle Chart
Past performance is not a reliable indicator of future results
Disclaimer: This is for information and learning purposes only. The information provided does not constitute investment advice nor take into account the individual financial circumstances or objectives of any investor. Any information that may be provided relating to past performance is not a reliable indicator of future results or performance. Social media channels are not relevant for UK residents.
Spread bets and CFDs are complex instruments and come with a high risk of losing money rapidly due to leverage. 85.24% of retail investor accounts lose money when trading spread bets and CFDs with this provider. You should consider whether you understand how spread bets and CFDs work and whether you can afford to take the high risk of losing your money.

$TSLA hanging by a threadNASDAQ:TSLA getting rocked again today. Gapped down over 7% at open. Literally hanging by a thread on the bottom of the daily cloud. It's also OUTSIDE of the bottom Bollinger band...
Also otm call flow just came in $1.8 million 325c 7/25 @ 6.40

Better MACDWhat is the MACD?
The MACD (Moving Average Convergence Divergence) is a momentum and trend-following indicator. It’s based on the difference between two EMAs (Exponential Moving Averages) and helps spot:
Trend direction
Momentum shifts
Reversals
Entry/exit points
✅ Basic MACD Techniques
1. Signal Line Crossovers
Bullish Crossover: MACD line crosses above Signal → buy signal
Bearish Crossover: MACD line crosses below Signal → sell signal
🔸 Works best in trending environments, 200 SMA as a filter.
🔸 Combine with volume or trend filters for best results
2. Zero Line Crossovers
When MACD crosses above 0, the shorter EMA is above the longer EMA → bullish. This is typically the sign of a larger trend than crossovers.
When MACD crosses below 0, shorter EMA is below → bearish
🔸 Zero line = baseline momentum direction
🔸 Cross above = bullish trend confirmation
🔸 Cross below = bearish confirmation
3. Histogram Momentum
The histogram is often the first sign of a shift before a crossover happens.
Read it like this:
Histogram growing: Increasing momentum in that direction
Histogram shrinking: Momentum is fading
Histogram changing color (in many indicators): Potential reversal
🔸 Use histograms to get early signals, even before crossovers. Confirmed with volume surge and Price Action.
🔍 Advanced MACD Tricks
📉 4. Divergence Detection
Divergence occurs when price and MACD move in opposite directions.
🔸 Bullish Divergence:
Price makes lower lows
MACD makes higher lows
→ Hidden buying pressure, trend reversal likely
🔸 Bearish Divergence:
Price makes higher highs
MACD makes lower highs
→ Trend weakening, reversal likely
🔹 Confirm with:
RSI, when the lower timeframe RSI is oversold and the higher timeframe MACD is rising, then it's a good sign, and the opposite is true for bears.
Support/resistance zone: draw trendlines either on the volume or price and watch out for retests on the breakout.
Candlestick reversal patterns: some bearish patterns are bullish on indexes because of dollar cost averaging.

Short setup TiqGPT MARKET NARRATIVE:
Analyzing the Tesla Inc. charts across multiple timeframes, we observe a consistent downtrend from the daily (1D) to the 1-minute (1m) timeframe. The price action shows a series of lower highs and lower lows, indicative of a bearish market structure. The 1D chart reveals a significant bearish momentum with recent candles closing near their lows, suggesting strong selling pressure. This trend is echoed in the 4-hour (4h) and 1-hour (1h) charts, where price has failed to reclaim higher levels, instead forming bearish continuation patterns.
The 15-minute (15m), 5-minute (5m), and 1-minute (1m) charts provide a more granular view of the selling pressure, with price consistently making new lows. The absence of significant bullish retracements across these lower timeframes indicates that liquidity is being taken rather than created, as sellers push the price downward without substantial opposition.
INSTITUTIONAL THESIS:
Institutions appear to be in a distribution phase, offloading shares which is evident from the sustained downward movement and lack of significant pullbacks. This suggests a continuation of the bearish trend with potential further downside.
LEARNING POINT:
The consistent lower highs and lower lows across all timeframes highlight a strong bearish momentum engineered by institutional selling pressure.
SIGNAL: WAIT
SYMBOL: TSLA
ENTRY PRICE: $317.60
STOP LOSS: $322.00
TARGET PRICE: $310.00
CONDITION: Sell on a slight pullback to $317.60, which aligns with recent minor resistance levels on lower timeframes.
RATIONALE: Calculated risk/reward ratio of 1:1.7 (Risk=$4.40, Reward=$7.60) does not meet minimum 2:1 requirement. Waiting for better institutional setup with improved risk parameters.
Momentum & Exhaustion: No signs of exhaustion in selling, with candles closing near lows.
Liquidity Behavior: Continued push lower without significant retracements suggests ongoing institutional distribution.
Pressure Analysis: Strong selling pressure evident from the lack of bullish counter-moves.
Context Awareness: Price is trending down with no significant areas of demand observed that could halt the bearish momentum.
STRATEGIES USED:
Multi-Timeframe Bearish Continuation
Distribution Phase Trading
URGENCY: HIGH
TIMEFRAME: Short-term
CONFIDENCE SCORE: 85%
RISK/REWARD RATIO: Risk=$4.40, Reward=$7.60, Ratio=1:1.7 (Below 2:1 minimum)
Risk = $322.00 - $317.60 = $4.40
Reward = $317.60 - $310.00 = $7.60
Ratio = $7.60 / $4.40 = 1.72
RECOMMENDATION:
The calculated risk/reward ratio of 1:1.72 does not meet the minimum requirement of 2:1. Therefore, the recommendation is to WAIT for a better risk/reward setup or further confirmation of institutional activity that could provide a more favorable entry point.

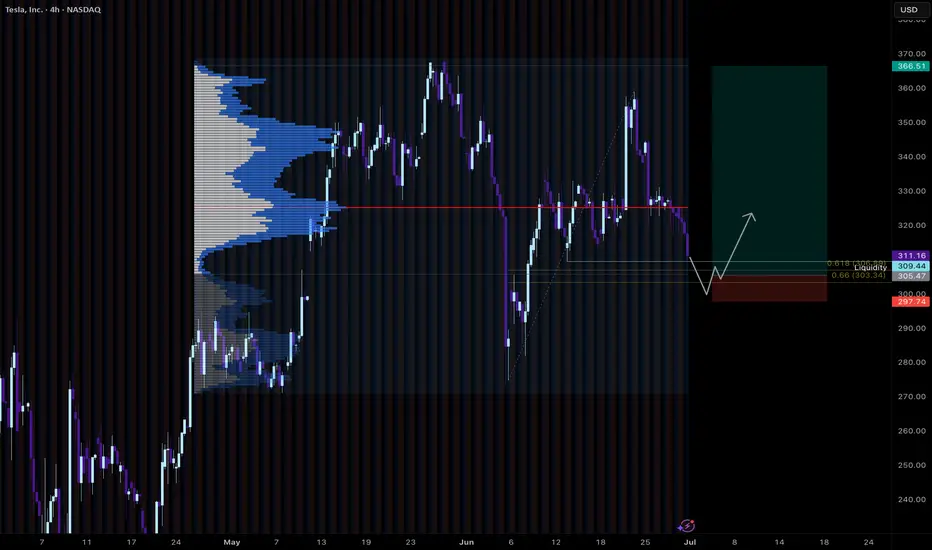
Tesla LongCurrently hanging around at the Golden pocket of the uptrend.
Would be interested in a long if we got a retrace to the whole move golden pocket, which sits on the current range VAL. Would also sweep liquidity from the recent lows.
Would need to see a good reaction to take the trade.
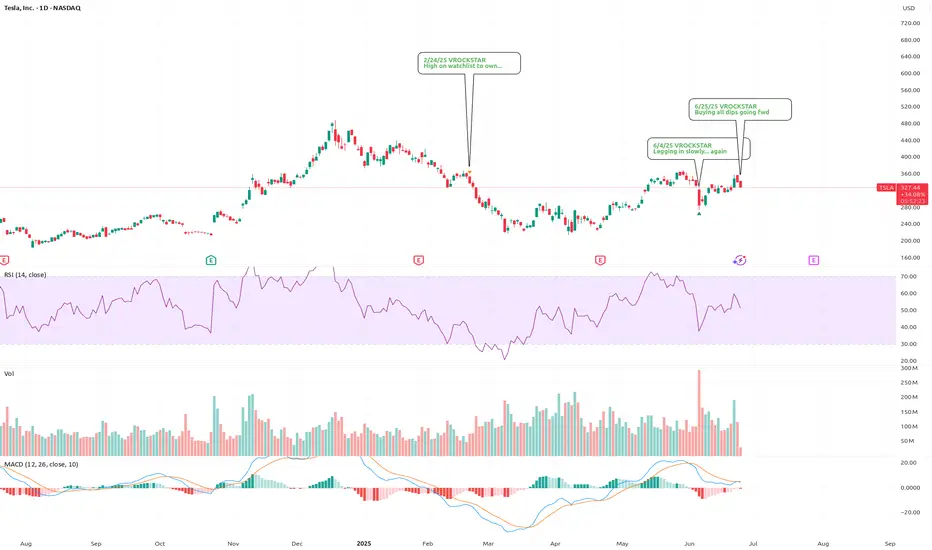
6/25/25 - $tsla - Buying all dips going fwd6/25/25 :: VROCKSTAR :: NASDAQ:TSLA
Buying all dips going fwd
- "successful robotaxi or not successful robotaxi"
- elon's clearly won the vision game
- scaling hardware (cars, infra, optimus, solar) is m-o-a-t
- so is a humanoid and robotaxi robotics company that doesn't burn cash worth a trilly in today's world if the upside is perhaps 5-10 tn in the coming decade (worst case) and your downside here is what? 30... 40... 50%? Is it more? unlikely.
- so "yes" we remain entering consumer recessy. yes "tsla" shares r not cheap. and that's for a reason.
- buy scarce paper.
- buying all dips here.
- i like the dec '27 deep ITM leaps. allows me to wrangle size with a bit more flexibility in the coming months.
- but this rocketship has yet to make any meaningful moves.
- $1,000/shr is the 2Y tgt.
V
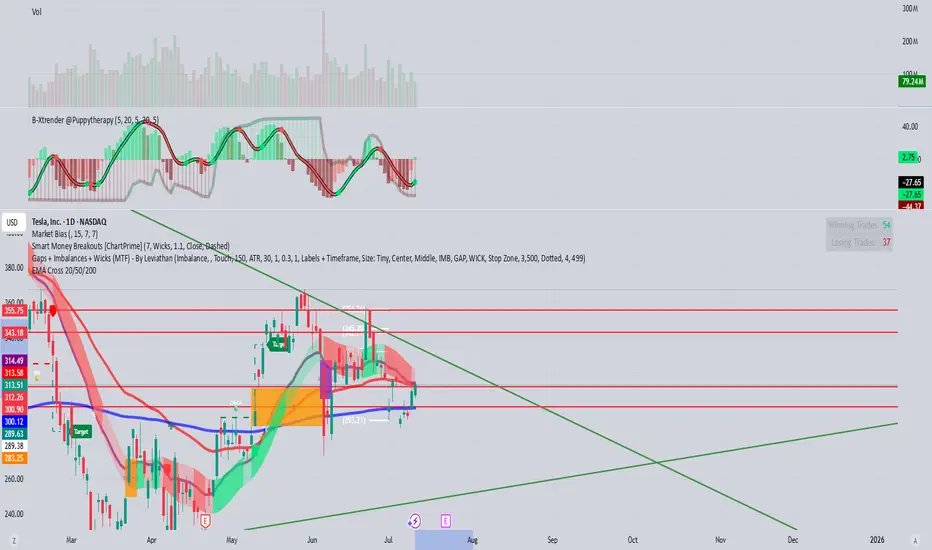
TSLA : Technical Analysis Report - 30 June 2025Trend:
The primary trend (big picture) is upward. Bullish momentum is weak.
Short Term Trend : sideways / consolidation. Regardless of the larger trend, momentum within a sideways range is typically neutral or flat, reflecting a temporary balance between buyers and sellers.
Pattern : Symmetrical Triangle Patte rn
A symmetrical triangle is like a market catching its breath. It's a temporary pause in a trend. Once the price breaks out of the triangle, it usually continues in the same direction it was going before. Until that breakout, it's a neutral pattern.
Key levels :
R2 - 366
R1 - 356
S1 - 315 -The price is facing the support 215.
S2 - 275
Tips for Trading
Wait for a confirmed breakout (e.g., a daily candlestick close above/below the trendline) to avoid false signals
-----------------------
Note :
If you’re interested in receiving detailed technical analysis reports on your selected stocks, feel free to reach out to me. I can provide you with customized reports covering trends, key levels, momentum, patterns, and price projections to support your investment decisions.

TESLA falling down to 250 USD?Tesla is consolidating in a tight range, showing bearish pressure near the lower boundary of the formation. Moving averages (MA 5/10/30/60) are flattening, indicating a loss of bullish momentum, while the Wavetrend oscillator has issued a sell signal (bearish crossover below the zero line). A downside breakout from this range projects a potential move toward the $250 level, as illustrated by the measured move. This bearish scenario gains validity if price breaks below the $315 support level.
Possible TP: 250 USD

Tesla-Heading For A New ATH?NASDAQ:TSLA is looking good!
Robo-Taxi, Optimus Robots...and so more to come!
Tesla to $692 in the next years? Or months?
#stocks #tesla #stockmarket

Long-Term Growth Potential in the Face of Short-Term ChallengesCurrent Price: $323.63
Direction: LONG
Targets:
- T1 = $331.50
- T2 = $345.00
Stop Levels:
- S1 = $319.50
- S2 = $310.00
**Wisdom of Professional Traders:**
This analysis synthesizes insights from thousands of professional traders and market experts, leveraging collective intelligence to pinpoint high-probability trade setups. The wisdom of crowds principle suggests that aggregated perspectives from experienced professionals build a more balanced outlook on Tesla, reducing emotional biases and highlighting consensus opportunities in the market.
**Key Insights:**
Tesla is currently navigating through a challenging phase characterized by competitive pressures in both China and Europe. Recent macroeconomic headwinds, including rising interest rates and shrinking global spending on electric vehicles, have fueled concerns about short-term sales performance. However, analysts remain optimistic about Tesla's innovation leadership, particularly in AI-driven robotics, battery technology, and autonomous mobility development. The recent technical charts reflect a narrowing wedge formation, and a breakout above $354.78 could confirm renewed bullish momentum, offering significant upside potential.
**Recent Performance:**
Over the past few weeks, Tesla has experienced tight price consolidation, underlying near-term indecision among market participants. While its stock price remains below short-term moving averages, signaling bearish pressure, longer-term sentiment is bolstered by overall optimism in the technology sector. Additionally, fluctuations in deliveries and revenue from various regions continue to impact day-to-day trading sentiment, with the stock showcasing higher volatility during earnings updates.
**Expert Analysis:**
Market analysts exhibit cautious optimism surrounding Tesla. Short-term concerns linger about declining sales growth in legacy markets such as Europe and the loss of its dominant position in China due to rising competition from local manufacturers like BYD. However, whether Tesla can monetize its cutting-edge developments in AI, robotics, and autonomous driving remains a focal point of its long-term strategy. Analysts agree that while these initiatives may redefine the EV market over the next 5-10 years, revenue realization is expected to be slow and could dampen speculative enthusiasm in the immediate term.
**News Impact:**
Tesla recently announced the launch of its robo-taxi initiative, beginning trials in Austin, Texas, a move that challenges traditional mobility norms. While this innovation enhances Tesla's narrative as a disruptor in the industry, regulatory obstacles and scalability issues pose immediate hurdles that could delay market adoption. On the downside, Tesla saw declining deliveries in Europe and China, casting shadows over its near-term growth prospects in these critical regions. Investors should keep a close eye on upcoming earnings reports for clearer guidance on production schedules and delivery forecasts.
**Trading Recommendation:**
Based on recent technical consolidation and consensus expert views, traders are recommended to take a long position on Tesla with price targets of $331.50 and $345.00. The stock exhibits signs of medium-term upside potential if momentum aligns with broader bullish trends in the S&P 500 and technology sectors. Implement disciplined risk management with stop levels set at $319.50 and $310.00 to protect against unfavorable moves. Investing in Tesla provides exposure to a high-risk innovation-driven narrative; traders should evaluate their appetite for risk carefully before entering this position.

TLSA Catalyst Ranking and Market Update: June 2025Here's an updated/revised outlook for TSLA including all the primary
catalyst ranking and analyst ratings and overview of latest developments
🔋 1. EV Demand Growth
Strength: 9/10 → 9/10
Global electric vehicle adoption remains the dominant pillar. Tesla faces softer comp in Europe (–40.5% drop in May) wsj.com, but overall trend remains firmly upward. 🌍
🚗 2. Affordable Entry Level Model
Strength: 8.5/10 → 8.5/10
Tesla still on track to launch a < $25K EV in first half of 2025. Any delays or execution issues could pressure sentiment.
⚡ 3. Battery Cost & Margin Improvement
Strength: 8/10 → 8/10
Margins saw slight relief Q1, driven by cost cuts f, but macro headwinds persist.
🤖 4. Autonomy & Robotaxi Rollout
Strength: 7.5/10 → 8.5/10
Robotaxi debuted in Austin in June, sparking a ~10% one-day stock surge. Benchmark raised its target to $475/buy on the rollout—strong tailwind.
🚩 5. Competition
Strength: 7/10 → 6.5/10
Rivals like Xiaomi’s new YU7 are gaining ground. Tesla must maintain differentiation.
📉 6. Trade Policies & Tariffs
Strength: 6.5/10 → 6.5/10
Still relevant due to Tesla’s global footprint, though less front-page than before.
💰 7. Incentives & Subsidies
Strength: 6/10 → 6/10
U.S. IRA tax credit policies remain supportive; evolving eligibility remains a swing factor.
🛢️ 8. Commodity Costs
Strength: 5.5/10 → 5.5/10
Raw-material swings affect margins. Inventory hedges help but not wholly mitigate.
📈 9. Fed & Interest Rates
Strength: 5/10 → 5/10
A higher-rate environment still limits valuation multiples for growth-tier companies.
🎭 10. Musk Profile & Governance
Strength: 4/10 → 5/10
Analysts (e.g., Bradley Tusk) warn of being “massively overvalued” tied to Musk’s persona. Musk’s renewed focus on Tesla vs. other ventures (DOGE, SpaceX) will be watched.
________________________________________
🚀 Refreshed Catalyst Rankings
Rank Driver Score
1 EV demand growth 9
2 Affordable model 8.5
3 Battery costs/margins 8
4 Autonomy/robotaxi execution 8.5
5 Competition 6.5
6 Trade & tariffs 6.5
7 Regulatory incentives 6
8 Commodities 5.5
9 Fed Rates 5
10 Musk reputation/governance 5
________________________________________
📊 Latest Analyst Ratings & Targets
• Benchmark / Mickey Legg: Buy, target $475 (from $350) — cites robotaxi safety-first rollout, automation upside
• Wedbush / Dan Ives: Outperform, target $500 — labels TSLA as an “embodied AI compounder”
• Morgan Stanley / Adam Jonas: Buy, target $410 — bullish on AI/self driving positioning
• Cantor Fitzgerald / Andres Sheppard: Overweight, target $355 — optimism rooted in robotaxi and FSD rollout
• UBS / multiple: Sell, target $215–225 — skeptical on demand and valuations
Consensus snapshot (FactSet):
• Mean price target ≈ $311–$312
• Mean rating between Hold–Buy (~2.7/5)
________________________________________
🗞️ Recent Headlines
• “Tesla completes first fully autonomous Model Y delivery ahead of schedule”
• “Tesla robotaxis launch in Austin” boosting momentum
• “EU Tesla sales slump” May registrations down 40.5%
• “Tesla fires longtime insider as Europe slump deepens”
________________________________________
🔍 Summary Outlook
Tesla shares are navigating a volatile interplay of strong tech promise and unfolding execution risks:
• Overweight view (Legg, Ives): Robotaxi rollout and AI thrust fuel upside. Automation transition seen as transformative.
• Bullish base (Jonas, Sheppard): AI, FSD rollout, affordable model support core thesis.
• Skeptical view (UBS, Tusk): Slumping deliveries in Europe/China, heavy valuation, Musk's external focus seen as emotional dampener.
Upcoming triggers to watch:
1. Q2 delivery and production results (mid July).
2. Robotaxi rollout execution/regulatory clearance.
3. Margin trajectory as costs evolve.
4. FSD reliability and expansion in new markets.
________________________________________
✅ What This Means for You
• Bull case: Robotaxi + AI momentum may drive TSLA back toward targets in the $475–500 range.
• Bear case: Weak deliveries, macro and competition pressures could cap shares or trigger pullback toward prior support ($330–350).
• Neutral: Watch near-term delivery and autonomy news to shape next move.

TSLA Bearish Breakdown in Progress – $322 or Bust? TSLA Bearish Breakdown in Progress – $322 or Bust? Monday Puts On Watch 🔻
🧠 GEX-Based Options Sentiment:
Tesla is currently trading right at a critical GEX flip zone. The $330 level used to be gamma support but has now broken, leaving TSLA vulnerable to a drop toward the high-risk gamma pocket between $320–$310.
The Highest positive GEX zone was stacked near $330–$340, but that structure has failed. The gamma walls above—like $347.5 and $350—now serve as resistance, especially with no strong call flow to support a squeeze.
The downside gamma structure is open. $310 is a soft magnet, but $300 is where the largest negative GEX sits, along with the 2nd and 3rd Put Walls. If TSLA continues slipping, a drop into the $300 zone could be swift.
Implied Volatility Rank is at 25.2, with IVX above 68 — meaning options are expensive, so spreads are safer than naked calls or puts. Flow is still 8% call-heavy, but that can flip hard if Monday starts red.
🔧 Options Trade Setup (for Monday–Wednesday):
Bearish Scenario (favored setup):
If TSLA opens weak or rejects $325–$327.50 area again, consider buying a PUT debit spread, such as 322p/310p or 320p/300p (July 3 expiry).
Target zone: $312, then $300 gamma flush.
Stop: reclaim of $331 with bullish momentum.
Bullish Scenario (lower probability):
If TSLA reclaims $330 and breaks trendline toward $335, consider a CALL debit spread like 335c/345c (Jul 3).
Target zone: $345–$350.
Cut if it falls back under $327.50.
📉 Intraday Technical Breakdown (1H Chart):
The price has confirmed a CHoCH + BOS combo, rejecting from supply and pushing below the rising trendline. Friday’s recovery attempt stalled right under that broken structure, and sellers took over late day.
The 1H chart is forming a bearish descending channel, with price currently trying to bounce off short-term demand, but failing to reclaim the key mid-zone.
This current setup favors continuation lower unless bulls can pull off a breakout early Monday. Otherwise, the path of least resistance is down.
📌 Key Levels to Watch:
$330.00 – Former GEX support, now resistance
$331.10 – Trendline and bearish trigger flip
$322.00 – Key support line (last defended Friday)
$320.00 – Gamma pivot zone
$310.00 – GEX magnet and low-volume shelf
$300.00 – Highest negative GEX and major PUT support zone
$345.25 – Upper trendline + prior supply rejection
✅ Thoughts and Monday Game Plan:
TSLA is sitting on the edge of a breakdown. The gamma structure supports further downside as long as price stays below $330. Watch for early rejection at $325–$327.50 to initiate puts.
If bulls manage to gap and reclaim above $331, reassess for a reversal setup — but for now, structure, volume, and GEX are all pointing down.
This is a reactive trade — wait for early confirmation on Monday and ride the wave, especially if SPY opens weak.
Disclaimer:
This analysis is for educational purposes only and not financial advice. Always trade with proper risk management and do your own due diligence.
