Tesla Bulls Assemble: It’s Time for a Clean Robbery🚨🔥TESLA STOCK ROBBERY BLUEPRINT: Thief Trading Heist Plan v2.0🔥🚨
(Swing & Day Traders, Scalpers — Welcome to the Ultimate Market Raid)
🌍 Greetings, Money Makers & Market Bandits!
Hola! Ola! Bonjour! Hallo! Marhaba! Salute from the global Thief Squad! 💰💸🕶️
Today, we’re unleashing a bold market raid on NASDAQ:TSLA (Tesla Inc.), using our signature Thief Trading Strategy™ — a fusion of technical precision, smart risk, and fundamental power. This is not your average trade idea — this is a robbery plan, tailor-made for those ready to outsmart the market with elite tactics.
🎯 The Mission: Steal the Bullish Breakout Before the Bears Wake Up!
Market Status:
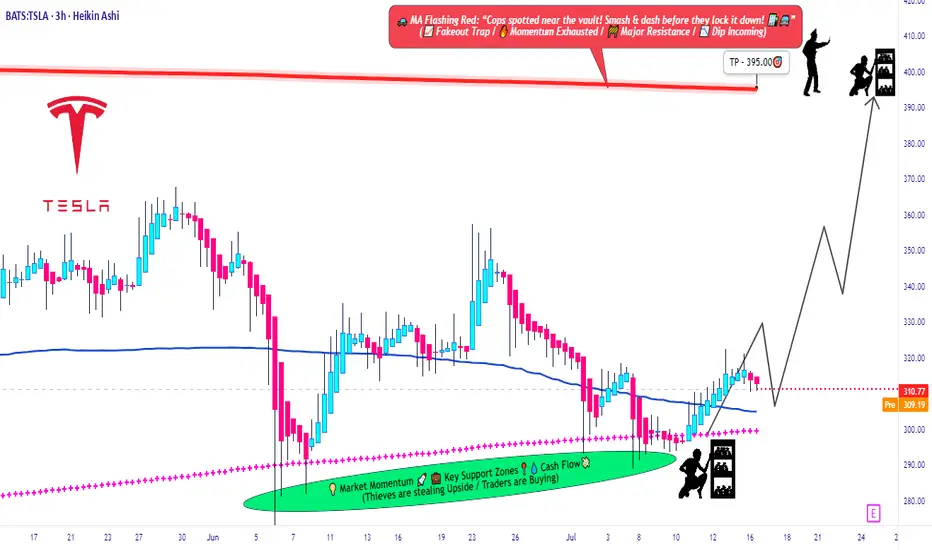
Tesla is showing early signs of bullish strength — short-term consolidation with a potential breakout toward the upper red zone. However, that red zone is where the “Police” (resistance + short sellers) wait to ambush — so we enter with strategy, not emotion.
🟢 Entry Zone – "Vault is Open, Thieves Assemble!"
We’re looking for a long entry anywhere inside the most recent pullback zones (use 15m / 30m candles). Place layered buy-limit orders like a DCA thief stacking charges, targeting the swing low or support wick.
🔑 Pro Tip: Be patient. Let the pullback bless your orders. We rob smarter, not harder.
🛑 Stop Loss – "Escape Route Planned"
Stop Loss = Placed under swing low (3H TF). Current suggested SL: $280.00 (adjust for risk profile).
💬 Thief Note: Your SL depends on position size, number of entries, and account leverage. Never risk your life savings on one job. 😉
🎯 Target Zone – "The Big Loot"
Main Target 🎯: $395.00
Optional Exit: Trail your SL and escape early with bags full of gains. Exit before the trap if heat rises. 🔥
👀 Scalpers – "Fast Hands Get First Cash"
Stick to the long side only. Shorting this train is standing in front of a robbery truck. Use trailing SLs and grab those quick gains.
If you're a small account thief — no worries — ride with the swing crew. We share the loot.
📊 Why the Heist Now?
TSLA's move is supported by:
🔍 Fundamental strength & positive sentiment
🌐 Macro tailwinds & sector rotation favoring EV/Tech
🧠 Intermarket & index alignment
📰 Bullish outlook from recent positioning and COT data
🧨 Consolidation base forming an explosive setup
⚠️ Caution Tape – News Alert Zone
🚨Stay Clear of Major News Releases!
Avoid opening fresh entries during high-impact news. Use trailing SLs to protect your gains. Market heat can go nuclear — be alert, not emotional.
💖 Support the Heist – Smash That BOOST Button!
If you love this Thief Strategy, hit the BOOST 💥
Help us reach more robbers, dreamers, and money makers across TradingView. Let’s build the biggest, smartest, most strategic trading crew ever.
📌 Disclaimer (We're Thieves, Not Financial Advisors)
This is not financial advice — it’s a strategic idea shared for educational purposes. Adjust based on your own risk profile. Never enter a robbery without a plan. 🧠💼
🔥 Stay locked in. Another market heist blueprint is coming soon.
Until then — keep your charts clean, your entries smart, and your exits legendary.
💸Rob the Market — The Thief Way™
🐱👤🎯📈🚀
TL0 trade ideas
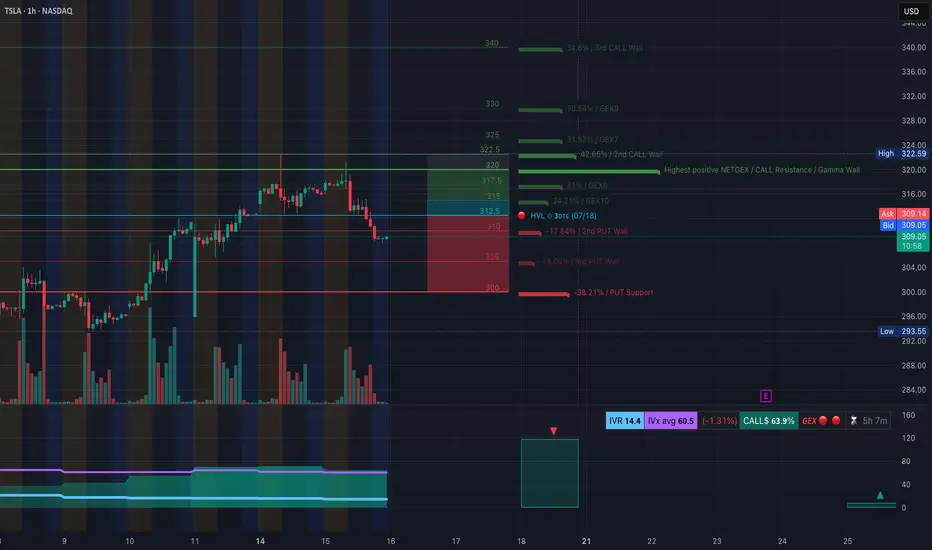
TSLA at a Turning Point. Gamma Flip + Price Breakdown? TAJuly 16🔍 GEX Analysis (Options Sentiment)
* Key Call Walls (Resistance):
* $322.5: +42.65% GEX — Major resistance and 2nd Call Wall
* $325 / $330: More overhead call resistance
* $317.5: Minor resistance
* Gamma Flip Zone (Highest Net GEX / Resistance):
* Around $320–322.5, price is likely to face supply pressure from dealers hedging short calls.
* PUT Walls (Support):
* $305: 2nd PUT Wall (−17.84% GEX)
* $300: PUT Support (−38.21% GEX)
* HVL (High Volume Level):
* $312.5: High-volume strike for this week’s expiration – significant battleground.
* IVR/Flow:
* IVR is 14.4 – low implied volatility.
* Call bias dominates: Calls 63.9% vs Puts.
* GEX sentiment = 🟥 Bearish leaning.
💡 Options Strategy Based on GEX
* Bearish Play:
* Buy 305P or 300P for short-term swing into the gamma void.
* Best risk:reward as dealers are likely to unwind positive gamma, accelerating downside toward PUT walls.
* Neutral-to-Bearish Strategy:
* Bear Call Spread around $317.5–$322.5 (above HVL, inside call wall congestion).
* Expect price rejection below $317.5 if no reclaim happens.
* Avoid CALLs unless price reclaims and holds above $317.5 with strong volume and momentum shift.
📈 1-Hour Chart Technical Analysis
* Structure:
* Bearish CHoCH and confirmed Break of Structure (BOS) below $310.
* Price dropped from the upper OB and failed retest confirms supply zone around $317–$321.
* Trendlines:
* Descending wedge forming with lower highs and current support at $307.97 and $305.
* Watch for bounce-to-fail retests at $312.5 or breakdown continuation.
* Zones to Watch:
* Bearish Order Block (OB): $316–$321 (purple zone) = Sell zone.
* Demand/Support Zone: $293–$296 (green box) – likely bounce zone.
📌 Trade Scenarios
* Bearish Intraday Trade Setup:
* Entry: Below $309 or retest rejection from $312.5
* Target: $305 → $300
* Stop: Above $313 or OB invalidation at $317.5
* Bullish Counterplay (Only if confirmed):
* Entry: Hold above $317.5
* Target: $322.5 → $325
* Stop: Break below $315
🎯 Final Thoughts
TSLA looks weak and in distribution after sweeping local highs. The current GEX map favors bearish continuation, and the 1H BOS confirms breakdown structure. Unless $317.5 is reclaimed, bears have the upper hand.
Disclaimer: This analysis is for educational purposes only and not financial advice. Always do your own research and manage risk before trading.
Tesla: Still Pointing LowerTesla shares have recently staged a notable rebound, gaining approximately 10%. However, under our primary scenario, the stock remains in a downward trend within the turquoise wave 5, which is expected to extend further below the support level at $215.01 to complete the magenta wave (3). This move is part of the broader beige wave c. However, if the stock continues to rally in the near term and breaks through resistance at $373.04 and $405.54, we would need to consider that wave alt.(II) in blue has already been completed (probability: 38%).
📈 Over 190 precise analyses, clear entry points, and defined Target Zones - that's what we do (for more: look to the right).

Tesla -> The all time high breakout!🚗Tesla ( NASDAQ:TSLA ) prepares a major breakout:
🔎Analysis summary:
Not long ago Tesla perfectly retested the major support trendline of the ascending triangle pattern. So far we witnessed a nice rejection of about +50%, following the overall uptrend. There is actually a quite high chance that Tesla will eventually create a new all time high breakout.
📝Levels to watch:
$400
🙏🏻#LONGTERMVISION
Philip - Swing Trader

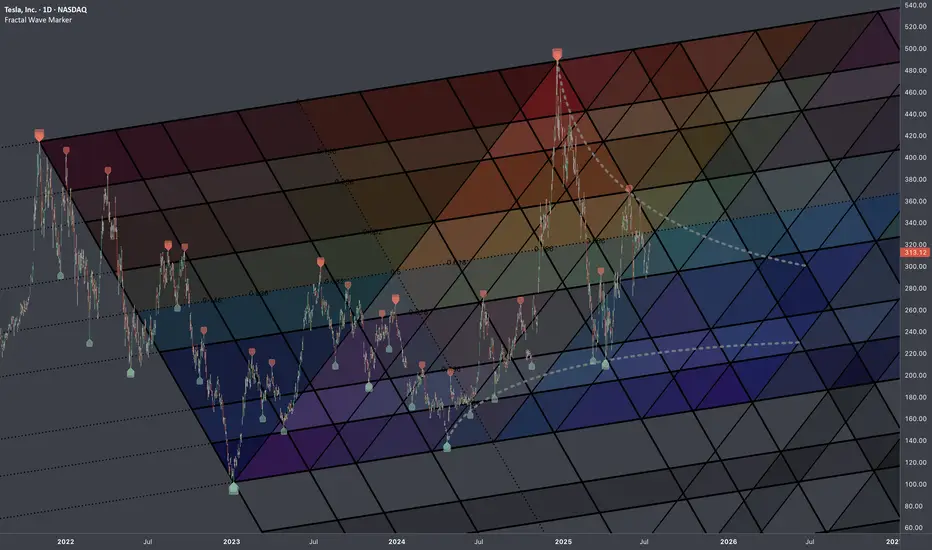
$TSLA: Fib InterconnectionsResearch Notes
Examining interconnection type with regressive angle:
Critical points:
Mapping with 3 fibonacci channels:
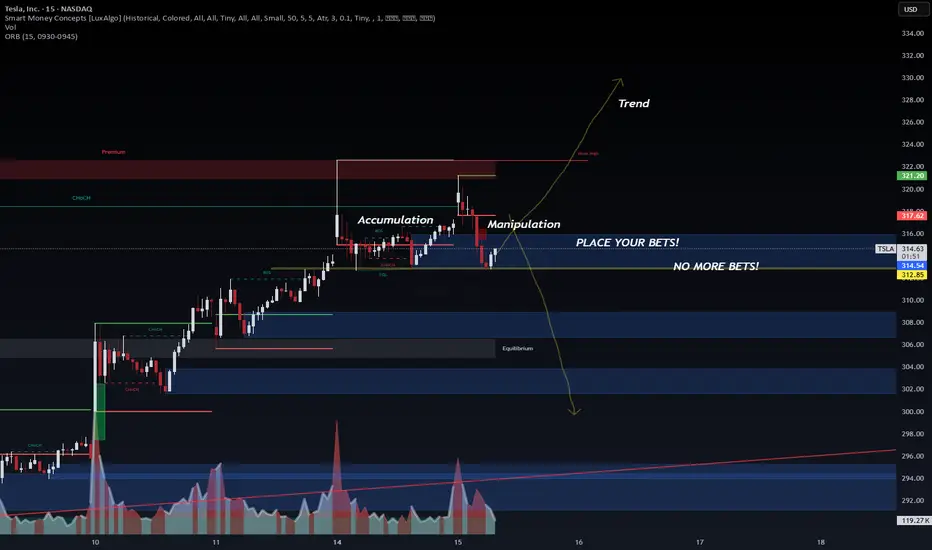
Classic accumulation, manipulation and trend @ TSLA.Looks like someone knows something, or is it just me hallucinating. Can't be both :D
Please see the chart for pattern analysis of what it seems to be a accumulation followed by manipulation, and now the stock is looking for its trend. Whatever happens, I think we are going to see a big move either direction. I am betting on the bullish side with 335 C contracts. Light position, starter.
Front-test, not fin advice.
TSLA - Explosive Bounce TSLA Before the Drop? | EW Analysis My primary view is that we’re in the final stages of an ending diagonal, which could lift the price to new all-time highs, potentially between $460 and $650. Wave 4 of this structure appears to have completed after precisely tagging key Fibonacci support, and since then, we've already seen a strong bounce from that low. I’m now watching for the development of the final wave in this pattern, which could deliver gains of over 100% from current levels.
However, I’m not fully convinced by the internal shape of the diagonal so far. That’s why I’m also have an alternative scenario: in this case, the recent low may have marked the end of Wave 2 within a much larger diagonal. If true, this opens the door to a much more extended rally potentially reaching $1,000 before we see a major correction.
That said, this second scenario is not my preferred one, and a decisive break below the recent lows would invalidate both counts.

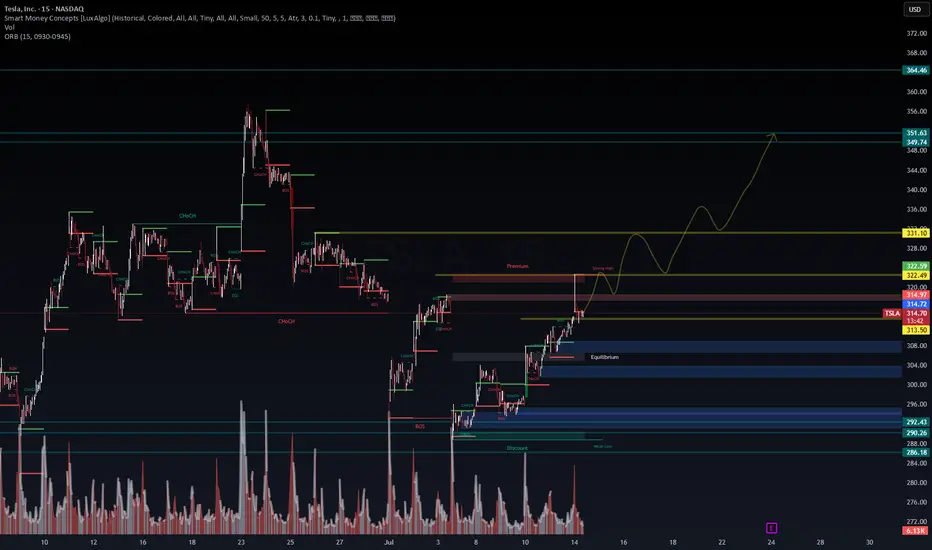
TSLA | Breakout Fuel Loaded – Will the Trend Accelerate Toward 🚗 TSLA | Breakout Fuel Loaded – Will the Trend Accelerate Toward $350?
🔍 Chart Type: 15m
🧠 System: Smart Money Concepts (LuxAlgo) + WaverVanir DSS
📊 Volume: 2.08M
🧭 Narrative: Liquidity Engine + Bullish Flow Momentum
📈 Current Price: $314.78
Clean breakout above BoS and ChgofCHoCH
Currently testing Strong High within a defined Premium Zone
EMA Stack (20/50/100/200) is bullishly aligned
📌 Key Levels to Watch:
📍 Premium Resistance: ~$315–$318
⚖️ Equilibrium Support: ~$309
💧 Discount Liquidity Zones: $292.43, $290.26
🚀 Upside Targets:
Minor: $322.49
Mid: $331.10
Major: $349.74 → $351.63 (projected wave peak)
📈 Bullish Case (Preferred by DSS Flow Model):
Retest of strong high → rally toward $322 then $331
Momentum and volume support trend acceleration
Break of $331 opens path toward $349.74–$351.63 (final wave)
📉 Bearish Invalidator:
Break below equilibrium ($309) → Discount zone retest
Watch $292–$286 for final liquidity sweep if rejection occurs
📅 Catalyst:
Earnings (📦 E icon marked) + macro tech sentiment could ignite explosive continuation
Market structure favors liquidity vacuum toward premium targets
🧠 VolanX DSS Sentiment: STRONG BULLISH
✅ Structure: Uptrend
✅ Volume: Expanding
✅ Momentum: Aligned
🟡 Risk: Premium rejection short-term possible
🔁 Executed via VolanX AI Scanner + WaverVanir DSS Engine
📊 “The Edge Is a System. The System Is Intelligence.”™
#WaverVanir #TSLA #SmartMoneyConcepts #PriceAction #LiquidityZones #Tesla #TechnicalAnalysis #VolanX #InstitutionalEdge #AITrading #QuantFinance
Stocks SPOT ACCOUNT: TESLA stocks buy trade with take profitStocks SPOT ACCOUNT: MARKETSCOM:TESLA stocks my buy trade with take profit.
Buy Stocks at 297 and Take Profit at 319.
This is my SPOT Accounts for Stocks Portfolio.
Trade shows my Buying and Take Profit Level.
Spot account doesn't need SL because its stocks buying account.

Tesla’s Next Move: Bullish Play Amid AI and Volatility Current Price: $313.51
Direction: LONG
Targets:
- T1 = $319.00
- T2 = $329.15
Stop Levels:
- S1 = $307.75
- S2 = $303.60
**Wisdom of Professional Traders:**
This analysis synthesizes insights from thousands of professional traders and market experts, leveraging collective intelligence to identify high-probability trade setups. The wisdom of crowds principle suggests that aggregated market perspectives from experienced professionals often outperform individual forecasts, reducing cognitive biases and highlighting consensus opportunities in Tesla.
**Key Insights:**
Tesla’s recent AI innovation and its expanding robo-taxi footprint signal long-term growth potential while short-term volatility requires strategic entry points. Market sentiment has significantly improved with positive news about the integration of Gro 4 AI, enhancing Tesla’s autonomous vehicle advancements. Trading at critical levels, Tesla offers a potential buying opportunity near key support zones.
The rallying investor focus on Tesla’s technological edge places it among the leaders in automation-driven growth. Despite macroeconomic pressures, Tesla’s proactive efforts in leveraging cost efficiencies and scaling autonomous solutions are helping to sustain bullish momentum.
**Recent Performance:**
Tesla demonstrated notable resilience during a turbulent earnings season, holding strong amidst mixed market signals. Recent delivery figures reflected a 13% year-over-year decline, which stirred concerns. Yet, the stock was buoyed by positive AI-related news and the market-wide optimism surrounding automation technologies, enabling Tesla to maintain its pivotal price range.
**Expert Analysis:**
Analysts acknowledge Tesla’s robust innovation pipeline centered around driver assistance and robo-taxi functionality powered by the Gro 4 AI platform. Concerns related to Elon Musk’s focus and governance have tempered enthusiasm for some traders, but these have largely been offset by Tesla’s strategic actions to sustain revenue and growth. Tesla’s prominent role in setting the market narrative for autonomous vehicles and broader EV adoption ensures ongoing support from long-term investors.
Tesla’s recent moves are growing investor confidence as it seeks to hedge against broader economic uncertainties and mitigate risks around regulatory changes. Its expansion strategy continues to highlight its leadership within the EV space, while early adopters of its AI-driven solutions may set the pace for sustainable revenue expansion.
**News Impact:**
The integration of Gro 4 AI is expected to significantly enhance Tesla’s robo-taxi and autonomous vehicle functionality, enabling it to capture market share in urban mobility services. Tesla’s announcement of an expanded robo-taxi fleet targeting key metropolitan areas could help offset delivery declines and drive future recurring revenues. While concerns about Elon Musk’s governance persist, ongoing innovation continues to support Tesla’s bullish outlook in global EV markets.
**Trading Recommendation:**
Tesla’s current price action signals an advantageous entry point for a long position, reinforced by recent bullish news and industry-leading innovations. Short-term traders can target $319.00 and $329.15 while maintaining disciplined stop-loss levels at $307.75 and $303.60. With strong support from institutional sentiment and expanding AI applications in its product line, Tesla offers substantial upside for bullish investors.
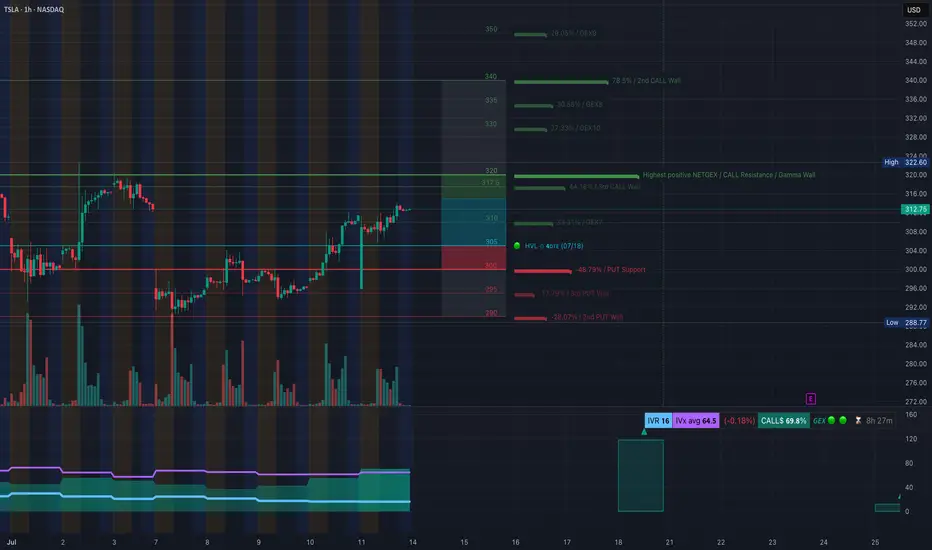
TSLA TA – Call Side Dominance Nearing Resistance-July 14TSLA GEX Analysis – “Call Side Dominance Nearing Critical Resistance 💥”
GEX Snapshot:
* Highest Positive GEX / Resistance: $320 – This is where call positioning is heaviest and likely where dealer hedging could resist further upside.
* Call Walls:
* $317.5 (44.18%)
* $320 (High NetGEX)
* $335–$340 (Intermediate resistance, weaker positioning beyond)
* Put Walls:
* $300 (48.79% support)
* $295 / $290 (3rd/2nd tier walls)
Options Oscillator:
* IV Rank (IVR): 16 (Low)
* IVx avg: 64.5
* Call Positioning: 69.8% (very bullish skew)
* GEX: 🔰 Bullish
🎯 Options Trade Setup:
Direction: Cautiously Bullish – but close to key resistance!
⚡ Aggressive Bullish Setup:
* Entry: Near $312.75 (current price)
* Strike: Buy $317.5C or $320C expiring this week
* Target: $320+
* Stop: Close below $308
* Note: Watch dealer hedging around $320. If TSLA breaks $320 with strength, gamma squeeze toward $335 is possible.
🛡️ Bearish Reversal Setup (if rejected at $320):
* Strike: Buy $310P or $305P (next week expiry)
* Trigger: Rejection at $320 + breakdown below $311
* Target: $304–$300
* Stop: Above $321
📉 TSLA 1-Hour Chart Analysis – “Breakout Zone or Fakeout Trap? Watch These Levels 🎯”
Structure:
* TSLA broke above the CHoCH and BOS zones between $308–$310. Price is consolidating under the $317.5–$320 resistance (also seen on GEX).
* There’s a clean ascending wedge/channel forming – upper boundary is near $320, and the lower trendline is near $304.
Key Zones:
* Supply Zone (Purple): $317.5–$320 (watch for rejection or breakout)
* Support: $309.8 (BOS zone), then $304 (trendline + demand overlap)
* Demand Zone: $293.5–$296 (origin of last rally)
🛠️ Trade Scenarios:
🔼 Bullish Continuation:
* Entry: Break and hold above $320
* TP1: $325
* TP2: $335
* SL: Below $311
🔽 Bearish Pullback:
* Entry: Rejection at $317.5–$320 zone and break below $309
* TP1: $304
* TP2: $296
* SL: Above $320
✅ Summary:
* GEX favors calls but $320 is a critical gamma wall – if broken, it opens room toward $335+.
* On the chart, watch the rising channel and upper resistance at $320.
* Bullish momentum is still intact unless $309 fails.
* Stay nimble: scalp calls on breakout, or prepare for a reversal put if there's rejection and structure break.
Disclaimer: This analysis is for educational purposes only and not financial advice. Trade at your own risk with proper risk management.
TSLA / Earning seasonNASDAQ:TSLA showing nice price action bounce off the base last week. With earnings season here, watch the $315 level — a breakout could send it toward $320 and $326 next 🚀📈 #TSLA

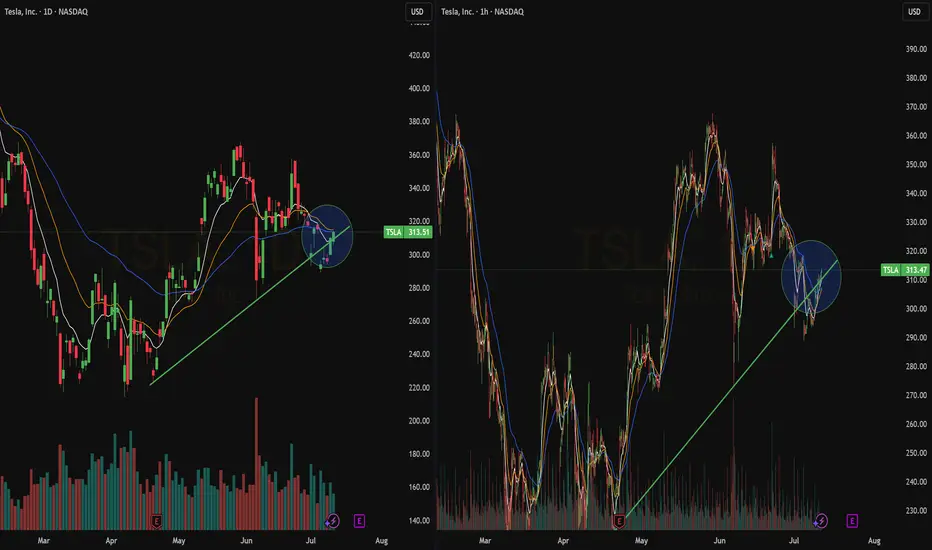
Tesla could make a move here... (July 13, 2025)Tesla's 2 Day chart looks bullish here with the RSI, let's talk about it!

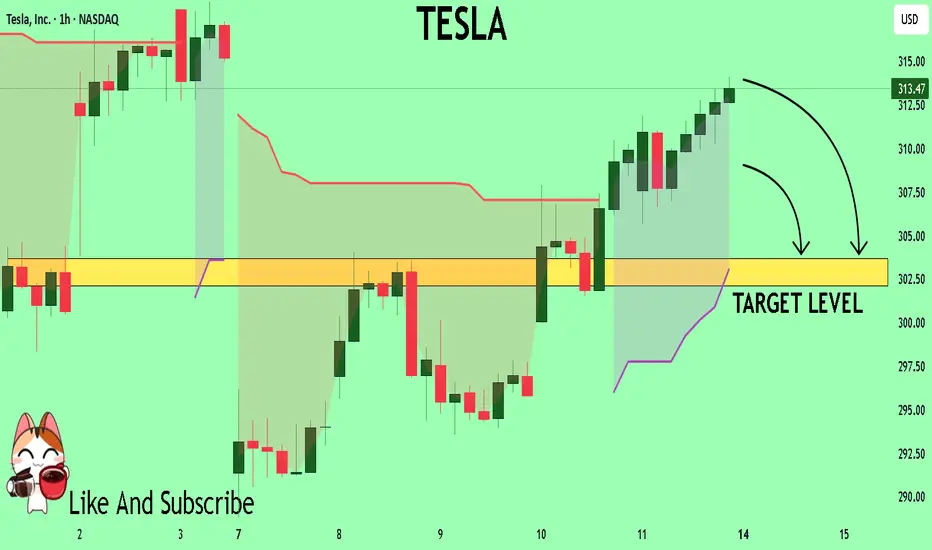
Quick Update : TSLABullish Crossover on the hourly chart at the bottom of the channel.
The action of the last hours is weak as can be seen by the lack f volume.
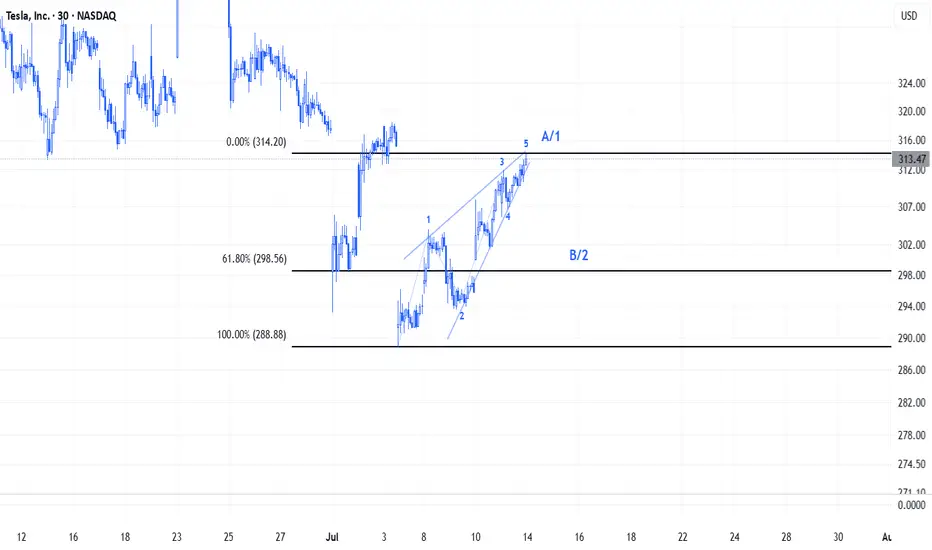
TSLA Elliott Waves We can clearly see that a Leading Diagonal is formed on TSLA's chart.Leading Diagonal usually occurs on Wave A or Wave 1.After this chart pattern, a correction often follows reaching nearly the 61,2% fib levels of the Diagonal
TESLA My Opinion! SELL!
My dear friends,
Please, find my technical outlook for TESLA below:
The price is coiling around a solid key level - 313.47
Bias - Bearish
Technical Indicators: Pivot Points Low anticipates a potential price reversal.
Super trend shows a clear sell, giving a perfect indicators' convergence.
Goal - 303.67
About Used Indicators:
The pivot point itself is simply the average of the high, low and closing prices from the previous trading day.
Disclosure: I am part of Trade Nation's Influencer program and receive a monthly fee for using their TradingView charts in my analysis.
———————————
WISH YOU ALL LUCK
$Tsla $350 looks promisingNASDAQ:TSLA $350 looks promising in the upcoming weeks.
AMEX:SPY NASDAQ:QQQ NFA
I am bullish on TSLAI have not changed my buy bias for this baby.
II will continue adding TSLA to my portfolio with $360 and $400 as my medium-term take profits.
Share your thought.
If you found this helpful, like, follow and share

TESLA: Bearish Forecast & Bearish Scenario
Our strategy, polished by years of trial and error has helped us identify what seems to be a great trading opportunity and we are here to share it with you as the time is ripe for us to sell TESLA.
Disclosure: I am part of Trade Nation's Influencer program and receive a monthly fee for using their TradingView charts in my analysis.
❤️ Please, support our work with like & comment! ❤️

How We’ll Trade Earnings This Season Earnings season is almost here — and if you're with QS, you’re already holding the most powerful edge in the market.
Let me walk you through how QS trades earnings, why we built 💸earning-signal, and how you can use it most effectively this quarter.
---
📜 A Little History: The Birth of 💸earning-signal
When QS launched in early April, we started with just two short-term signals:
⏰0dte
📅weekly-options
Both focused on short-term options trades.
Then came TSLA earnings in late April. That’s when we launched our very first 💸earning-signal — and nailed the prediction.
Since then?
We’ve had one of the best earnings win streaks on the internet. Period.
📌 Don’t take my word for it — check:
#✅signal-recap for the track record
#🤑profits and #🤩member-testimonials for real wins from members
---
🤖 Why We Built a Separate Earnings Signal
Earnings are not regular trading days. The dynamics are completely different.
On normal days, a stock might move <1%
On earnings? 10–20% swings are common
This is what we call a “pivot event” — and it requires a different engine to predict.
That’s why we separated:
📅 #weekly-options → normal day-to-day setups
💸 #earning-signal → high-volatility earnings plays
---
🧠 How a Human Would Trade Earnings...
If you wanted to manually trade an earnings report, you’d need to analyze:
Past earnings reactions
Analyst expectations
Earnings call language
Financial statement surprises
Options IV & skew
Post-earnings stock behavior
This would take hours (or days) — and most retail traders don’t have time.
---
⚙️ How QS AI Does It Instead
We built 💸earning-signal to do all that work for you — and more.
✅ It pulls in all the data above
✅ Runs it through 5 top LLM models (each acts as an independent analyst)
✅ Aggregates their insights + calculates probability-weighted direction & strategy
✅ Uses fine-tuning to learn from its past prediction success/failures
This means: faster decisions, deeper insights, and better accuracy — every week.
We don’t just run predictions. We let the AI learn from past mistakes and self-improve each quarter.
---
💥 Results Speak for Themselves
Last season, we nailed:
TSLA
MSFT (10x–20x winners!)
NVDA
AAPL
And many more...
All based on this unique AI-driven earnings analysis stack.
This season?
We’re going harder, faster, and even smarter. 📈
🎯 The goal is clear:
Make 💸earning-signal the #1 earnings prediction system in the world.
---
🧩 Final Notes
Earnings are 10x harder to trade than regular days
But with QS, you’re equipped with 500x the speed and insight of an average trader
Upgrade if you haven’t yet: #💰upgrade-instructions
Earnings season kicks off next week
Let’s get it.
Let’s win big.
Let’s make season 2 of 💸earning-signal our most legendary yet. 🚀💸

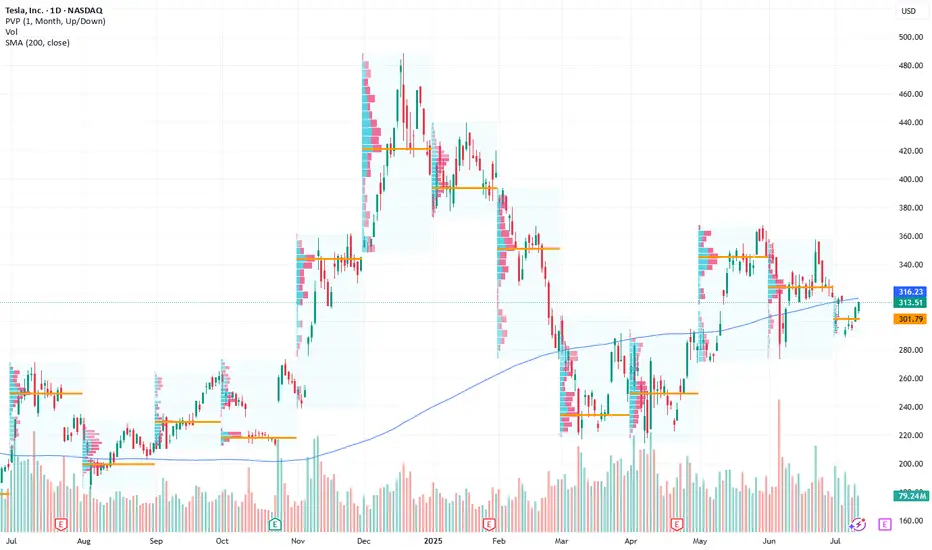
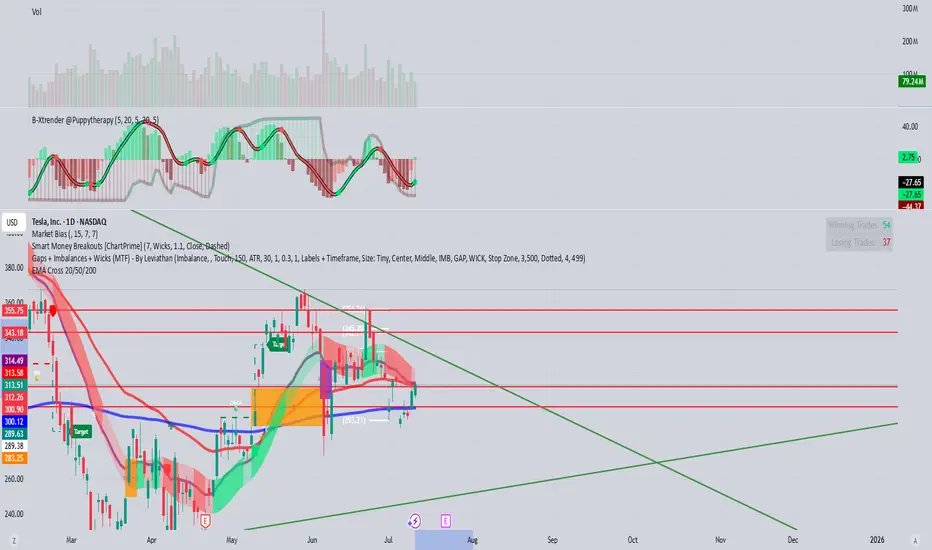
Tesla - Major Breakout BrewingTesla has been going through the wringer, between Robotaxi news, tariffs and the ongoing feud between the most powerful man in the world (Trump) and the richest man in the world (Elon). No doubt the news has had its fair share of impact on the stock. But Technicals will always hold more weight than news. I'll breakdown a few reasons why I believe this stock is due for a major run to ATHs
As you can see on this 4H chart, a nice falling wedge is forming and PA is respecting it, even with the wild gaps. On top of this being a bullish pattern, TSLA is also in a crucial area of support within the $290s . If you look back to Jun 9th 2025, you can see Tesla bounced from the 281 level to the 330s which is another indicator of strong support. Not to mention, a the 50 MA crossed the 200 MA on the daily on July 1st which is another bullish indication. The wedge looks to bottom out at the 280 level but I don't see this stock going that low. $290, 291 is an optimal entry to go long.
The long term trend line from April 21st 2025 has not been completely invalidated as of yet. If it retests at 310 and falls back within the wedge, I am still bullish. If price falls under $280, I am bearish. But until then, load up because the next stop is $350 after breakout, then $400, then ATHs. I'm expecting the breakout to happen by earnings or potentially before if this unnecessary feud between Trump and Elon ends.
P.S. I didn't get a good entry on this trade but I have a long position due to expire on the 25th.
Good luck trading.
-AceBoogieWitMe

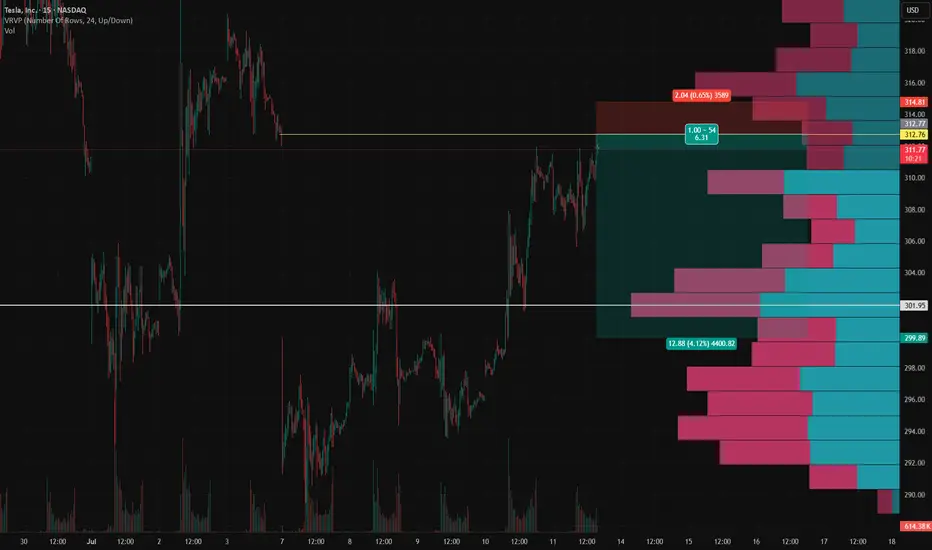
TSLA Short Setup – Fading the July 7 Gap FillTSLA Short Setup – Fading the July 7 Gap Fill 📉
This short idea on TSLA builds off a key gap fill from Monday, July 7 , combined with a strong local volume profile and risk-reward alignment on the 15-minute chart.
Entry: $312.76
Stop Loss: $314.81 (above gap resistance and local high)
Target: $299.89 (gap base and volume shelf)
RR: ~6.3R
Why I'm shorting here:
TSLA has just filled the July 7 gap , which often acts as a technical resistance zone on retest.
Price stalled right as it completed the fill — with visible hesitation and selling pressure stepping in.
VRVP shows low liquidity above, suggesting diminished reward for upside continuation.
Below, there's a clean volume shelf around $294–$300 that could attract price if weakness confirms.
Trade Logic:
This is a classic fade-the-gap-fill setup, targeting the lower edge of the volume cluster for a potential bounce or reversal zone.
As always: size accordingly, stick to the stop, and don’t chase if the entry’s already gone.
Thoughts? Anyone else watching this gap level?
TSLA, Long, 1D✅ TSLA has just broken out of a clear symmetrical triangle pattern, signaling a potential bullish continuation.
Yesterday’s daily candle was a white Marubozu, indicating strong buying pressure and clear dominance by the bulls.
LONG 📈
✅ Like and subscribe to never miss a new technical analysis! ✅
