TUI - EUR Stock Quote | Chart & Forecast SummaryKey Indicators On Trade Set Up In General
1. Push Set Up
2. Range Set up
3. Break & Retest Set Up
Notes On Session
# TUI - EUR Stock Quote
- Double Formation
* 7.600 EUR | Completed Survey | Subdivision 1
* Head & Shoulders Pattern | Configuration Entry
- Triple Formation
* Retracement Not Numbered
Next report date
—
Report period
—
EPS estimate
—
Revenue estimate
—
1.050 EUR
507.10 M EUR
23.17 B EUR
446.69 M
About TUI AG NA O.N.
Sector
Industry
CEO
Sebastian Ebel
Website
Headquarters
Hannover
Founded
1923
ISIN
DE000TUAG505
FIGI
BBG000BZ62H0
TUI AG engages in the provision of tours, hotels and resorts, and cruise services. It operates through the following segments: Hotels and Resorts, Cruises, and TUI Musement. The Hotels and Resorts segment refers to all its hotels and hotel shareholdings. The Cruises segment includes joint venture TUI Cruises, its subsidiary Hapag-Lloyd Cruises as well as the British cruise business Marella Cruises. The TUI Musement segment relates to providing services in destinations. The company was founded on October 9, 1923 and is headquartered in Hannover, Germany.
Related stocks

TUI stock can be considered contrarian Recent Performance: TUI's share price has been volatile, especially due to the COVID-19 pandemic. While the stock has recovered somewhat, it still hasn't reached its pre-pandemic levels. This underperformance relative to the broader market can make it a contrarian pick.
Industry Sentiment: The trav

TUI - 1 year HEAD & SHOULDERS══════════════════════════════
Since 2014, my markets approach is to spot
trading opportunities based solely on the
development of
CLASSICAL CHART PATTERNS
🤝Let’s learn and grow together 🤝
══════════════════════════════
Hello Traders ✌
After a careful consideration I came to the conclusion that:
-

Unveiling Potential Opportunities in $TUI1 Stock - LONGUnveiling Potential Opportunities in XETR:TUI1 Stock: Navigating the Surge and Identifying Profit Targets
In the wake of recent developments surrounding Tui, Europe's largest package holiday operator, the decision to potentially shift its stock exchange listing from the FTSE 250 to Frankfurt has

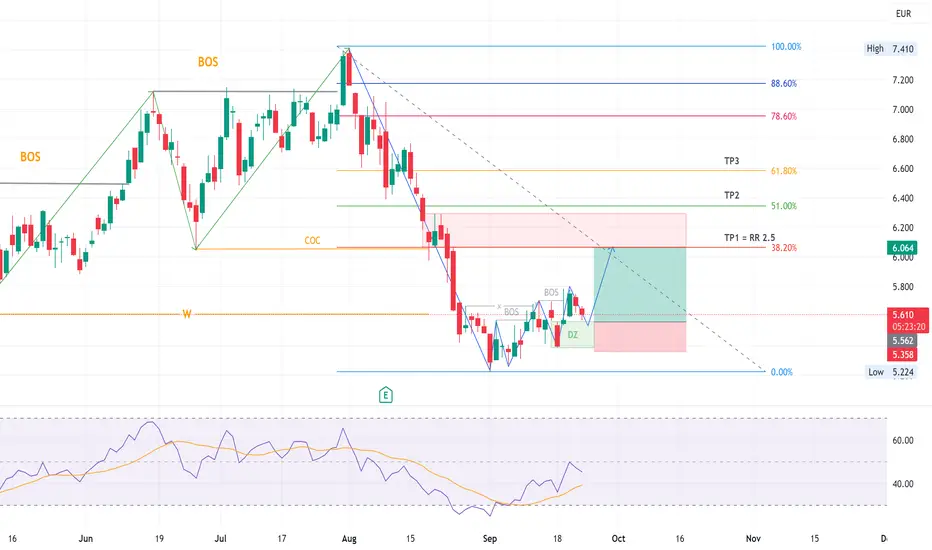
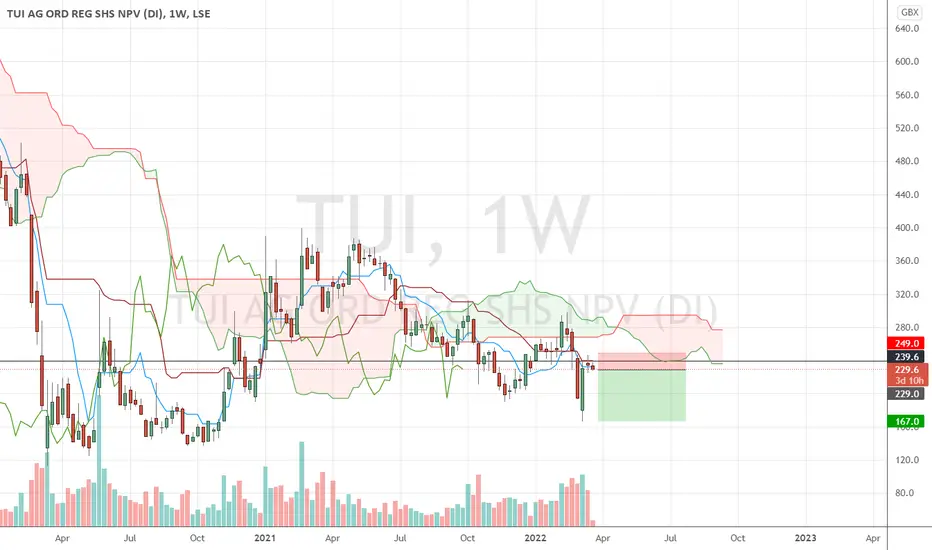
TUI1 - short time LONGSMonthly and weekly in downtrend.
D and H4 uptrend - price near D demand zone ( green area).
Waiting for 30 min to make an upside BOS for a long until the D supply area ( red zone) - counter trend trade!
SL - beneath the last H4 low (5.360 eur).
TP 1- could be at the last H4 high (5.798 eur), or to

TUI Reversal???BIG move incoming!
We will lose 5B of revenue.
But there is much potential since China is opening up

TUI Reversal???TUI is having hard times!!
We will need some more power upwards to get into the old range!!!

Russian Link to Haunt TUI!!?The Russian link is still weighing down on this stock. I have decided to short it on the backdrop of not only that fundamental news but rather the loss of momentum we saw from last week on approach of crucial resistance. Stop orders.
TUI - Good level to go long hereTUI seems to be bouncing in the downward parallel channel. Also at the spot where the gap dec 2020 is filled. Long term support slowly inchin uppwards. If TUI survives this next wave of covid it could really take off. SL under 2.2. TP1 at 2.99 (roughly channel roof). TP2 at 3.448 (gap close). TP 5.3

See all ideas
Summarizing what the indicators are suggesting.
Neutral
SellBuy
Strong sellStrong buy
Strong sellSellNeutralBuyStrong buy
Neutral
SellBuy
Strong sellStrong buy
Strong sellSellNeutralBuyStrong buy
Neutral
SellBuy
Strong sellStrong buy
Strong sellSellNeutralBuyStrong buy
An aggregate view of professional's ratings.
Neutral
SellBuy
Strong sellStrong buy
Strong sellSellNeutralBuyStrong buy
Neutral
SellBuy
Strong sellStrong buy
Strong sellSellNeutralBuyStrong buy
Neutral
SellBuy
Strong sellStrong buy
Strong sellSellNeutralBuyStrong buy
Displays a symbol's price movements over previous years to identify recurring trends.
A3E5KG
TUI AG WDL.21/28Yield to maturity
5.17%
Maturity date
Apr 16, 2028
XS277652366
TUI 24/29 REG.SYield to maturity
4.50%
Maturity date
Mar 15, 2029
XS2776523743
Tui 5.875% 29Yield to maturity
4.25%
Maturity date
Mar 15, 2029
A383JQ
TUI AG WDL.24/31Yield to maturity
−0.69%
Maturity date
Jul 26, 2031
See all TUI1 bonds
Frequently Asked Questions
The current price of TUI1 is 7.988 EUR — it has decreased by −0.42% in the past 24 hours. Watch TUI AG NA O.N. stock price performance more closely on the chart.
Depending on the exchange, the stock ticker may vary. For instance, on XETR exchange TUI AG NA O.N. stocks are traded under the ticker TUI1.
TUI1 stock has risen by 2.41% compared to the previous week, the month change is a 11.41% rise, over the last year TUI AG NA O.N. has showed a 30.65% increase.
We've gathered analysts' opinions on TUI AG NA O.N. future price: according to them, TUI1 price has a max estimate of 16.00 EUR and a min estimate of 7.30 EUR. Watch TUI1 chart and read a more detailed TUI AG NA O.N. stock forecast: see what analysts think of TUI AG NA O.N. and suggest that you do with its stocks.
TUI1 reached its all-time high on Jul 20, 1999 with the price of 154.388 EUR, and its all-time low was 4.366 EUR and was reached on Oct 23, 2023. View more price dynamics on TUI1 chart.
See other stocks reaching their highest and lowest prices.
See other stocks reaching their highest and lowest prices.
TUI1 stock is 2.04% volatile and has beta coefficient of 1.35. Track TUI AG NA O.N. stock price on the chart and check out the list of the most volatile stocks — is TUI AG NA O.N. there?
Today TUI AG NA O.N. has the market capitalization of 4.07 B, it has decreased by −3.92% over the last week.
Yes, you can track TUI AG NA O.N. financials in yearly and quarterly reports right on TradingView.
TUI AG NA O.N. is going to release the next earnings report on Aug 13, 2025. Keep track of upcoming events with our Earnings Calendar.
TUI1 earnings for the last quarter are −0.60 EUR per share, whereas the estimation was −0.65 EUR resulting in a 8.23% surprise. The estimated earnings for the next quarter are 0.14 EUR per share. See more details about TUI AG NA O.N. earnings.
TUI AG NA O.N. revenue for the last quarter amounts to 3.70 B EUR, despite the estimated figure of 3.88 B EUR. In the next quarter, revenue is expected to reach 6.19 B EUR.
TUI1 net income for the last quarter is −306.20 M EUR, while the quarter before that showed −85.40 M EUR of net income which accounts for −258.55% change. Track more TUI AG NA O.N. financial stats to get the full picture.
TUI AG NA O.N. dividend yield was 0.00% in 2024, and payout ratio reached 0.00%. The year before the numbers were 0.00% and 0.00% correspondingly. See high-dividend stocks and find more opportunities for your portfolio.
As of Jul 30, 2025, the company has 66.84 K employees. See our rating of the largest employees — is TUI AG NA O.N. on this list?
EBITDA measures a company's operating performance, its growth signifies an improvement in the efficiency of a company. TUI AG NA O.N. EBITDA is 1.81 B EUR, and current EBITDA margin is 7.73%. See more stats in TUI AG NA O.N. financial statements.
Like other stocks, TUI1 shares are traded on stock exchanges, e.g. Nasdaq, Nyse, Euronext, and the easiest way to buy them is through an online stock broker. To do this, you need to open an account and follow a broker's procedures, then start trading. You can trade TUI AG NA O.N. stock right from TradingView charts — choose your broker and connect to your account.
Investing in stocks requires a comprehensive research: you should carefully study all the available data, e.g. company's financials, related news, and its technical analysis. So TUI AG NA O.N. technincal analysis shows the buy rating today, and its 1 week rating is buy. Since market conditions are prone to changes, it's worth looking a bit further into the future — according to the 1 month rating TUI AG NA O.N. stock shows the neutral signal. See more of TUI AG NA O.N. technicals for a more comprehensive analysis.
If you're still not sure, try looking for inspiration in our curated watchlists.
If you're still not sure, try looking for inspiration in our curated watchlists.