XLM still on the way down after crazy pumpHi there fellow traders,
We hope all of you are well.
XLM is still on the downfall after that massive pump from 20th nov .
Again another great example of why our badass indicator is such a powerfull tool to work with.
XLMBTC trade ideas


XLMBTC - 1D - going up?NOT A FINANCIAL ADVISOR!
This is an update to the previous XLMUSD idea. (linked below)
Why am I long biased:
1) long term resistance is now support
2) the size of the sell candles are getting smaller approaching that new support
3) Indicators are pointing to that reversal.
What do you think will happen to the XLMUSD if the XLMBTC pair moves higher?

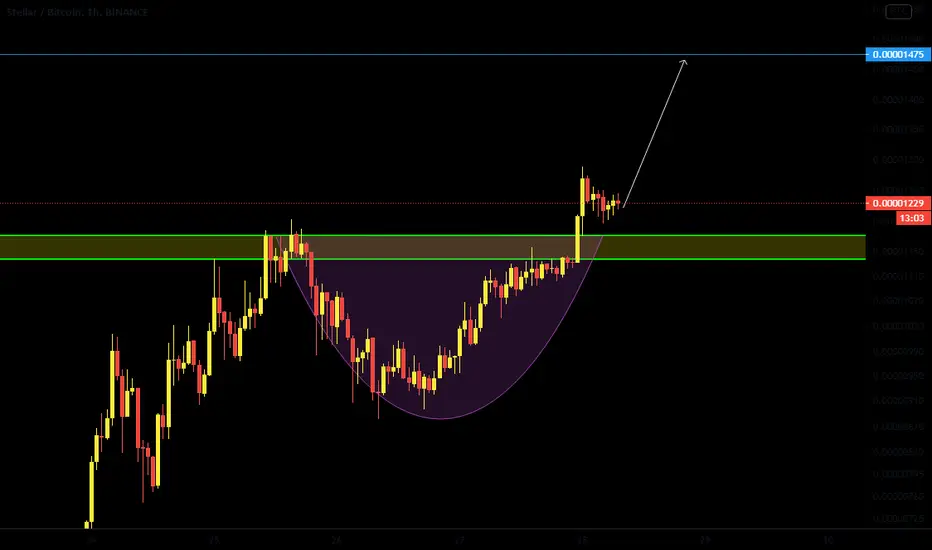
XLM long, breakout is comingXLM is about to finish it's correction and breakout. Reasons to go long:
1) XLM has been on the correction after bull run for a week and now it finds the support on the lower bound of the old channel.
2) RSI bullish divergence on 1H, plus RSI broke the weekly resistance.
3) Volume spiked several times with heavy candles.
XLM is a fundamentally strong coin with huge volumes (#11 on the crypto) and if the market goes up, it will definitely follow.
TP1: 1014
TP2: 1073

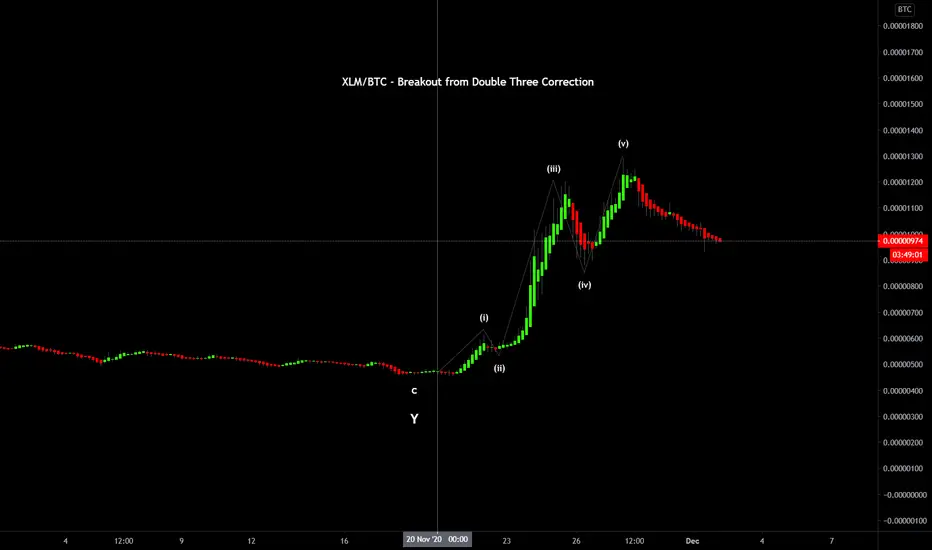
XLM/BTC - Breakout from Double Three Correction
An update on XLM/BTC. It looks like a clear breakout from the Double Three structure with price breaking out from the zigzag into an initial five wave impulse of a smaller degree. Let's see how it plays out for confirmation.
Please refer to the previous idea I have linked below and follow for further updates.
Trade safe,
Beyond Edge
Disclaimer
This is not trading advice. All content/ information shared in this idea is purely educational in nature and is expected to be used for analysis and illustration purposes only.
Do not trade or speculate based solely on the information provided. Trust your own analysis.
Beyond Edge
XLM - LONGXLM covered risk yesterday at potential reversal point, awaited a breakout and re-entered upon retest area and still building positions.
Clearer picture upon daily candle close.

Descending broadening wedge, BTC says sikeXLM forming a descending broadening wedge while BTC shows all the doomers its classic party trick the dump and pump. Looking pretty decent for at least a few percent gains. As we see with XRP right now, alt coins have been given the chance to thrive still.
XLM/BTC entry ideaLooking to buy XLM at .00001029
Lines up nicely with (possible) trendline, as well as .618 Fib retracement on recent move.

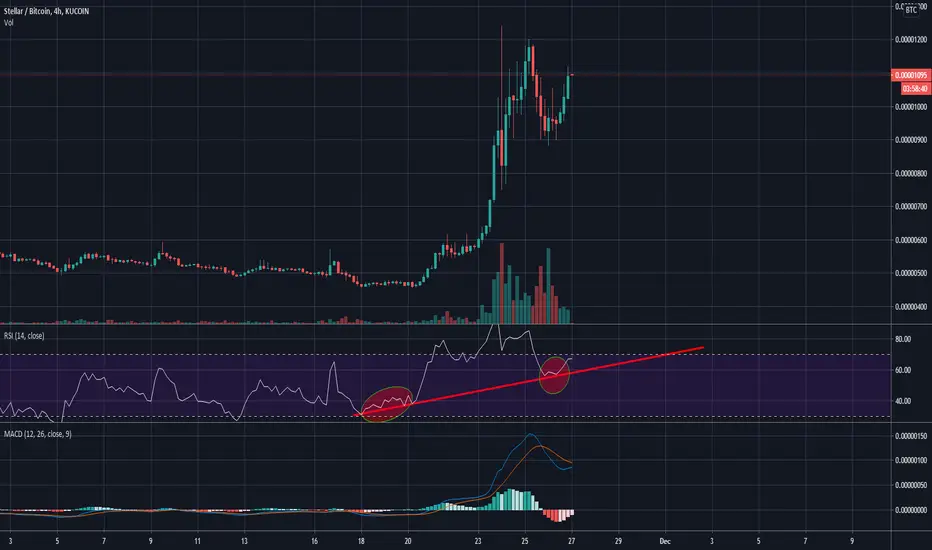
RSI Trendline 4HrTrendline on the 4hr RSI seems to be showing the current trend's move. Extended above the trendline, corrected, now touching the trend line and pulling up again. Overall, weekly volume and the giant move up is still a huge sign of strength. Even after BTC's fast correction, XLM is continuing to show strength.
Gunbot Backtesting Automated Trading on BTC-XLM with +42% profitGunbot Backtesting Automated Trading on BTC-XLM with +42% profit
Gunbot Backtesting Gain-Gain 15 min strategy on BTC-XLM - +42% in Profits!
What's This Chart About ?
This is a Backtesting result for the Gunbot trading bot Gain-Gain Strategy (plus additional custom confirming indicators)
Coin-pair : BTC-XLM
Trading on: Binance
Gunbot Strategy : Gain-Gain
Estimated Profitability (LONG | Buy+Sell): ~ +42%
(Based on the last 21 days of trading history)
Gunbot Strategy Specs:
PERIOD = 15
BUY_LEVEL = 0
GAIN = 6
MFI_ENABLED = true
MFI_BUY_LEVEL = 45
MFI_SELL_LEVEL = 60
MFI_LENGHT = 20
RSI_BUY_ENABLED = true
RSI_BUY_LEVEL = 45
RSI_SELL_ENABLED = true
RSI_SELL_LEVEL = 50
RSI_LENGHT = 20
Optional Gunbot Strategy Settings (NOT included in the above backtesting chart):
- activate the DCA / Dollar-cost-averaging function in your Strategy settings ( this would re-buy 50% of the invested capital, each time the price drops 2% with a watching trigger starting when the price is at bought price minus 0.5% ).
- The CU_CAP_COUNT is the number of times Gunbot will trigger the DCA trading logic.Set accordingly.
DU_CAP = 0.5
DU_CAP_COUNT = 5
DU_BUYDOWN = 0.5
DU_METHOD = 2
Scripts used : Allanster's Gunbot Deluxe Tuners BE
www.tradingview.com
Automated Trading Bot used : Gunbot Ultimate
thecryptobot.com
_______________________________________
Gunbot is a Trading automation software for crypto-currencies . Gunbot works with following markets : Bitmex, Poloniex, Bittrex, Cex.io, Binance, Coinbase Pro (GDAX), Kraken, Bitfinex, Kucoin, Cryptopia, Huobi .
Available Trading Strategies in Gunbot 20
ADX | ATRTS | Bollinger Bands | Bollinger Bands (TA) | EMAspread | Emotionless | Gain | Ichimoku | MACD | MACDH | PingPong | StepGain | SMAcross | Trailing stop – stop limit | Time series analysis + more
_______________________________________
DISCLAIMER: By using this script, you agree to the 'Terms of Use' at TheCryptoBot.com, as presented on our website (TheCryptoBot.com) and below.
This script is strictly for individual use and informational purposes only. Any information provided on this website, or, via our website, or, via our profile, or via emails, is not to be considered legal or investment or financial advice. Investments are made at your own risk. TheCryptoBot.com is not responsible for any losses you may incur.

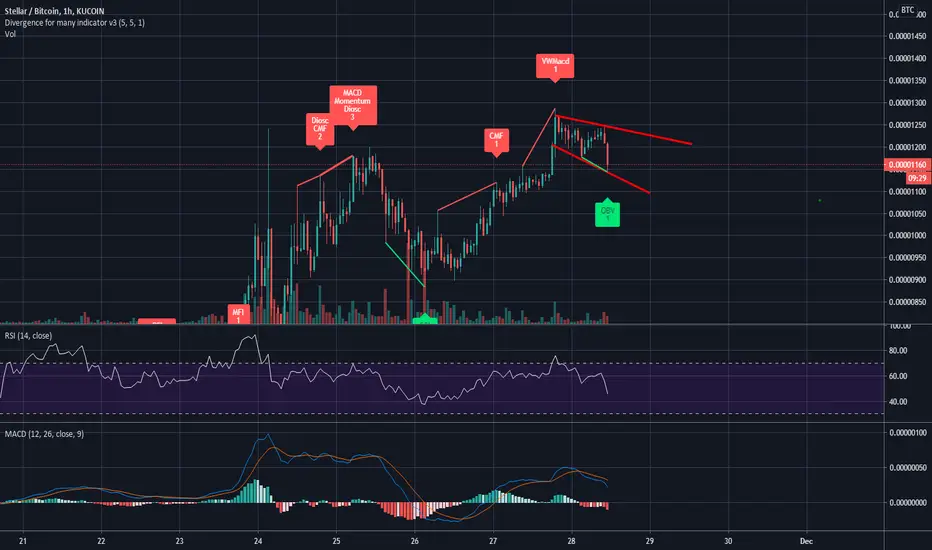
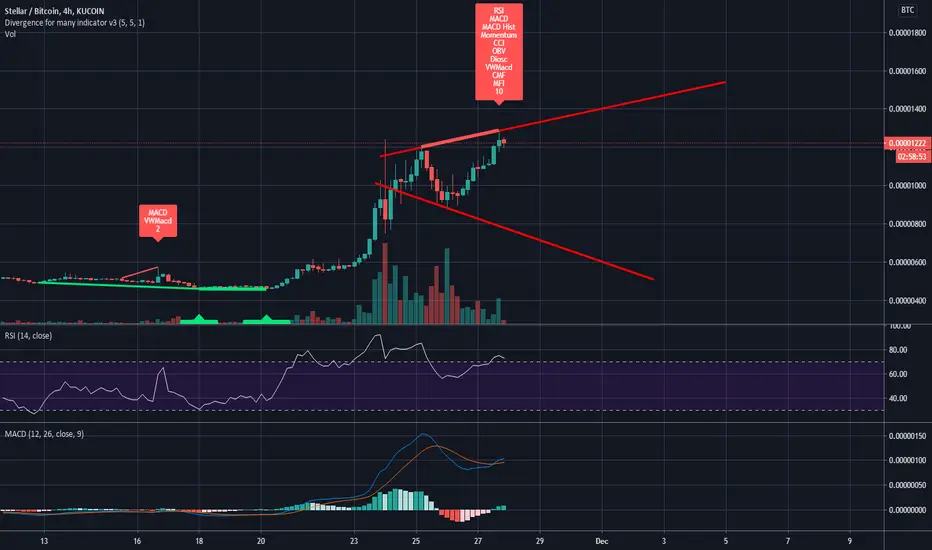
Nice recovery, but be aware of the divergences!!XLM has shown a lot of strength recently; however the previous 4H candle close is showing a stack of 10 bearish divergences, which is quite a lot! Be weary of this and take profits as you see fit. If this is a top for the current time being, we may start to form some form of a formation in the likes of a broadening wedge that could be a good setup for bullish continuation in the coming days.
Here I go long on Stellar Lumens and XLM will go upHere I go long on Stellar Lumens
and Stellar Lumens will go up.
The price is testing the major resistance, so now I go 5x long and the bullish breakout will start. And Stellar Lumens will go up. See you up there
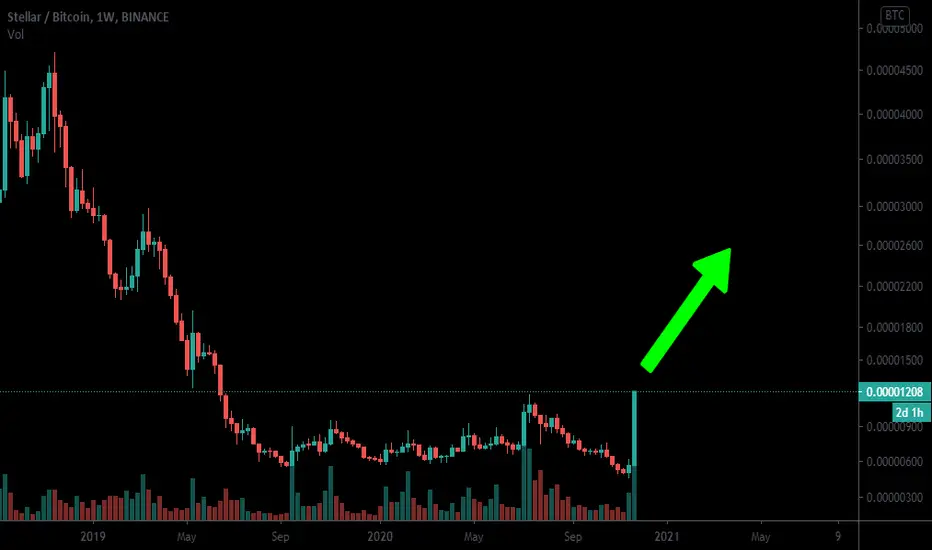

Stellar (XLM) Reveals The Future...XLMBTC (Stellar) is now revealing the future... This is what is coming to the altcoins market.
Long-term chart:
We have a very strong and decisive break of EMA50 on the weekly timeframe... What follows is months or even years of bullish growth (higher highs and higher lows).
What you see happening here, will also be repeated by other altcoins... This is only the beginning.
Let's have a look at the MACD:
It is not yet above zero so we have plenty of room left for it to continue to increase.
There is also a bullish signal in the form of a bullish cross.
The RSI is at 67 weekly, which is really strong.
XLMBTC will continue to grow, together with the entire altcoins market as a whole.
Don't get distracted by the noise.
There will always be corrections and retraces in prices, this is normal, but after a correction, another wave starts.
Namaste.

XLM/BTC Again?Hey there this are is last support are for xlm you guy can see what is the movement before when price coming this area we can bought a little bit here.
Because here is a big support, response purchases arrived already.
I try to keep simple my analysis. For everyone understant clearly

$XLM, 50% in 48hs... 🚀🚀$XLM
50% in 48hs... 🚀🚀
Careful fomoing into this mega pumps..
This altseason can last days or weeks where dips to jump into a safer position will be available.
#XLM

The acquisition or gradual gathering of something Hello everyone !
I wish you all nice day my dear followers, friends, newcomers and randoom net troll visitors.
Lets focus closer on The accumulation of wealth today at this chart
Accumulation function, a mathematical function defined in terms of the ratio future value to present value
it is literally the process of gradually increasing in amount, or the increased amount
--------------------------
Accumulation
--------------------------
When price declined deep enough, at some point, you (as Smart Money) make the decision to buy.
You may have various reasons for that: you may see that stocks are heavily under-priced or you analysis shows that the market is ready
for a new uptrend and if you do not start it then someone else may do it.
It does not matter what your motivations are, you want to buy as much as possible at lowest possible price.
When you are Smart Money, you cannot jump into the market and buy all you need at once.
In order to accumulate the shares at lowest possible price your buying activity should be spread in time.
You have to plan your buying. You would have to follow a specific strategy:
1) When price drops below your critical level you start buying.
2) You continue to increase buying until you see you absorb all available supply and reversed a price trend.
By its nature panic selling is stronger than greedy buying. That is why you need to put more buying pressure to stop a down-trend.
That is why a volume surge at the end of a down-trend is much stronger than a volume surge at the end of an up-trend.
That is why Accumulation goes faster when compared to distribution.
3) When price trend is reversed and reaches your critical level below which you are buying, if you did not bought all you wanted, you stop buying - you remove demand.
If price does not start to slide down you may sell some of what you bought to generate bearish sentiment and make an illusion of bounce and not a reversal.
Since you were the main buyer, you will not need to put a lot of selling pressure to resume a down-trend.
4) As price starts to decline again, you start buying again until you absorb all supply and accumulate (buy) all you wanted to buy.
That is why we see double bottoms, reversed head and shoulders and etc.
5) You may repeat 1-4 steps again when you see that you may easily create a bearish sentiment (you do not have to sell a lot to resume down-trend).
You do it until you accumulate all you want.
6) When you dry out all Supply, there is no need in a strong Demand to push price higher.
Small increase in Demand can make a case. At first, stop-losses of bearish traders are triggered.
Then, as price advances, the rest of the market starts to jump in.
From that moment, you may sit and watch as other traders' bullish pressure pushes the price up.
The market not always follows a specific scenario and Accumulation phase does not always follows the same pattern.
Still, by analyzing volume and price action you may reveal the activity of the Smart Money.
----------------------------------------------------------------------------------------------------------------------------------------------------------------------------------------------------------------
--------------------------
Distribution
--------------------------
At some point, you as a Smart Money have to dump your investments.
It does not matter what your motives are - you made decision to relocate your investments into different place, you made extensive analysis
and you know there are a lot of external factors which would support a down-trend, you see market bubble which may burst any time, you see that the market is
heavily overpriced or you simply see that the market cannot push itself higher (demand is drying out). It doe not matter why you want it. You are "Smart Money" and you want to sell.
You have to distribute your holdings. However, you know that when you start dumping all your investments at once, the quantity of supply you will through into the market will crash the price.
You do not want it - you want to distribute your investments at the highest possible price.
You have to plan your actions to dump your investments in a smart way at the highest possible price without crashing the price down:
1) When price moves up to some specific level defined by you as satisfactory level, you may start selling.
You start selling in big quantities until you see that you are absorbing all Demand (buying pressure) and price up-trend starts to halt.
2) If there were a lot of unsatisfied demand (a lot of Bullish traders) you will be able to sell more - we will see increase in volume to the price up-move and then price advance will halt.
When there are not a lot of Bullish traders, you will stop price advance without causing an increase in volume.
3) When you see that price up-move halted you halt your selling - we will see a drop in volume.
4) If price starts to move down and you still have a lot of shares to dump, you stop selling as you do not want price do decline deep down - you want to sell at the top.
5) If price continues to decline without you that mean you created bearish sentiment. In this case, you do not mind to buy a little bit to change the sentiment and to push price up again.
6) When price starts to move up you start to sell again by dumping the rest of your investments.
7) You repeat the 1-6 steps above until you sell all your holdings you wanted to dump.
You managing bullish and bearish pressure you manipulate price to move in a side-way narrow range corridor.
8) When you about to distribute all your holdings, you do not halt your selling when price declines below your satisfactory level.
You continue to push price lower - you need to create bearish sentiment on the market, so, the market will continue decline down without your involvement.
9) Each time when you sell and push price down, you may run into new waves of Bullish traders who has their own reasons to start buying.
These bullish traders could be strong and they may reverse a price trend up strongly.
However, since you are the Smart Money and you have unlimited access to money - you are stronger and you are dedicated to push price down.
As these new Bulls push price up close to your critical threshold, you start selling (if you are out of your holdings you sell short).
You do it each time it occurs until you break the spirit of these waves of new Bullish traders.
That is why we may see an increase in volatility at the end of side-way trading right before a bearish trend.
That is why we see price bouncing from the resistance levels. By Richard Wyckoff words, you have to shake spring board until you shake off all the Bullish traders.
When you shake off all the Bulls, these Bulls will turn into the Bears - their stop-losses will start triggering and they will start selling.
10) From that moment, you may just sit and watch the decline - you Distributed all your investments at the Top and you started a bearish trend.
But remember !
This is how you would have to act if you would be the "Smart Money" dedicated to distribute all your investments and reverse a price trend down.
Of course, the Distribution phase, does not follow the exact scenario described above all the time.
In some cases we have prolonged in time side-way trading and in some cases we have Climax Run up and strong reversal down.
However, in all cases we can track the actions of Smart volume by analyzing volume activity together with price movements.
----------------------------------------------------------------------------------------------------------------------------------------------------------------------------------------------------------------
If you want to know what Smart Money are doing, you have to think as Smart Money.
You may see when Smart Money start their buying (Accumulation) - it starts while price still declines.
Also, you may see when they start their selling (Distribution) - aging, it starts while price still moves up.
By analyzing volume and price action you could obtain the knowledge about trend-reversal before it actually occurs.
This is unnatural to think that the first signs of weakness occur on price up move and the first signs of strength occur on price decline. However, this is one of the main concepts of Volume Spread Analysis. When you are can see the beginning of an Accumulation or the beginning of a Distribution, you can spot when "Smart Money" start their trading activity. From that point, if you define the sentiment of "Smart Money", you will know where to place your bet.
Accumulation/Distribution scheme chart applied on BINANCE:XLMBTC
link on chart HERE
The acquisition or gradual gathering of something part 2. here
Please leave a like if you want to support my work and do not hesitate to let me know down in the comments how do you like the graphics and the style of TA at all.
Do you want more of these ? Let me know and support me Every feedback and like is highly appriciated.
ChaChain
-------------
Disclaimer:
I´m not registered or licensed in any jurisdiction whatsoever to provide investing advice or anything of an advisory or consultancy nature, and therefore I´m unqualified to give investment recommendations. Always do your own research and consult with a licensed investment professional before investing. This communication is never to be used as the basis of making investment decisions, and it is for entertainment purposes only.

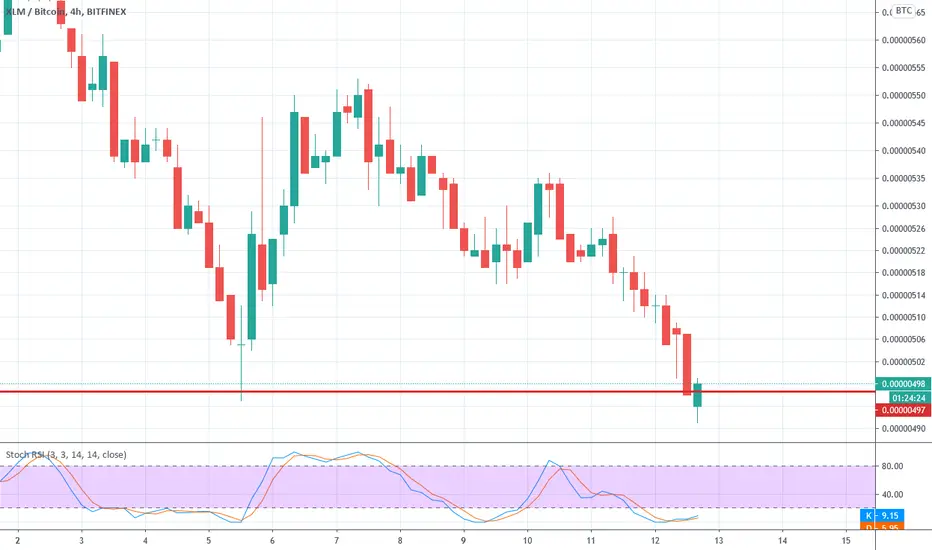
We dont buy at resistance levelsHello, traders.
XLM is testing an important resistance level after a strong uptrend movement, the RSI is pointing for an overbought level, so we must wait for a correction or some bullish accumulation pattern and enter the next breakout.
Best Regards
