XLM LONGShowing Strenght! Bouced off 800 Sats that's the re test!
We can go lot higher! Same with ADA!
XLMBTC trade ideas


XLM/BTC 309% Potential so I bought and wait for Huge Returns #XLM/BTC Update:
#XLM bounce back from 750-800 Support now 13% up I hope you grab some #XLM at dip.
I am accumulating More #XLM
Target : 1348 Sat.
Guys I will buy more #XLM?BTC when dip.
every dip I will buy more and More.
50% holding For Long term and 50% scalping for small small profit on every Big spike and again buy at dip.
I hope you understand my strategy.
Safe trade earn huge
S: 750/650/586
R: 1348/2150/2944 Sat
Please like and follow me for latest crypto updates.
Thank you

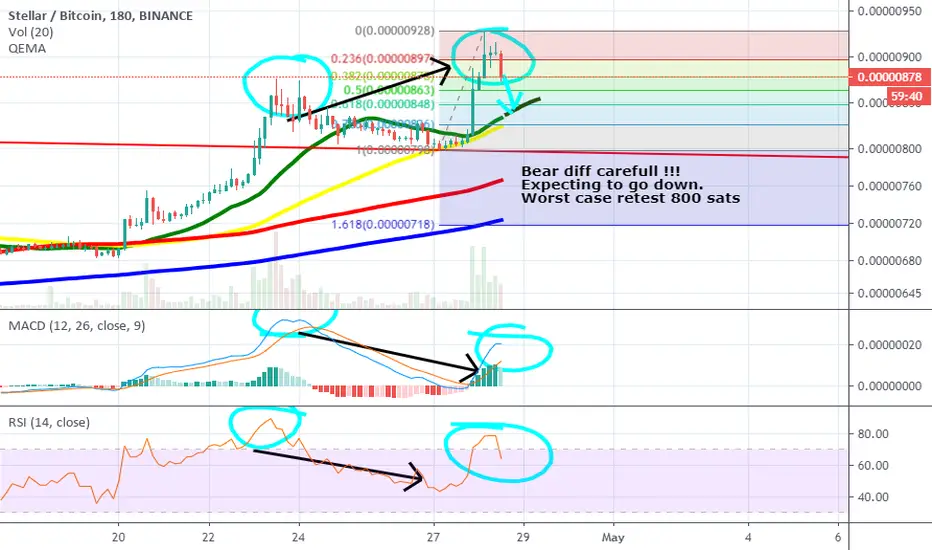
Bear Diff on XLM / BTCBe carefull trading guyz,
Possibilty is that the price will go down and worse case it retesting 800 sats
Bear diff on 3 hour timeframe => the timeframe where the 20 MA bounced of the 50 MA
Diff on macd and rsi !
Not financial advise do your own research !!

XLM6 days to go for weekly close it can end up just like scam wick. Don't FOMO let it flip (s/r) on daily/weekly. Keep n eye on BTC

XLM/BTC - 1 year accumulation after a 200-day drop.
Almost one year goes by XLM accumulation
EMA 50 and 200 show the intention to continue the trend.
It is mandatory to test the intersection zone before growth.
The asset has fallen by almost 90%.
Do we wait for full recovery and new heights?
Well, there will be at least a half recovery of the fall, after leaving the accumulation of their 100% can be taken away.
There's a bullish takeover on the monthly timeframe.
Let's take a closer look at the schedule:
XLM/USDT
Push like if you think this is a useful idea!
Before to trade my ideas make your own analysis.
Write your comments and questions)
Thanks for your support!

XLM/BTC now 15% up within few hours still Bullish#XLM/BTC Profit Chart:
Current price of XLMBTC is 907 satoshi.
and 50% profit from our January Chart.
#XLM finally booked 15% profit within few hours.
I told you yesterday at 800 Satoshi and I also bought at that price.
short term Trader you can take profit partially I also booked profit my 70% holding and Long term Trader you can hold it for huge profit and I also holding rest 30% for long term.
Support: 800/675 Sat
Resistance: 950/1412 sat
Please like and follow me for latest crypto updates.
thank you

XLM/BTC 318% Potential Chart and Strongly Bullish as per Chart#XLM/BTC Chart Update:
Current Price is 807 Satoshi.
#XLM Accumulation phase very Strong.
Very long time Whale accumulating Very huge Value.
so Buy #XLM between This Green Box.
try to catch low as posible.
I am also accumulating at every Dip.
and Hold for good Profit.
Entry Level :- 700-800 sat is good entry Level.
Support: 675/565 Sat
Resistance/TP: 1412/2179/2901 Sat
* Resistance = Targets
Please like and follow me for latest crypto updates guys.
and also appreciate for my work.
Thank you


$XLMBTC Buy Zone ComingBuy at Daily 7EMA
If it Dip Add more Around 61.8% fibo
Target 1st 1250
Target 2nd 2000

Neutral position XLMShowing some bullish signs such as being above the 50MA and the 200MA leveling out.
However past has shown .236 to be a significant resistance for price.
Hence my neutral stance on XLM currently if I see something else (bullish or bearish) I will update my stance.

Stellar Rally: Once Stagnant Altcoin Outperforms Bitcoin By 30% The altcoin known as Stellar, or XLM, has stood strongly alongside XRP as two of the worst-performing cryptocurrency assets of the last few years. But the asset’s woes could soon be turning around after a significant rally aginst Bitcoin took place right under investors noses. Is this another sucker’s rally, or is Stellar about to finally stage a strong, full-scale recovery and kick off an altcoin season? After over two years of a bear market, a year straight in consolidation at lows, and a fall of over 90% from its all-time high, Stellar may finally be ready for a major recovery. The altcoin recently had a powerful rally on the XLMBTC trading pair, sparking a rally of over 30% against the first-ever cryptocurrency – outperforming it by a large margin. The rally has taken XLMBTC from lows to a retest of the downtrend line from all-time high. After spending over a year consolidation at these low prices, Stellar could be ready to come out from accumulation, and mark up could be next. A break of the downtrend line would cause an explosive boost in buying power from XLM bulls, who have less diagonal resistance to deal with stemming back from the asset’s all-time high. Lack of Interest in XLM, Could Signal Altcoin Bottom Is In, and a Rally Is Next Scan the pages of Reddit and crypto Twitter, and you’ll be hard-pressed to find anyone talking about this recent Stellar rally.
After the asset holders have spent two years in the gutter, few are even paying attention to the altcoin that was once ranked in the top ten crypto assets by market cap, alongside heavy hitters like Bitcoin, Ethereum, XRP, and Litecoin. The shiny new altcoins Tezos and Chainlink pushed Stellar out of the top spot long ago, but this recent rally could prove to give the asset a chance to reclaim the top ten, or at least come close to it. Markets are cyclical, and its when investors lose faith, give up, and capitulate, that the asset often finally turns around. Evidence or a complete lack of chatter about the recent rally could add credence to the theory that the asset has bottomed, according to the read on sentiment, and XLM could pump right out from under their noses. With how explosive altcoins move when they do finally break out, Stellar could go on another spectacular rally like the one that took XLM to its all-time high price in late December 2017.

Resistance Zone on XLM.Hello Traders,
If you are out of XLM now it time to be pacience and wait for a better entry point, now we are at resistance zone, and we cannot buy around Resistances, XLM still bullish and we must wait for acumulation above this resistance or pullback to enter in this asset, if we start a correction wave e must project fibonacci retrament levels and see the bulls reaction to those levels.
Please like this post and comment.
You are welcome to follow us on our social networks.

XLM / BTC Work in the accumulation channel. Step 58%.I have been trading a coin for more than 2 years. Almost all the main movements I traded. I previously showed all these movements in my trading ideas during this time. Former tag ideas are attached below the description.
This is one of those cryptocurrencies that can be accumulated until a certain time, as there are not just big money behind it, but a potential new system of finance. Coin is a prototype.
Entrance.
At the moment, the instrument is in the accumulation channel for 9 months. This is very symbolic.
Channel pitch 58%. Price at the bottom of the channel. Good entry point.
Stop Loss.
Stop-loss or exit zone under the support of the channel if the price fixes below it.
The potential risks and profits are understandable. The profit potential is many times higher than the risk in the exit zone.
Target.
The potential of the first movement is the width of the channel. This is + 50%.
Next you need to watch how the price will respond to channel resistance. Perhaps the main trend will reverse if the price manages to consolidate above the channel.
All my trading ideas on this Bitcoin coin since 2018 are XLM / BTC.
XLM / BTC Dec 24, 2018
XLM to BTC is not the bottom. From this level there can be a movement of + 35-90%
May 30, 2019
XLM Falling wedge. Cyclicity. + 32%, + 42%, + 52%, + 62%
Jul 18, 2019
XLM / BTC. Channel 50%. Double bottom. Trend line. Pivot points
Jan 16 2020
Also, the price in lateral movement has now come very close to breaking the downtrend line of the main trend. This is clearly seen in this trading idea.
Tradings ideas of this coin to the dollar. XLM / USD
XLM / USD downward trading. Pivot points.
Nov 7, 2019
XLM (Stellar) /USD Downstream channel. Work on a coin.
Jan 5 2020
Updating an old idea for more accurate trading.
I wish you good money in trading in the market. In the pursuit of money, do not lose your life.

$XLM, Almost 30% up in the last 4 days..$XLM
Almost 30% up in the last 4 days (XRP didn't follow this movement 🤫)
Zooming into smaller timeframes, looking for a retest/ R/S flip of ~800 sats level as potential entry for continuation
UCTS buy signals across all LTF & 1-3D timeframes
#XLM

XLM, Potential 150% upside gain. Are you ready? XLM used to be one of my favorite altcoins. After it dropped below the key support level, I sold all of it. Until today, I see a huge bullish senerior could possibly build up in the future, I will give the following reasons:
1. Heavy accumulation since 2019. If you look at my volume indicator, you will see people are accumulating during 2019 up until today. Additional, we see volume increasing ( we are look at weekly)
2. XLM formed solid bottom support, which means downside risk is low, and we can simply put a tight stop loss below it, and upside potential is humongous.
3. My indicators both give me signal that we might have a bull run coming up, but we need to create HH and HL first.
I will suggest buying XLM during the retracement and put stop loss below the key support. Take some profit when it hits 930 and 1288 area.
Happy trading.

XLM/BTC (Strong Breakout?)XLM/BTC
-strong breakout of local resistance
-testing recent high resistance
-if failed to closed above resistance
-a good retest of minor support is possible
-for another leg up to 1000 sats

Are we gonna breakoutcurrently in an uptrend with resistance at 800 sats, can we breakout or will we retain and drop back down.
target 800 sats
macd diverging bullish again
rsi in uptrend aswell
not financial advise just wanted to let you guyz know this.

Everything is ready for a beautiful short positionHi.
After a breakout from previous high, we have reached to new resistance 850 sat and rsi is at its previous resistance so if this is not probably a short position so there won't be any.
Entrance region: 840- 860 sat
S.L: 875 sat.
Target: 750 sat.

XLM should take break before continuing higherVery simple setup for XLM here.
Daily chart looks quite bullish, but for now I would expect XLM to take a breath and cool off a bit before continuing higher.
Will be looking for C-fork to form here, supported by bearish divergences on 1H & 2H.

xlmbtcThis played out well. my ratio might have been a little off looking back at it. But as long as I learn.
