XLM BTC MBA Daily trade homework.Looking to short from the top of the channel to the bottom of previous support.
XLMBTC trade ideas


A stellar proposition (correction almost over?)Can't find any clear direction currently because of bitcoin, but XLM has already come down a long way. I would lean more towards an impulsive move happening soon, but will gladly buy this off the floor if it tanks.

XLMBTC is looking To Touch High Ranges|Early ChartBINANCE:XLMBTC looks nice at the moment. This is an early friendly reminder .
Things are clearly mentioned in the chart losing 666 sats could take us back to test support levels in other case we are going to test range high levels which is most likely the case. I am targeting 840 and 880 sat levels.
For Now Set alerts and wait for a close above the rejection area (blue line)
Best way to reduce the risk is looking at weekly levels and how BTC behaves.
always use stop loss.
Good luck

XLMBTC formed bearish BAT | A good short opportunityFormation of bullish BAT:
This time on daily chart the price action of Stellar (XLM) has formed bearish harmonic BAT pattern and entered in potential reversal zone. There pricelie also has found 200 simple moving average resistance that will also push down the price line.
Where we should place sell orders?:
As per Fibonacci sequence of bearish BAT the sell order can be placed between: 0.00000701 to 0.00000716 sats
Stop Loss:
The potential reversal zone area which is up to 0.00000716 sats can be used as stop loss in case of complete candle sticks closes below this level.
Note: This idea is education purpose only and not intended to be investment advice, please seek a duly licensed professional and do you own research before any investment.

XLM Short Term Bearish Longterm BullXLM Short Term Bearish Longterm Bull. Expecting it to stay in the trend for now but breakout soon enough

StellarStock Symbol: XLMBTC
Stellar is looking very similar to ripple and its setup. It's a good price to slowly accumulate till crossover breakout.
Diversify and use 5% stoploss
----------------------------------------------------
We just realesed our new course! Follow our tradingview page and visit the link in our bio if you are looking for new strategy to add to your arsenal.
Use Promo Code: FIRST100 to receive $50 off of your course!
First come, first serve / Code valid for first 100 buyers. Normal price $99
---------------------------------------------------
Thank you for your continued support, God bless you though these times.
- Major League Trader

XLM/BTC (Strong breakout: up to 20% profit)XLM/BTC
XLM broke key trendline resistance at 650 sats including the 200MA on the 4H chart.
Multiple bullish candles during the last 24 hours of trading, this is strong momentum from the bulls.
If a retest of 200MA is given, it is a good chance for a Long position.
The stop-loss is ideal to place under the 200MA to protect from huge damage.

Breakout soon to come for XLM/BTCHold your horses and get ready for a breakout for XLM/BTC.
This is an ascending triangle which mostly break out bullish ( it can break bearish no hate if it does ).
We are making "valley's" on the resistance line and which are getting smaller and smaller. We're getting close to the Apex.
XLM's breakout could possibly end the downtrend we're still facing ( vs BTC and vs USD/EUR ).
Not financial advise, do your own research ;)


XLM - Time to buy more....Buy in 600-580 TP1 683, TP2 830, TP3 1000,
S/L 550
Hi guys, This is my first published idea after a few years of learning.
IDEA , not advice ... 😷
All comments welcome....


XLM/BTC 2H (Binance) On parallel channel & falling wedge supportStellar Lumens just gave us a really nice short result, now we are getting ready to long again:
Buy Entry= 0.00000636 - 0.00000626
Take Profit= 0.00000659 | 0.00000673 | 0.00000696
Stop Loss= 0.00000603
Risk/Reward= 1:1 | 1:1.5 | 1:2.32
Expected Profit= 4.44% | 6.66% | 10.30%
Possible Loss= -4.44%%
Fib. Retracement= 0.236 | 0.382 | 0.618
Margin Leverage= 1x | 3x | 5x

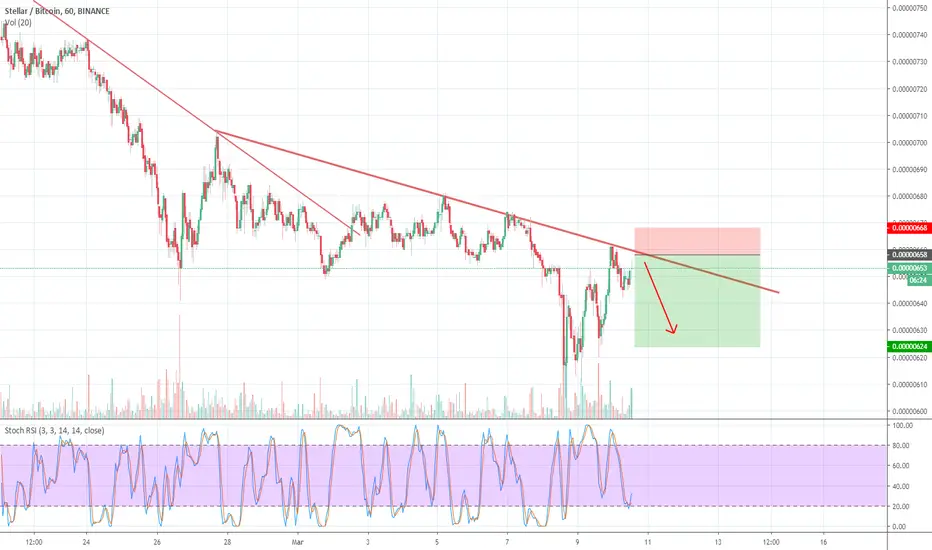
XLM/BTC 4H (Binance) Pumped on double bottom, time to retraceStellar Lumens surprised us by gaining +23% from double bottom.
Now it's back above MA200 but I'm expecting that more downtrend is coming!
Sell Entry= 0.00000708 - 0.00000720
Take Profit= 0.00000682 | 0.00000663 | 0.00000631
Stop Loss= 0.00000746
Risk/Reward= 1:1 | 1:1.59 | 1:2.59
Expected Profit= 4.48% | 7.14% | 11.62%
Possible Loss= -4.48%
Fib. Retracement= 0.236 | 0.382 | 0.618
Margin Leverage= 1x | 3x | 5x

XLMBTC Longer term swing trade If price comes down to this level
i will be keeping an eye on volume and
wont be entering until there is
confirmation of buyers (Bullish engulfing,
Bull hammer, morning star pattern).
Placing a limit order in this zone
seems to risky until we get the
above confirmations. But could be a
good swing trade if it plays out.

XLMBTC 5d best level to BUY 50% gains (NEW)before we kick start the update. your upvotes/subs are appreciated.
Why get subbed to to me on Tradingview?
-15+ years real live trading experience
-TOP Author on TradingView
-professional chart break downs
-key levels
-no junk on my charts
-frequent updates
-covering FX/crypto/US stocks
-24/7 uptime so constant updates
So without further due. Keep it short/simple and to the point.
XLMBTC 5d best level to BUY 50% gains (NEW)
IMPORTANT: this is a speculative setup.
results are not guaranteed.
please use a tight stop loss.
This is a great buy and hold setup for 50% gains in XLMBTC.
Keep in mind. this is not a miracle/overnight casino gains
setups. will take time to hit TP, so only for patient
traders.
best reload zone bulls is near 600.
TP1 is 900. TP2 is 1050.
good luck traders.

Accumulation Whales XLM/BTCIn this pattern we're in rn we see a lot of green volume bars. Meaning accumulation by whales.
Currently on our way towards the resistance cause we just bounce of the support.
MACD currently looking good
All MA's are currently coming together meaning lot's of tension building up for a big breakout ...
will the breakout happen if we touch the resistance or will we wait a while longer?
IMO lots of green bars = more leaning towards a bullish breakout and this being the reversal pattern.
Current target arround 830 sats.
Not financial advise, do your own research!

$XLM, Reclaimed ~700 sats support level..$XLM
Reclaimed ~700 sats support level & now showing some accumulation at this level..
UCTS turning bullish on LTF w/ buy signals on the 12H and below
If continuation happens from here, immediate target should be around ~750 sats (7%)
#XLM

Stellar Lumens Trade Signal @alanmasters [XLMBTC](101%)Stellar (XLMBTC) is printing a long-wick on today's candle with increasing volume with prices moving back above EMA10 after a strong drop... Signaling that the sellers are exhausted and the bulls are buying everything up.
Here are the trade details.
---------------
Trade: Stellar | XLMBTC
BUY: 0.00000610 - 0.00000675
NEXT SUPPORT: 0.00000580
TARGET:
1) 0.00000750
2) 0.00000860
3) 0.00000950
4) 0.00001150
5) 0.00001230
6) 0.00001330
PROFITS POTENTIAL: 101%
(Price at writing 0.00000663)
STOP: Close weekly below 0.00000550.
---------------
This is not financial advice.
Feel free to hit LIKE for more trades and FREE high-quality content.
Thanks a lot for reading.
Namaste.


XLM could be rejected againXLM will soon touch a strong resistance. If it gets rejected one more time, it has the potential to go down again.