XLMBTC trade ideas

XLMBTC C&H+VOL INDICATES BULLISHParabolic movement pending for short-mid on XLMBTC as altseason is in full swing while the majority of the top 100 market cap alts are currently playing catch-up & consolidation to parallel recent BTCUSD price surge is in full effect.
TP1-4 with pivot & short/stop figures according to Fibo/KC/BB/EMA20/VOL/C&H
Trade safely and always use your head; not your gut!
Disclaimer
Not financial advise.
-@a1mTarabichi


$XLM #XLM #BUTTERFLY #PATTERNXLM Shows Butterfly pattern right now i will keep following up
Please follow me from all scoial media / Please push like button and follow me.
Sosyal medyadan da takip edebilirsiniz. / Lutfen begen butonuna basiniz ve takip ediniz.

xlm btc nothing but fake breakdown... buy u ll regret it they just trying to kick u out on ur alts now

xlmdont get scared it is coming u sell now u selling the bottom of ur alts btc will go back up same spot max 1 2 days they r just fuckin with u while alts vs btc will go 3x n u miss all the shit

Stellar - XLMBTC - Conditions are in for a stellar runCheck chart comments.
RSI Delta System
RSI Delta
RSI Delta Map

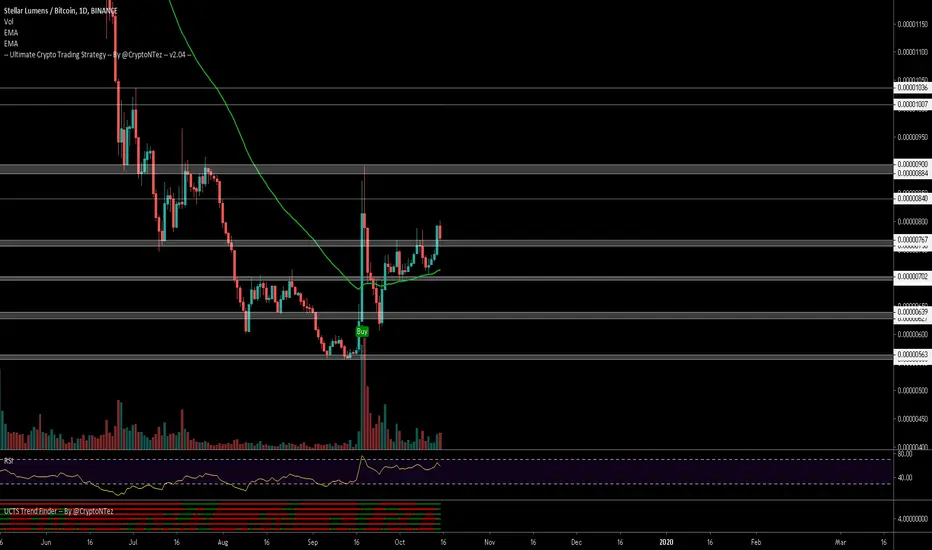
XLM/BTC Pair (35% Profit)XLM/BTC Pair
This coin is a perfect example of old resistance turned into new support.
Perfect bounce and nice bullish ascending triangle here.
I'm in this trade and profit already, my targets are in the 900 sats to 1000 sats (35% Profit).
Let's try this Free VIP signal on Bitmex and Binance!
Grab A friend and Earn up to $50 use this link below.
krypto-signals.com
You want to Hold and Earn Crypto?
Join this Lending Platform today!
Enjoy 3% referral commission each friend you invite
krypto-signals.com
Join Free Telegram Channel
Daily TA update and Alt Coin Signals
t.me

xlmthats ur m shape where u draw where the price going to just like btc on december 15th m shape it shows me 7k satoshi january 4th but i think that where ppl will sell and he knows he will just double there this time xlm has been suffering for years now since 2014 going thru 500 satoshi next time we bottom he doesnt wanna go 500 areas anymore i think we will bottom on next one around 1500 satoshi

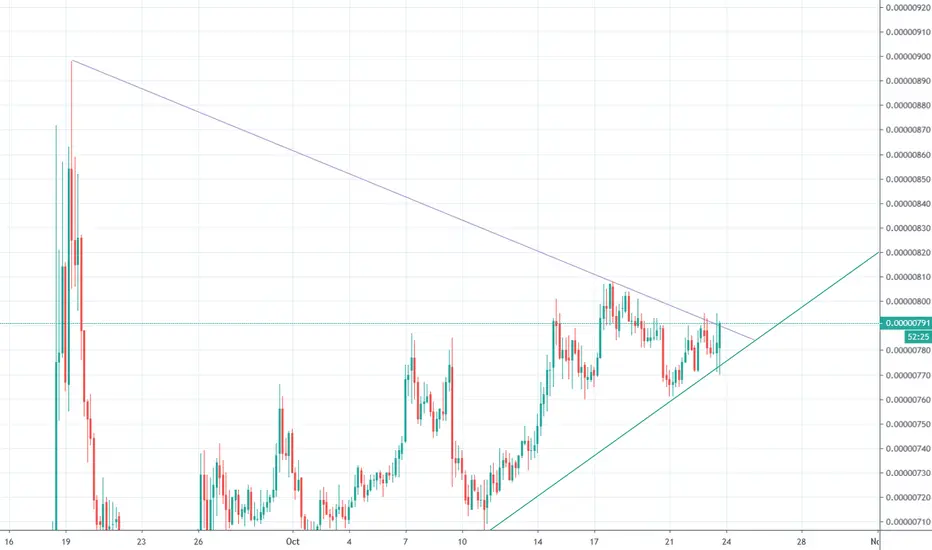
$XLM, Retesting ~770sats after crossing over this level... $XLM
Retesting ~770sats after crossing over this level... (similar to #XRP activity)
If it manages to hodl it, and then pushes up again (flipping this level into support)
We should take a long position (with SL under support) with target at ~840 / ~890 sats..
#XLM


XLMBTC Intraday Profit MakingCompleted Butterfly Pattern
Sell : 755-752
Targets : 746 | 743 | 740
StopLoss : 758

XLM recovery as BTC dominance falls againMy first idea posted on TradingView, mostly to try the feature that allows playing the idea into the future (present). Very simple expectation here without much data to corroborate apart from incoming BTC dominance breakdown of 69%, strong diagonal support for XLM/BTC and breakout from weak local resistance seen between October 9th and October 11th.

XLMBTC BUY NOW UP coming soonXLMBTC BUY NOW UP coming soon
What is your opinion? Please leave your comments.

#XLMBTCSupport and resistance have been identified
Time range specified
Look at the patterns
Look at the trend lines
Look at the channel
Sky blue areas are important and strong
The green areas are Target

XLMBTC BullishI want to show you interesting bottom trend line. Chart of XLM respected this trend line 3 times and now it is ready for move up to our target. Targets, Stop loss in chart :)

XLMBTC LONGLarge moves coming for alts. Dont sell the initial pumps. Wait for the home runs.
God Speed,
Mr. Manbearpig

Good time to buy XLMXLM has broken up from its downward wedge and looks to aggressively regain ground as Bitcoin's price comes under pressure.
XLM has partnerships with IBM, Deloitte and other national banks in emerging countries.
XLM is a much quicker payment system, much cheaper and much more decentralised than Bitcoin. Furthermore it is open source and therefore is likely to get more and more efficient over time as a result.

XLM - Sell When Every Green Line Is HitDetails On the Chart.
We have seen it many times that a coin goes boom and goes to the initial down phase.
And then it starts an uptrend which slowly crosses the highs that were created earlier.
This is happening with XLM.

Stellar Lumen XLMBTC NICE ProfitWithin the coins we had put XLMBTC was to be sent to you from our premium group.
But it will make you sad to know that we have already achieved between 8% of profits and that we will not be able to send the corresponding analysis.
Sorry dear Stellar Lumen fans, it will be a next opportunity.

xlmnext resistance 1536 after that 2586 which shows october 14th and it should get rejected if it goes there 2586 which i was expecting xlm to be 50 cents october 14th and btc 19800 if btc goes 19800 n xlm vs btc 2586 then xlm comes 50 cents we will c if pump comes tmrrw it is really happening,
