XLMBTC trade ideas


NO WAY Stellar will go any lower Finally I see multiple confirmation of the alt season, and Stellar is looking very interesting at the current price. Very very very attractive price indeed to earn some Bitcoins
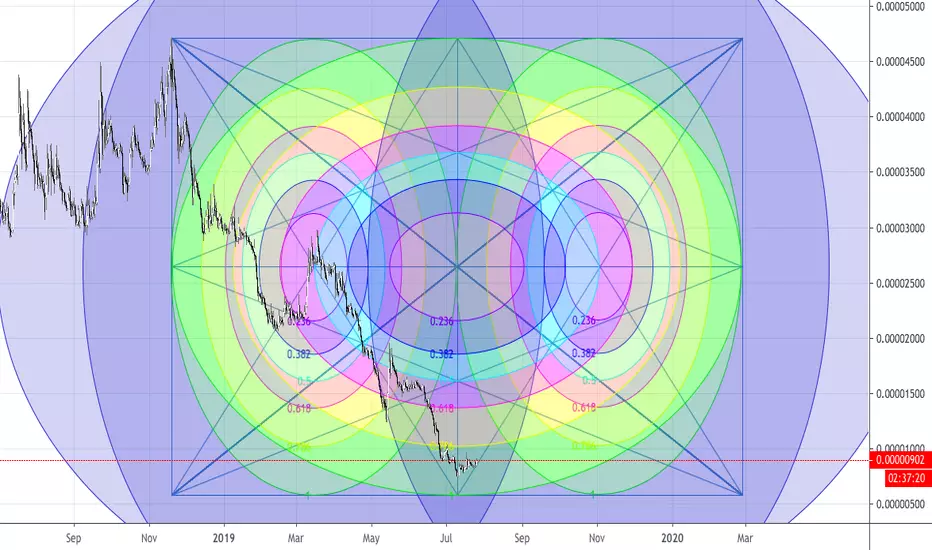
On the chart, black lines are strong Fibonacci cycles and good times to watch for some tops or bottoms in the long run
In red, there are multiple Fibonacci resistance levels. Only break above the last one would confirm the long term uptrend.


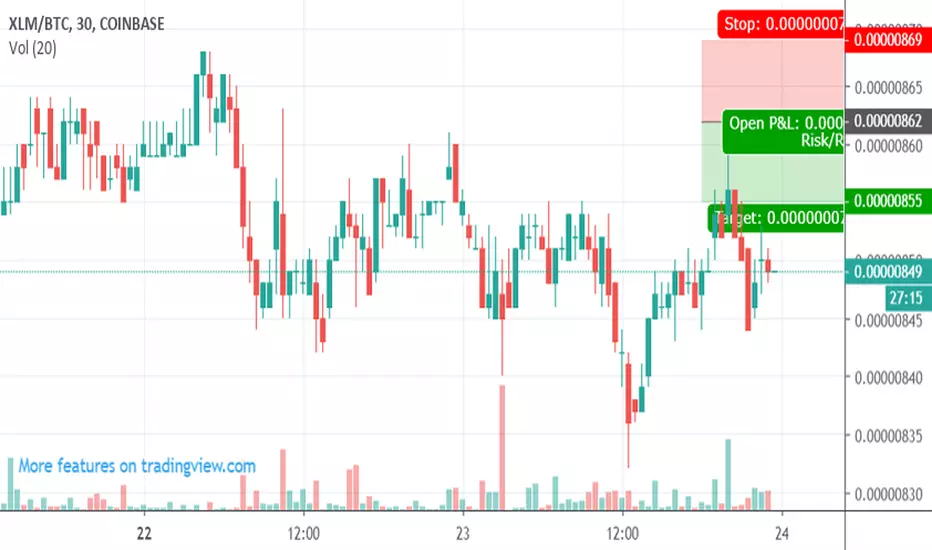
XLM/BTCWaiting and Watching, small break out on the four hr, would like to see 900 sats! MACD Cross over as well!


Ascending Triangle on XLM/BTCPossible ascending triangle on XLM/BTC. If the pattern is valid the measured move would take us to 0.00001076.
Do not make trading decisions based off of this chart. I’m still learning.

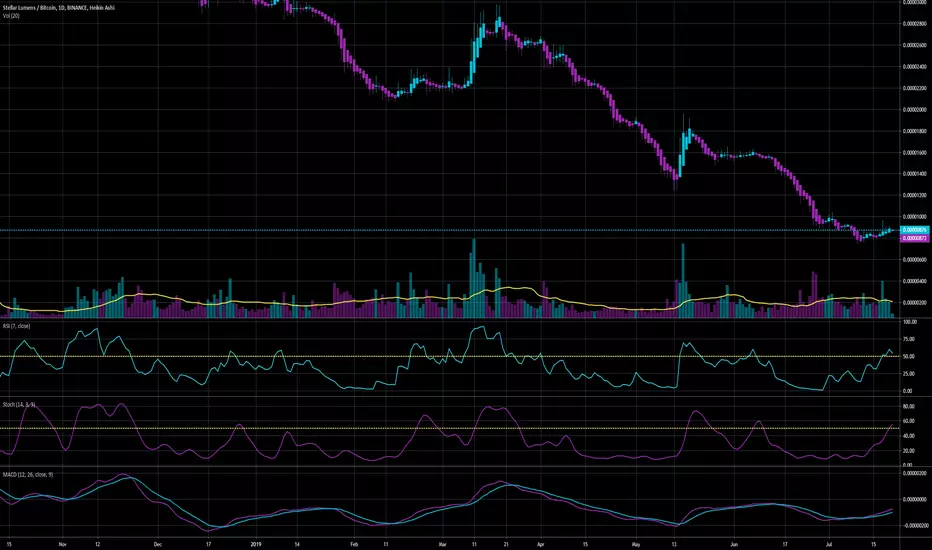
Stellar Lumes (XLM) in huge falling wedge pattern Hello everyone.
Today I´ve decided to take a closer look at BINANCE:XLMBTC
Main reason is falling wedge pattern formation + RSI at all time low on Weekly chart
I´ve activated my trade allready and entered the market at magical price 777 as you can see in chart " XLM weekly RSI at all time low "
in related ideas or if you click on the chart below
** This is not a financial advice but attempt to predict future price movement so please trade only at your own risk and just capital which you can afford to loose **


A possibility for XLMBTC it could potentially break out and up here, but it could as well form a lower low.
lets see what happens.

XLM is a fragile Beast. 24Volume has dropped back to $100 millBeen a couple months since XLM volume sunk to the $100 mill levels seen the last four days. May 1st was the last time it was in the $100 mill range.

Prepare for liftoff! XLM loading up for a 300% moon shot?!Join us today: t.me
The Next Level Crypto team has found another gem for you!
XLM has been been down trending in a massive falling wedge for the last 230 days.
However, it has finally retraced to its lowest trading price range on Binance and is starting to show signs of life!
Bullish divergence is playing out across the daily RSI and it has broken the RSI down trend line that has acted as resistance in this falling wedge. This RSI breakout is the first sign of a momentum shift for XLM.
The Next Level Crypto Team is beginning to accumulate XLM in our buy zone between 730-930 Stats.
T1:1300
T2:2100
T3:2900
If you found this post helpful, like, comment, and subscribe!
Telegram Signals
t.me
Twitter
twitter.com


Trend reversal Early stages of what looks like a strong trend reversal let's see if it can continue gl.