XLMBTC trade ideas

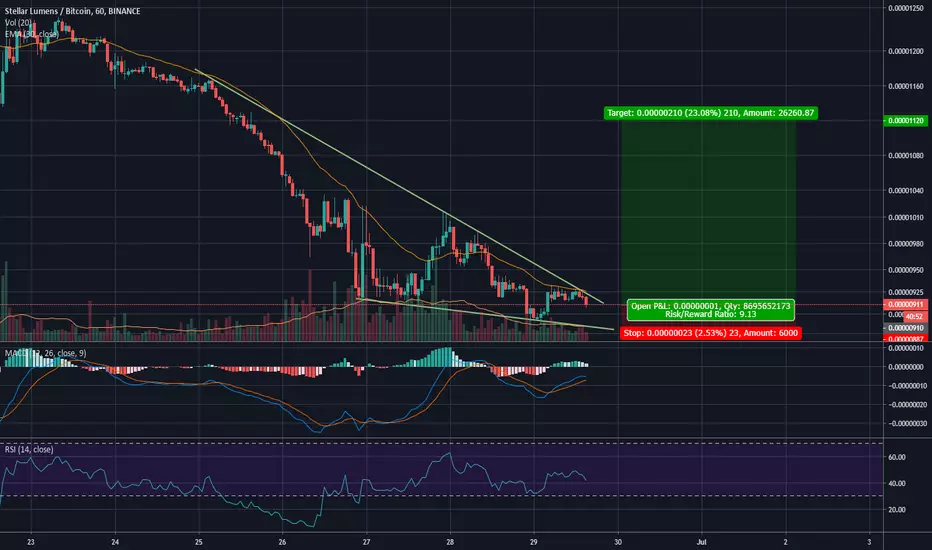
XLM could move soon.This coin is forming a bullish divergence on the RSI. It is also oversold.
I expect it to bounce from the RED line before it moves. It could hit the 1st target within 30 days.

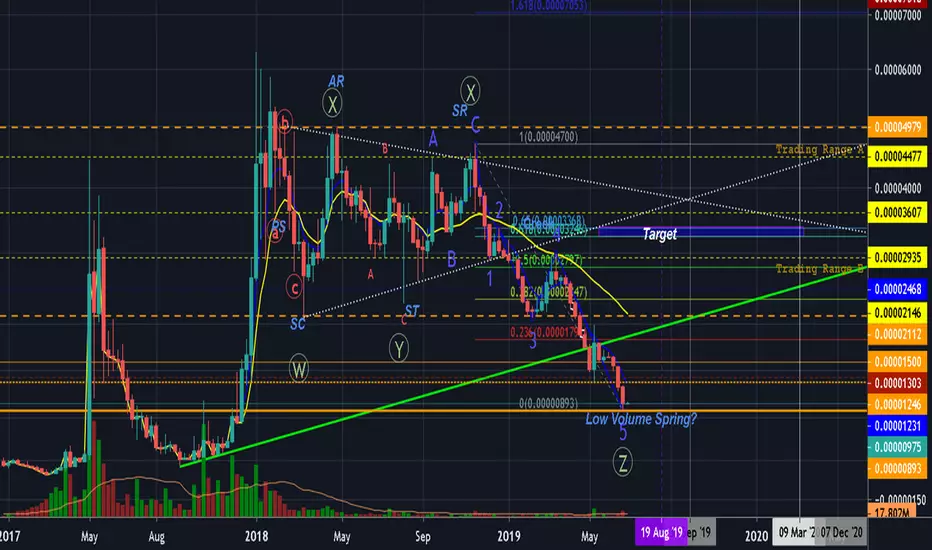
XLM/BTC close to completing triangle on weeklySince November 2018, XLM has been declining against BTC. The weekly chart suggests the end of the downtrend could occur this month.


XLM found the bottom and hit strong support lineXLM according to the symmetrical analysis found the bottom and will jump in uptrend channel.

10% Lumens - If holds resistance line #ShortexerciseTips, notes & suggestions
When you place a trade, always remember to set a stop-loss.
Most important rule, is to be patient. Money come and go, you will always get another chance.
Never invest heavy in one trade, be sure to spread your bags on different trades.
We would appreciate if you would hit the like button to support us.
Feel free to comment share your idea or comment down below
Morpheus wish everyone out there, a good and a healthy life in the cryptocurrency-age.


Falling wedge. Resistance levels = bullish targets.If you have no clue about the future TP levels for XLM I can help you!
Good luck!
PS.
Sorry for bad drawing (actually looks like worms) using an laptop. But I hope you understand what I wanted to tell.


Crayons - #XLM / #BTC $XLM / #BTC @ISilico - Bullish SFPBULLISH SFP ON THE 4H
Also... USING CRAYONS... If you're not long, you're wrong

Regularized Volume Zone Oscillator - #XLM / #BTC @InSilicoShowing strong buy signal as well on the daily

#XLM / #BTC $XLM / $BTC - Using @InSilicos Guppy Indicator!If you're not long, you're wrong... According to the Guppy's!
Lower S2 pivot held strong
4H price forming an ascending triangle
*****InSilicos Guppy's showing green signal*****
RSI has blasted up to strong demand levels with price not moving much relatively
Bitcoin hesitating, consolidating and still above our lower support of 10.7
Other alts blasting off such as LINK, QNT, and DRGN... and many more
Are altszns about to be back again?
We shall see soon

Stellar Drop!I have to admit this drop went far deeper than I expected but are we seeing signs of life again?

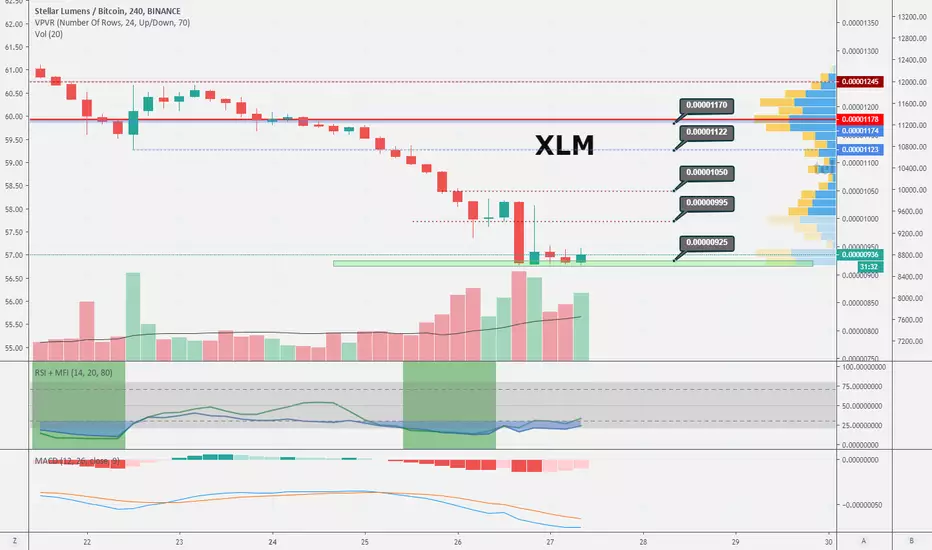
XLM found supportI was expecting Stellar to fall down to 730, but some really nice volume met it at ~915 support. Might push up from here. Here is my setup.
Pullback buy zone 915-935
Targets 995 - 1045
HODLer's candy 1020
Stop loss below 898
Stopless strategy - double order at 730 and sell at 900
Risk/Reward Ratio 1.8 / 3.3 (for main targets)
XLM: Rocket no longer has fuelXLM suffers from its lack of use cases, its illimited supply, its airdrop that has plummeted its value, its recurring falling wedge on the XLM-BTC pair who are struggling to reach their target bullish reversal (see graph), the scandal revealed on its bug inflation in 2017. And its bug in the blockchain in 2019: network down for a bug in the validation system.
Libra attacks the decisive blow.
Watch for the outcome of the terrible falling wedge in progress:
if the course enters the dead zone, I think that XLM will never recover.

XLM highly likely to bounceExtremely oversold conditions. Nearing a bottom. USD daily chart in a classic bullish pennant. Reaching point of breakout. Closest to yellow line you buy the lower the risk. Typically moves with XRP which is also looking bullish.


Reversal imminent Stellar has been dropping in bitcoin value for some time now. However, there are some clues that a reversal should be incoming. Today's daily candle has formed a hammer. The candle hasn't closed yet, but I think with a few hours left on the candle it should remain a hammer. Furthermore, A bullish divergence has formed on the daily RSI indicating a trend change is probable. If you like knife catching this could be a good risk to jump in.
On the USD pair breakout looks probable as well. Price has been holding above the 55 daily moving average and ichimoku cloud. If it breaks out of the triangle target should be about 20 cents.

XLM/BTC bottom is near - long it to gain those sats!!!XLM/BTC looks great on the weekly. Bullish divergence which on a longer TF like weekly, is a good indicator of a reversal. If the BTC run is to continue, XLM should outperform BTC. With cryptocurrency, I trade for sats. I couldn't care if it's a shitcoin, if I think it will run, I'll trade it to accumulate BTC. So before anyone says "oh XLM is a shitcoin" stop and look at the bigger picture. This trade is to accumulate more BTC. There's a good chance to double, even triple your BTC here with this trade IMO. So if you believe in cryptocurrency long term, start accumulating BTC. GL if you tail :)
