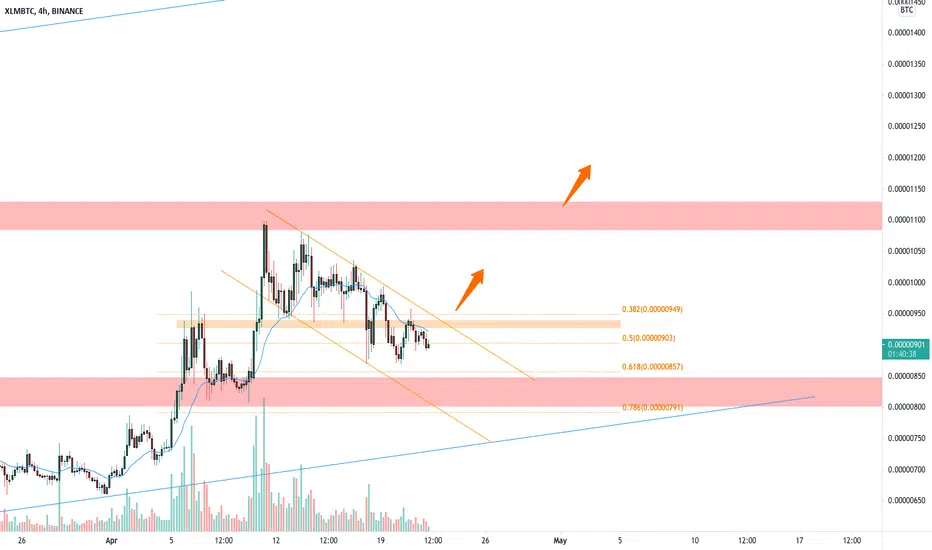
XLM Squeezes it's way out! LONGXLM has been poking at the top of this descending channel. We have been eagerly waiting a break out of it, and here we see what may be daylight.
That green box is a coin slot, drop your bitcoins in from 0.00000850 - 0.00000910 if you dare!
Harvest them back on the blue targets, or wherever you think is clever!
I have an eye on:
1) 0.00001000
2) 0.00001089
3) 0.00001217
etc...
SL for me is 0.00000795
Have fun, don't get rekt!
XLMBTC trade ideas

XLM/BTC - Ready For Next Step ?Hi, You cant Watch the related idea publied before the big up wave.
In my mind If Daily candle close above the EMA13 ( BLue Line) We are ready for a newt growing phase to 1200 and maybe more.
If in the next days price trade in/under the big red box, we are going down

XLMBTC is creating a descending channel 🦐XLMBTC is creating a descending channel above the weekly support. IF the price will have a breakout and retest the current 4h resistance into new support, According to Plancton's strategy (check our Academy), we can set a nice order
–––––
Follow the Shrimp 🦐
Keep in mind.
🟣 Purple structure -> Monthly structure.
🔴 Red structure -> Weekly structure.
🔵 Blue structure -> Daily structure.
🟡 Yellow structure -> 4h structure.
⚫️ Black structure -> <4h structure.
Here is the Plancton0618 technical analysis, please comment below if you have any question.
The ENTRY in the market will be taken only if the condition of the Plancton0618 strategy will trigger.

Xlm/btcXlm/btc . Last dump in crypto 2021.18.04 privides good liquidity pool for alts. Manage your risk accordangly 1%/2% of your deposit!


One good trade⚡️Good day starts with a good trade, folks🔥
There is one more Flag formation on XLM / BTC crypto pair.
The price was in a slight bullish trend begore entering into consolidation.
Multiple times it bounced from support and resistance zones.
Bullish impulse is expected after breaking resistance zone .
So follow the chart and look for the breakout carefully.
_____________________________________________________
If you enjoy my FREE Analysis , support the idea with a big LIKE👍 and don't forget to SUBSCRIBE my channel, you won't miss anything!
Feel free to leave comments✉️
And always remember: "we don't predict, we react".


XLMBTC - 🦇 BULLISH BAT 🦇 - 1d🦇🦇 bULLISH bAT bABY 🤠🤠
BUT FIRST
🔽
BACK TO 800
❓❓❓❓ WHY ❓❓❓❓
🔽800 MUST BECOME support
every coin trades in channels
so there must be a trendline that connects the lows so far
PLUS the pattern is so beautiful 🙈🙈😊🙈🙈
🔽H&S
🔽Bearish divergence
400 would be first lower support
⛔⛔NO WAY ⛔⛔ it's gonna go down there
THUS
ThE ONLY WAY IS Up 🚀
BaBy
TARGET: 1200 by 10 MAY
SELL NOW
SL 1001 (S:1001 L: 1025)
DON'T HATE ME IF I'M WRONG
I'M ONLY TRYING TO HELP
NFA
TRADE WITH MONEY YOU DON4T NEED
LOVE Y'ALL
❤️❤️
GOOD LUCK
🍀🍀🍀🍀🍀🍀🍀🍀🍀🍀🍀🍀🍀


XLM/BTC - BART SIMPSON IN THE MAKING ?💹💹💹 All points UPWARDS
No chance this is gonna go down
Strong fundamentals as well
Been on their tail since 2018
WHISPERS 🤫🤫🤫 about
becoming THE platform for the DIGITAL EURO
💎💎💎
I wish you all success in finding YOUR GEMS
💰💰💰

XLMBTC INVERTED HEAD AND SHOULDERS 1 W, SLEEPING GIANT UPDATE1. Support Box in Blue
2. Take Profit Levels in White
3. Pattern in Yellow
The most important level to break is 1300 sats. Breaking 1300 sats will launch the price to the next target quite quickly, as it is a new change of behavior in the chart.
Good luck all.


XLM XLM is near to touch Downtrend Line of XLMBTC Chart which is 100% higher.
After Break, other highs will come true...


XLM/BTC - the BIGGER pictureBART on short
&
M on longer term
THE sky is THE limit
❤️❤️❤️GO BABY GO❤️❤️❤️

"Knock knock" who is there?I see increasing volume and higher lows on the weekly chart and RSI
What do you think where XLM gets rejected next?
~ sharing views, not financial advice ~


Stellar (XLM) Breaking Above ResistanceWe have a clear higher low for Stellar (XLMBTC) on the chart below and we are now seeing prices move above resistance:
This is the higher low.
Today, XLMBTC breaks above MA200, EMA300/200/100/50, all in one candle.
This signal is only confirmed when the daily candle closes above the EMA300 gray line at 0.00000792.
Closing above this level will easily lead to higher prices.
We also have bullish indicators.
Disclaimer: I bought big on XLMBTC.
This is not financial advice.
Namaste.


xlmbtc 1 hourHello
The xlm/btc hourly graph shows the formation of a bull streamer. macd and rsi compatible.
Good luck to everyone.
is not investment advice.

