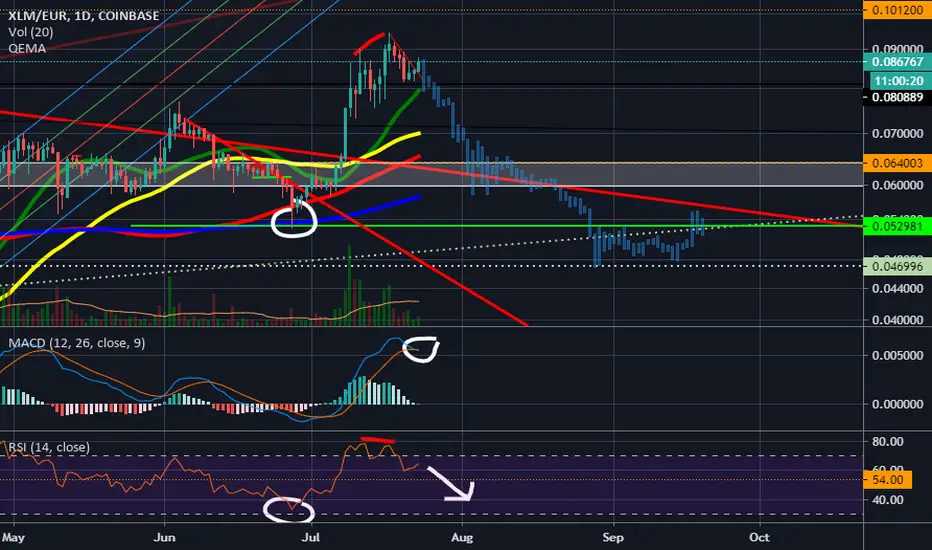
XLM starting a new downtrend ?Not financial advise do your own research !!
RSI has been resetting will it break out and rise higher or will we get a crash ?
I've put some possible targets to the downside 2 of the 3 would be most likely the third ( bottom one could be the lowest it'll go ).
MACD converging and we had a bearish engulfing candle on the weekly.
Also RSI on weekly hit overbought, possibilty to cool of on the weekly aswell before entering another uptrend.
Have fun trading and remember d o your own research.
XLMEUR trade ideas

XLM In Oversold Area !Are we heading a bit lower to make a macro higher low ?
IMO XLM wil follow BTC for a large part and correct even more how low we go idk. Targets to be watched are on the chart ( taking out previous low ).
On the positive side XLM is oversold, buy went it's oversold and sell when overbought.
Technical Indicators :
MACD below 0 - level and diverging.
RSI at 30 - level going into the "previous" pattern.
Our declinging volume has been halted and are increasing again.
Currently having a D - Cat bounce above the noisy area. This also is the 200 Daily MA
Closing our weekly below 0.072 would not be great due to it being below our 20 Weekly MA.
Not financial advise do your own research !


XLM 0.09$Podriamos ver esta continuación alcista a esos 0.09$. Aun que parezca un movimiento pequeño, si medimos nos damos cuenta que supone un 7% de movimiento.

XLM - The beginning of a bull run.Wave 2 could be finished. If my count is correct, now XLM is doing wave 3.

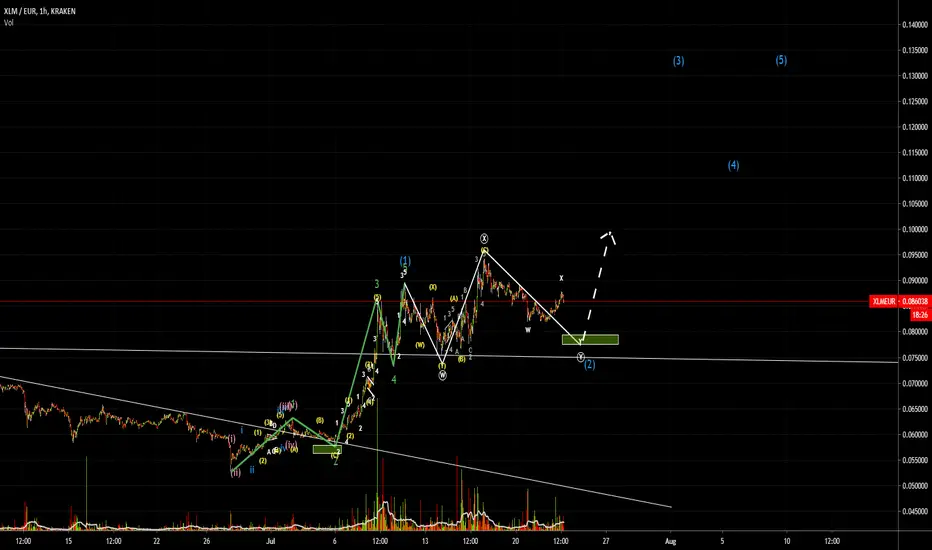
BearDiv? XLM|EUR possible pattern playing out, Before blastoff?Bearish divergence rlly close to overbought zone,possibility that we go up again but think it'll go down take out lows find support and then rally above this pricelevel.
Bearish cross incoming on RSI.
Just my thought not financial advise. Do your own research.
Second Corona wave aswell so BTC may pull back which would let alts go back aswell so that could be a reason why for this coming pulback imo


New bearish wave expected on XLM EURSell zone 0.07 - 0.08
aim 0.035 - 0.025
Long term view
Level 0.06 is already broken
Watch lower time frames for short signal

XLM downtrend is starting!XLM had some nice gains after the big crash... which can't hold on forever unfortunatly.
MACD was also overbought on the Daily and broke down of the trend we where in today, when historically this happenend we stayed going to the downside for a month.
We broke down from some sort of a triangle pattern while having some bearish divergence on the lower and daily time frame.
Which resulted in us getting pushed down to currently €0,057577 and so breaking the 20 DMA.
For the coming dayz I'd like to see a retest of the 20 DMA like we previously did and continue further to the downside.
support levels : 100 & 200 DMA then 50 DMA with another one arround €0.04 . If we couldn't hold those we would see a further drop to €0.025.
If we would hold support at or arround €0,04 and going back up again an Inverse Head & shoulders would be possible. This would mean bears are having less power over the bulls.
Not financial advise do your own research, and happy trading for everyone !

Correction incoming ! XLM/EUR !Bear diff on daily !
We are at the top of the sideways channel we're in from when XLM dumped.
Rsi looks ready to go lower.
Macd converging while in an uptrend.
Daily 100MA is almost crossing the 200MA !!!!!! => Tomorow it'll cross and the pullback will be in play. to possibly retest that area.
support: 0.054722 = 20DMA ; 0.051611 = 100DMA ; 0.05198 = 200DMA.
Not financial advise do your own research before going into a trade....
The highest we currently would be possible to go would be 0.072 Major resistance area for almost 1 whole year.

XLM : EUR => What will happen the coming days ?Discussing BTC closing in the weekends and so maybe creating cme gaps there'll be a possibility BTC will correct during that timeframe.
Making me think that XLM : BTC will stay closely to the price where it ended on friday.
rsi overbought in daily posibilty to retrace => Key support target at 0.052 cents aka 100 and 200 DMA . Hoping on support there where also the 382 fib level is if we draw from the absolute bottom to our current top.
This is just a wild guess but I think xlm will go to the downside the following days.
Not financial advise do your own research before going into a trade.

XLM : EUR going higher ?If this breaks up or down and goes below or up the part where the consolidation pattern starts then we'll get a bigger move following it.
Be carefull ! trading
not financial advice.
Consolidation pattern after a pump towards the upside => symtrical triangle => mostlikely to break to the upside.
Houlry is a bit more important imo but in here we can see what's gonna happen if the macd gets rejected again further downside will follow and so it breaks down of the triangle.
APEX tomorow 1AM UTC.


XMLEUR trend analysisIt's been an interesting afternoon. The value has been stuck in the range 0.06 € - 0.057 € for the last few hours.
There seems to be an upward trend line, but right now, looking at the positions, I wouldn't bet that the value doesn't break it and we see a severe correction; resistance at 0,0593 € seems to be pretty solid right now. What's more, I actually think that in the next few hours the value is going to drop significantly.
But that's just my opinion, not any financial advise.

XLM/EUR Coinbase Parallel ChannelAnother update from a newbie.
XLM left yesterday around 16h (UTC+2) the channel it had been moving since April 6th, and gained some additional momentum leaving also the small channel. After a couple of tries to today's resistance at 0,0538 €, it went easily to the ceiling of the primary channel, where it seems to be facing some resistance. Right now, I wouldn't say we won't see some correction soon and a return to the primary channel (something that will happen sooner or later), after a 17% gain in two days, but the buying strength seems to be huge, at 15M XLM volume in the last 24h. Apart from that, believe me, I don't have a clue.
This is no financial advise. Seriously.

Is XLM /EUR going to the MoonThere is a good chance that XLM will go to the Moon soon, else we could see only one last leg down and then Moon.

XML/EUR Channel analysisFollowing with yesterday's ideam, seems like XLM is recovering some momentum in the last 24 hours and trying to go back to the previous channel.
Just a (newbie) idea.

XLM/EUR Coinbase ChannelJust some random thoughts from a newbie.
The initial channel seems pretty clear to me, but a second one seems to be forming in the latest days, after losing some bullish strength. The next days will show if we keep moving in the primary channel or if we're moving to a slower one.

XLM trend reversed ? 2-3-2020Is XLM getting ready for a move back to the upside ? IMO yes.
My target the high of this year.
Reason why the trend reversed ?
° RSI broke out of it's pattern it was in.
° Currently we have a bullish engolving candle on the daily.
° MACD has been converging since yesterday.
Reasons why we would see further downside uhm
° Support area from the "left shoulder" hasn't been hit yet
This is the 618 and hasn't been hit yet. ( I think don't remember that good xD )
° Downtrend on chart hasn't been broken yet. ( If you'd draw the resistance like I did )
° We broke down from the uptrend we where in, THIS NOW IS RESISTANCE! ( Big red line )
Not financial advise, do your own research.

XLM a fairytale come true ?We've been rising for 57 days and have gained arround 96%
Positive side XLM is rising, but we have to be carefull of corrections and consolidations.
If we see XLM trading above or resistance of our Adam and Eve further upside will be upon us. This due to a major long term bullish divergence.
Downside targets IMO would be the first fib lines.
RSI says we're overbought, but that doesn't mean it has to crash and go down immediatly XLM can trade for several days overbought. Corrections have to be made tho. So rallying without corrections wouldn't look that great IMO.
( RSI went above the 54 level on the weekly pointing to the upside ) ( XLMUSD chart )
Macd lines are going further away from each other again on the daily.
50Daily MA and 100Daily MA are about to make a bullish crossover.
Waiting for confirmation if a pullback would happen Y/N
Horizontal Lines where an orange price shows on the right hand side of the screen are my current targets for the upside.

XLM trying to break below upwards sloping supportDownside targets 0,047474 ( Other targets would be at 50, 200 and 100 Daily MA { 0,058385 ; 0,056146 ; 0,052651 })
Reason why we go towards that area => Last few days we had lower highs broke below Daily 20MA and rejected of it whilest trying to get above it again.
Macd facing to the downside and diverging red from each other.
RSI tried to get back above the 54 level and rejected which it now is trading just below the support level if the bulls can't defend this a drop of 22% will follow. RSI becoming oversold then would be great. Bigger timeframe would be massive IH&S see next picture.
Least bearish but still a good retrace would be at the 200Daily MA and bounce so at 0,056146 which means in another 7% drop at time of writing.
But Big Bull Market is arround the corner IMO. So get some cheap Lumens when it's going lower.
NOT FINANCIAL ADVISE, DO YOUR OWN RESEARCH.
