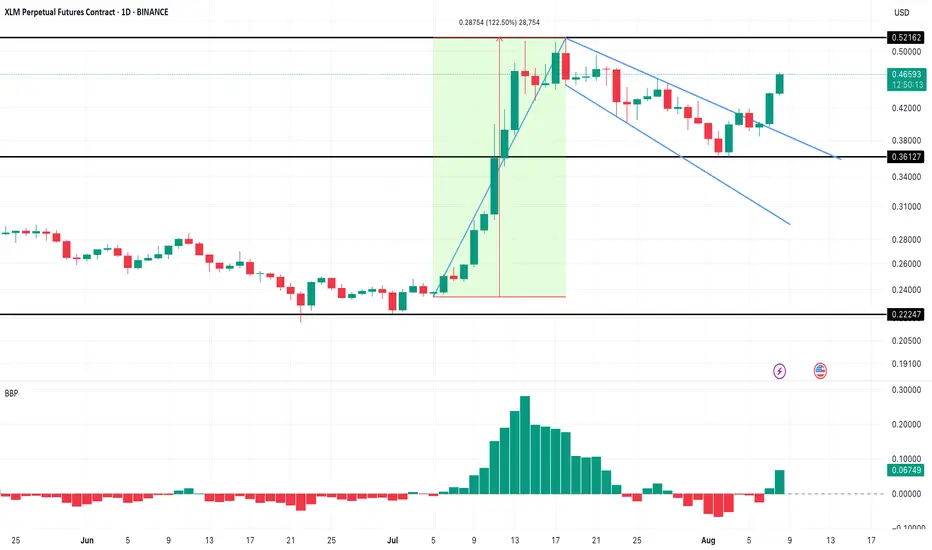
Stellar (XLM) Breaks Out of Bullish Flag: $0.97 in Sight?BINANCE:XLMUSD.P Stellar (XLM) has broken out of a classic pole-and-flag pattern on the daily chart, rallying over 16% in 24 hours. This continuation setup typically leads to further upside, and the measured move from the $0.23–$0.52 pole hints at a potential extension toward $0.97, provided bulls
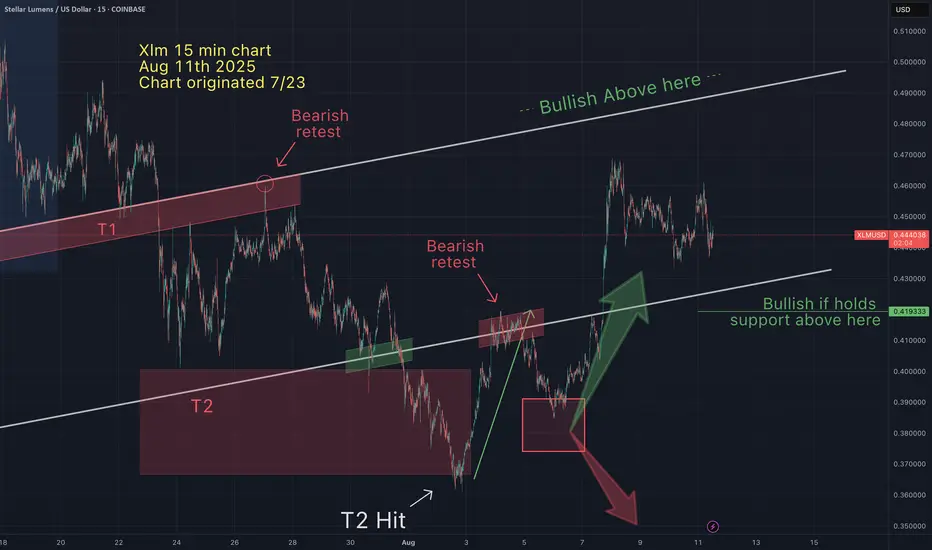
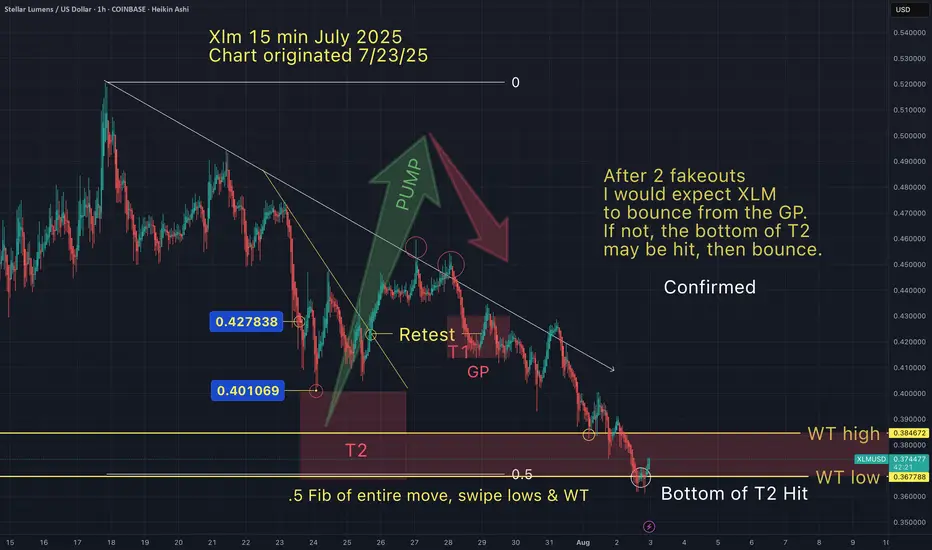
Xlm bounce off my T2 confirmed. Is Xlm now going lower to my T3I was hoping for a larger rally after this anticipated bounce off my T2. But if Xlm doesn't hold support above $0.42, I believe Sui is going lower towards my T3.
I will post my T3 target if/when Xlm holds resistance below my recently hit T2.
May the trends be with you.

Stellar lumens the most bullish chart in all of crypto $4 soonnuff said, if yall don't see whats happening , you hate money.

How did I know that Xlm would retrace...then bounce off $0.38?On Aug 5th I suggested that Xlm was apporaching an "inflection point", indicated by my green and red arrows converging at $0.38. See chart below from Aug 5th.
In mathematics an "inflection point" is a point in the curve at which a change in the direction of curvature occurs. These price charts ar
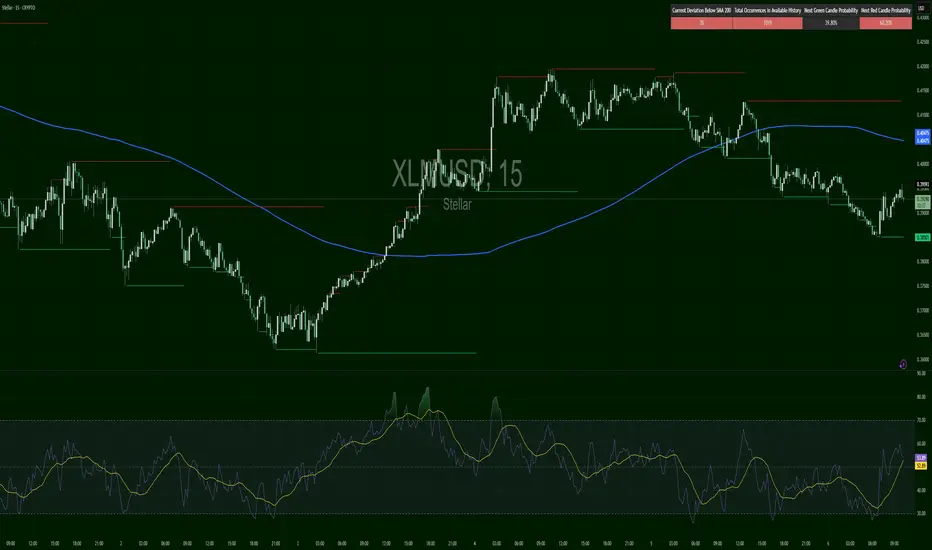
XLM/USD – Glow Faded FastStellar had a beautiful rally—until it didn’t. Price lost the $0.4080 key level and sits well below the 200 SMA, confirming a bear-biased market. Current bounce toward $0.3950–$0.4000 is technical and weak, lacking follow-through or strong RSI signals (still under 52). This remains a fade-the-rip se
This is the same fractal for XLM from April 2017.The Fractal from April 2017 is repeating with the November Pump and the recent pump as well.
Next comes a dip and then another pump up to $1

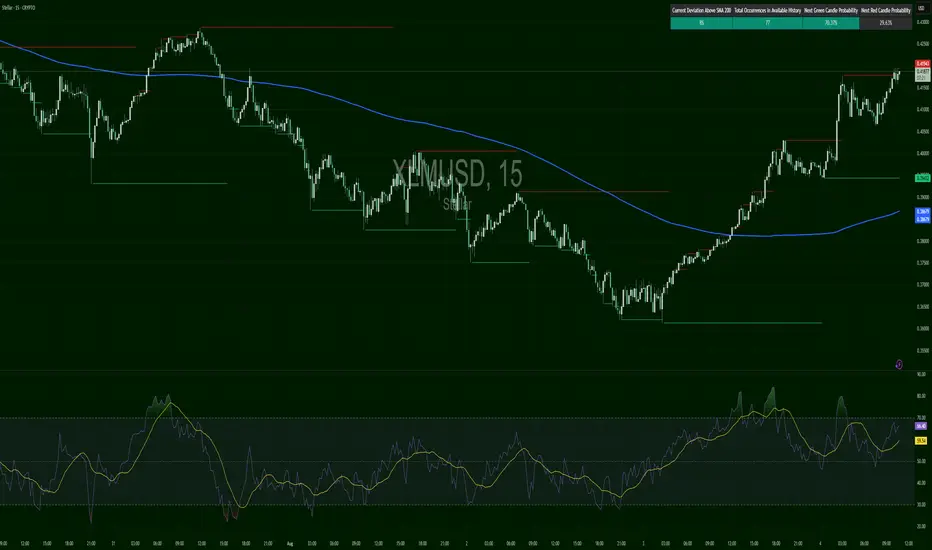
XLMUSD – Ripping Through OrbitBreakout confirmed, with price up to $0.41824, now resting against resistance at $0.41843. RSI is hot at 65+, and the probability model gives a 70% chance of green continuation — the highest among your current tickers.
XLM To $0.74I'm looking for XLM to continue to the downside followed by a move up. I will place a buy at the 50% fib level or in between the 50% and 61.8.

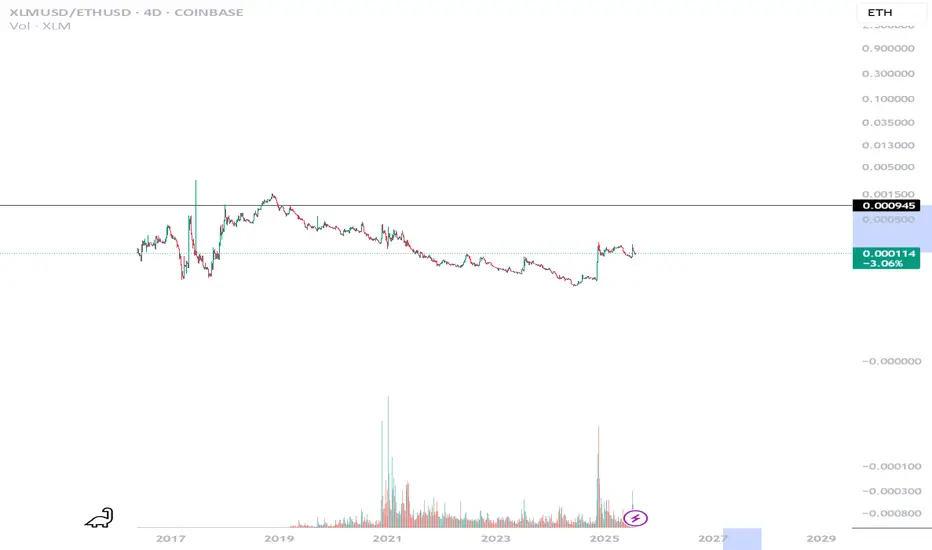
Expect a 730% rally XLM VS ETHThis is a XLM VS ETH Chart, I'm selling for XLM for ETH after XLM runs first expecting 726%
Xlm- The wait for Target 2 is over.After a 30% dump. We have arrived.
I hope my T3 doesn't get hit, but if it does, I'll be ready to sweep up the blood in the streets.
May the trends be with you.
See all ideas
Summarizing what the indicators are suggesting.
Oscillators
Neutral
SellBuy
Strong sellStrong buy
Strong sellSellNeutralBuyStrong buy
Oscillators
Neutral
SellBuy
Strong sellStrong buy
Strong sellSellNeutralBuyStrong buy
Summary
Neutral
SellBuy
Strong sellStrong buy
Strong sellSellNeutralBuyStrong buy
Summary
Neutral
SellBuy
Strong sellStrong buy
Strong sellSellNeutralBuyStrong buy
Summary
Neutral
SellBuy
Strong sellStrong buy
Strong sellSellNeutralBuyStrong buy
Moving Averages
Neutral
SellBuy
Strong sellStrong buy
Strong sellSellNeutralBuyStrong buy
Moving Averages
Neutral
SellBuy
Strong sellStrong buy
Strong sellSellNeutralBuyStrong buy
Displays a symbol's price movements over previous years to identify recurring trends.
Curated watchlists where XLMUSD.P is featured.

Alt forks: The path less traveled. But still pretty profitable
12 No. of Symbols

Decentralized Exchange Tokens: Risky business?
22 No. of Symbols

Eco-friendly crypto tokens: Green cryptocurrencies
14 No. of Symbols

Gen 1 crypto: from little acorns grow
15 No. of Symbols

Smart contracts: Make the smart decision
36 No. of Symbols

Top altcoins: Choose your alternatives carefully
28 No. of Symbols
See all sparks