WcStellar XLM - Look a Double Cheeseburger Left Unattended!WcStellar XLM
Welcome To WcDonald's
Look a Double Cheeseburger Left Unattended!
WE AWAIT THE LIGHT
1X10^(-27) LM
XLMUSD.P trade ideas

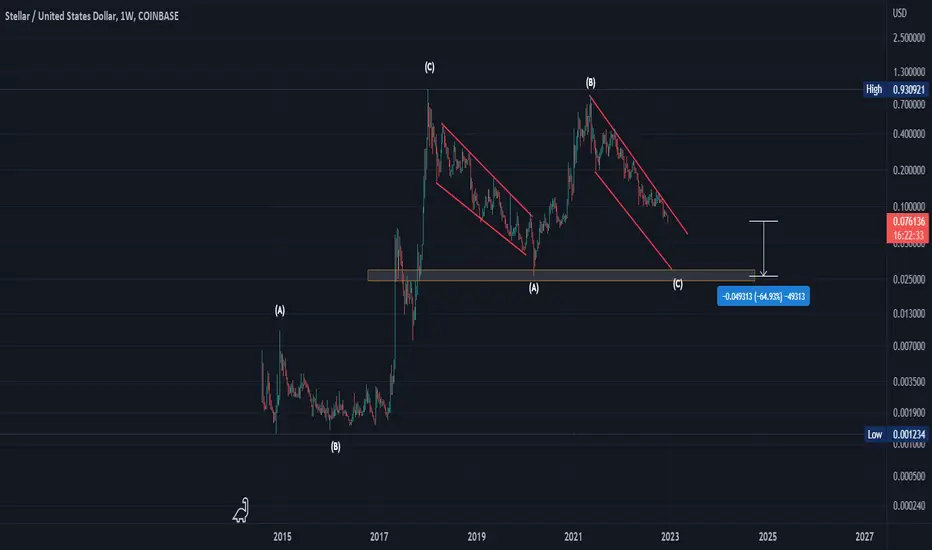
XLM Stellar 2025 price target of $34We have an ascending channel that depends on a low for XLM of between $0.042 and $0.05 price target sometime in the 1st quarter of 2023. In 2017 we had a meteoric rise of 67k% (67,000%) from the low price of $0.0015 beginning of 2017 up to the high of $0.93 by end of 2017. If we use a fractal and use the same percentage increase for 2025 the price of XLM could possibly hit a $34 target. I also have $8 on a Fibonacci line that could play a possible target as well. Will these actually happen is anyone's guess. No one has a crystal ball but we could use past percentages and fibs to make as close a determination as possible.
A special note to keep in mind is the March deadline for the Ripple case to come to an end, therefore, giving both XRP and XLM good reasons for a rise in price action. Of course, this is all speculative and should be taken seriously considering all macros and other trading factors when making a decision to acquire both assets.


XLMUSDTIt is expected to drop to a faded square in order to complete wave C and end three bearish main waves
AW XLMUSD ANALYSIS - Wave 3 of Wave (C) is Gaining Momentum...In my last video on XLM (linked down below) I outlined the most likely scenario for the bigger picture.
What we are seeing now is Wave 3 starting to gain traction to the downside.
In this video I explain the wave count and how you could have used my last video to short this.
Now, I am not encouraging shorting, but I am giving you an example of how AW is a great tool for doing so.
As you know my target is .004444 or thereabouts so we will know when we get closer because we will be able to count 5-Waves down from the end of the correction for Wave (B) in this larger Zig-Zag pattern.
Is it a coincidence that I started posting all these new videos at this point in time?
Well actually no it's not and if you have seen those videos (linked down below), you will understand what the bigger picture means and how we will use this to our advantage.
Remember to use Disciplined Money Management Principles to ensure longevity as a trader.
If you don't know the long-term pattern shouldn't you be doing your research instead of just following the crowd?
Just remember: I am not a financial adviser; I suggest using this only as a guide. Always do your own research.

AW XLMUSD ANALYSIS - Would you buy XLM for .004444?In this video I go through 2 potential scenarios for XLM but focus on the less bearish scenario.
Afterall the same corrective pattern is contained in both wave (B) or wave 2 so either is possible.
So, let's say this is a zig-zag, that means we could potentially scoop up one lumen for .004444 in about a year or two.
We will know when we get closer because we will be watching this coming 5-wave move unfold and also watching and analyzing other cryptos.
This could be a good opportunity to capitalize on some cheap XLM.
Obviously, it will require a lot of patience so get busy with learning the waves in the meantime wink wink nudge nudge :)
Remember to use Disciplined Money Management Principles to ensure longevity as a trader.
If you don't know the long term pattern shouldn't you be doing your research instead of just following the crowd?
Just remember: I am not a financial adviser, I suggest using this only as a guide. Always do your own research.

XLMUSDXLMUSD is at trendline, resistance seems to be holding. A move to the downside seems eminent, a sell trade is taken.


XLMUSD Forecast Entering a Dead ZoneHello there
XLMUSD is bearish, but there is a large zone of support from (n) to the dead zone. For this reason, the bias is anticipated as bullish on a pullback, requiring patience for the end of the bearish ABC.
It is in areas like these, in the dead zone, where Wyckoff's schematic may come in useful.
-Remember that while someone can teach you theoretical trading concepts and diagrams, they can never give you determination.
Khiwe.

XLM. Soroban smart contracts coming...Quite an impressive ecosystem of talent and really dedicated stellar people. They will probably take it to a new level when smart contracts are implemented, around the Q2 of 2023. As for XLM , I noted 4 levels around which the price will move throughout the bear market. Also, I want to note that we have a breakout down of the ascending triangle , but in my opinion, this is a fakeout. The price will return back to the triangle.

XLM Long term target Resistance at USD 0.70.
Support at USD 0.036
This is not a financial advise but if you like my idea, please support me by hitting the like botton.
Thanks in advance.

🧑🚀 STELLAR LUMENS (XLMUSD) - Bullish towards resistance!Stellar Lumens has found support in recent days and looks likely to retest resistance as shown. If we can get above the Fibonacci level of 0.382 then this might be able to kick in as support for the retrace and ignite further upside. Play it safe risk wise, the markets have a lot of negativity at the moment.

XLMUSD H8: SHORT IT 30% correction TP 8500(SL/TP)(NEW)Why get subbed to me on Tradingview?
-TOP author on TradingView
-2000+ ideas published
-15+ years experience in markets
-Professional chart break downs
-Supply/Demand Zones
-TD9 counts / combo review
-Key S/R levels
-No junk on my charts
-Frequent updates
-Covering FX/crypto/US stocks
-before/after analysis
-24/7 uptime so constant updates
🎁Please hit the like button and
🎁Leave a comment to support our team!
XLMUSD H8: SHORT IT 30% correction TP 8500(SL/TP)(NEW)
IMPORTANT NOTE: speculative setup. do your own
due dill. use STOP LOSS. don't overleverage.
🔸 Summary and potential trade setup
::: XLMUSD 8hours chart review
::: updated/revised outlook
::: limited upside going forward
::: distribution in range / weak chart
::: heavy resistance at 1250
::: weakness will last for 4-8 weeks
::: LOG SCALE chart
::: 1250 is mirror S/R BEARS
::: expecting more losses next few weeks
::: aggressive FED rate hikes guaranteed now
::: weak bounce in progress
::: S/R was re-tested produced WEAK bounces
::: recommend to SHORT SELL any rips/rallies
::: also noteworthy sequence of lower highs
::: recommended strat: SHORT at 1250
::: final TP BEARS is 8500
::: 25-30% correction possible next
::: 3-4 weeks in October 2022
::: right now no upside in this market
::: position traders should wait for
::: better entry prices later after
::: recommended strategy: SHORT SELL RIPS/ RALLIES
::: TP BEARS is +30% gains - near 8500
::: BULLS stay out until correction is over
::: SWING TRADE: SHORT/HOLD IT
::: correction run not over yet
::: good luck traders!
::: BUY and get paid. period.
🔸 Supply/Demand Zones
::: N/A
::: N/A
🔸 Other noteworthy technicals/fundies
::: TD9 /Combo update: N/A
::: Sentiment mid-term: BEARS/CORRECTION/25%
::: Sentiment short-term: BULLS/FINAL BOUNCE
RISK DISCLAIMER:
Trading Crypto, Futures , Forex, CFDs and Stocks involves a risk of loss.
Please consider carefully if such trading is appropriate for you.
Past performance is not indicative of future results.
Always limit your leverage and use tight stop loss.

XLM 42% Pump Coming!I believe XLM has bottomed at 0.08
Double bottom support established.
Initial Pattern Target 0.12
Mooning Phase Begins

Short is recommended in XLMUSDIn a downtrend, trendline resistance is around the corner. so short position can be taken

$XLM ShortI’m shorting simply based on the unmet demand gap. This chart is just for the ego to follow-up and see how the coin has performed. I’m massively short on a paper trade with a take profit order at $0.20.

$XLM Is A Simple Investment Opportunity ⏰This is a granddad of crypto like BTC, now not so much in the news anymore. Buyers have since left and the shorts are now trapped with no further selling pressure. So, there is a potential upside coming, like 88% as money starts flowing to this asset and the shorts have to exit. Remember XLM has been on a downhill since May 2021, crashing way before the great crypto crash late last year. My play is to buy at this price with no stoploss (so maximum 10% of your asset value ok) and set the take profit at 0.22 and sleep on it for 2 months max.

XLM ON IMPORTANT LEVELXLM has been on a continuous downtrend for approximately 530 days.
As we can see, it is currently moving within a descending price channel .
I think we all know what important level it is currently sitting on :)
Yes, you guessed right; The Golden Fibonacci Ratio
At the time of writing, my bias is still bearish .
However, you can count on me to keep this special project under my radar when it starts forming bullish market structure. 🥰
Keep an eye on this one pattern watchers
Don't blink 😉

XLM weekly chart looking WHOA!XLM weekly chart...Looks probable
that XLM could make a bullish move out
of the wedge then out of the circle into
the first yellow box...RSI already broke
out, lets see if price can follow.

XLMUSD Entry Price 0.11035Wait for a close above 0.11 for a long position. If price closes above 0.11, then look for a bullish price action signal. Target Price Is 0.11421.

XLM - WEAKHello guys,
A good indicator say to short XLM. Look, the last two times when XLM in H8 was "SELL", XLM decreased hard.
So i will short here. CAUTION : Possible pump on the last top to 13.80. SL at this level
Good luck.
No bear div in H4, H6, H8.

GOING LONG in XLMUSDT(stellar)bearish engulfing and inside bar spotted.Indication towards a bullish trend

XLMUSD: 4 Hour Bullish BatXLM is at the PCZ of a small Bat on the Hourly and if BTC holds up XLM should easily be able to hit 11.7 cents and maybe even over 12 cents from here.
The 11-12 cent targets are from the perspective of day trading targets but given the level it is at one could also use this as a late entry to the swing trade shown here:
