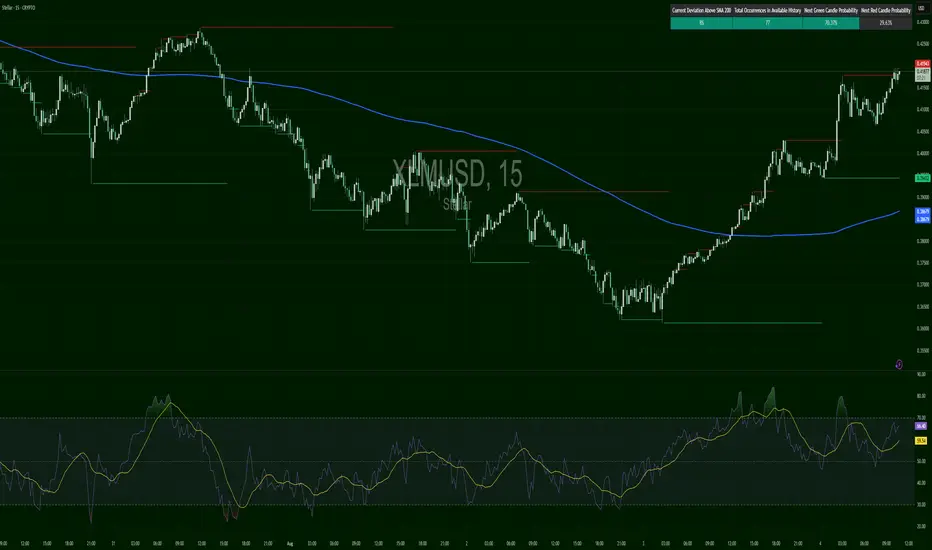
XLMUSD – Ripping Through OrbitBreakout confirmed, with price up to $0.41824, now resting against resistance at $0.41843. RSI is hot at 65+, and the probability model gives a 70% chance of green continuation — the highest among your current tickers.
XLMUSD trade ideas
XLM To $0.74I'm looking for XLM to continue to the downside followed by a move up. I will place a buy at the 50% fib level or in between the 50% and 61.8.

XLM over sold on RSI daily .36 next stop then explosionXLM over sold on RSI daily .36 next stop then explosion

Juicy 12hr Setup on $XLMUSDT
Decided to take this as a short-term play, level by level.
Already holding an initial position (see my previous CRYPTOCAP:XLM post), but this current setup was too clean to pass up.
Still believe CRYPTOCAP:XLM is one of those coins primed to finally break out of its multiyear consolidation—and I’m expecting that breakout to happen this year.
First TP at 62c, and letting the rest ride if momentum kicks in. BINANCE:XLMUSDT

Stellar lumens the most bullish chart in all of crypto $4 soonnuff said, if yall don't see whats happening , you hate money.

This is the same fractal for XLM from April 2017.The Fractal from April 2017 is repeating with the November Pump and the recent pump as well.
Next comes a dip and then another pump up to $1

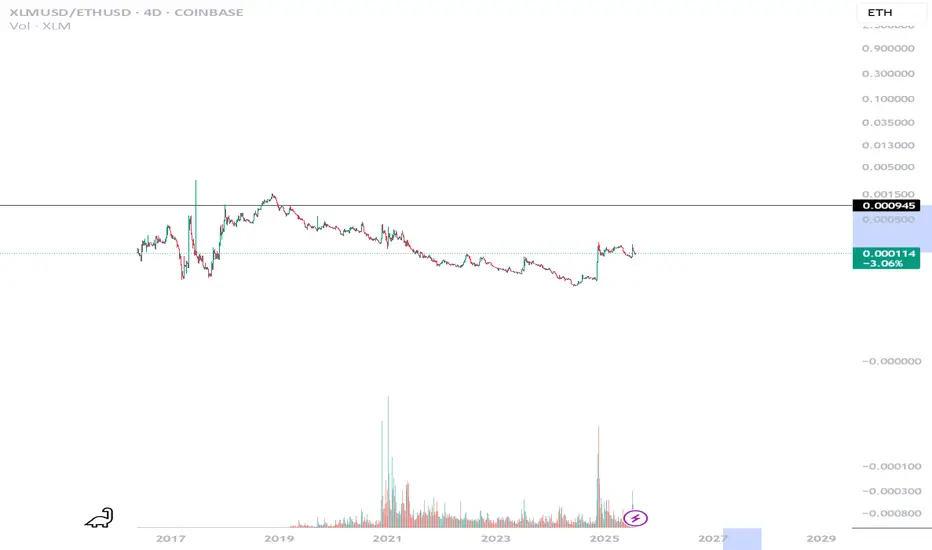
Expect a 730% rally XLM VS ETHThis is a XLM VS ETH Chart, I'm selling for XLM for ETH after XLM runs first expecting 726%
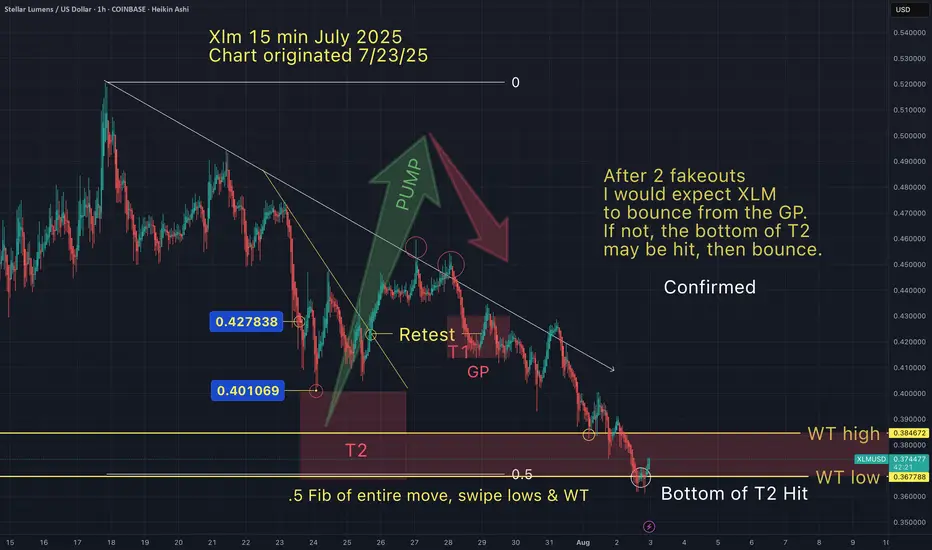
Xlm -Just hit my T2 target7/23- My first post
-Xlm was $.42
7/24- T2 (top of range) hit $.4
7/27-Pumped 15%
as anticipated
8/1 -T2 bottom Hit (WT)
Could go lower and hit WT Low...
But I love it when a plan comes together.
I hope my T3 doesn't get hit (after this bounce).
May the trends be with you.

Xlm- The wait for Target 2 is over.After a 30% dump. We have arrived.
I hope my T3 doesn't get hit, but if it does, I'll be ready to sweep up the blood in the streets.
May the trends be with you.
Xlm bounce off my T2 confirmed. Is Xlm now going lower to my T3I was hoping for a larger rally after this anticipated bounce off my T2. But if Xlm doesn't hold support above $0.42, I believe Sui is going lower towards my T3.
I will post my T3 target if/when Xlm holds resistance below my recently hit T2.
May the trends be with you.

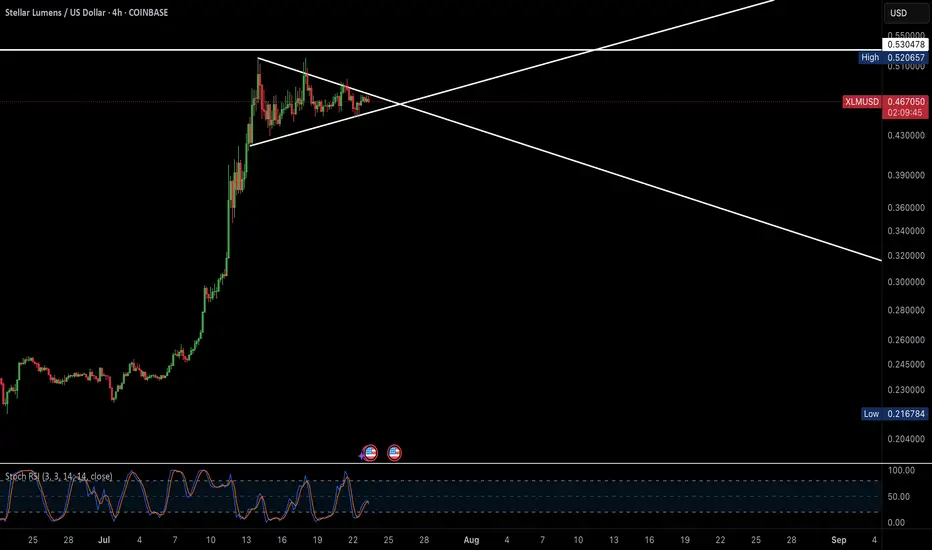
SHOULD TEST .52 AGAINWe are in a descending wedge getting ready for a squeeze. looks like we may test .52 area here again real soon. hopefully this run will have enough volume to push us to ATH. Please be aware if we break below the wedge, we could retest lower supports. It's unlikely but possible.

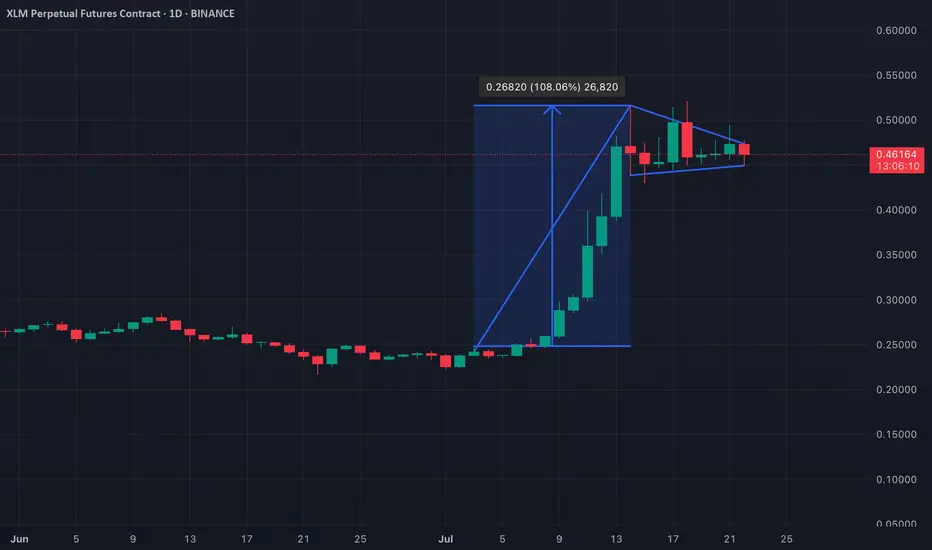
XLM 300+ RRXLM ridiculous RRR. 3D timeframe HVF 1.618 fib at 4.40$. Could XLM rip up to XRP prices?? Smaller timeframe W pattern with a bullish three impulse flag on the 15m. Looking for a tight stop. MEGA MOVES (usually don't work) but lets see...
XLM - Getting Ready to go BerserkAfter a huge weekly candle, XLM still holds its ground at around 0.45 - 0.47, it's quite evident that it's getting ready to prime to its next target, Stoch RSI on daily is cooling down, and market is grinding slowly, when this blows past 0.53, it essentially breaks past it's all time high, a 7 year consolidation pattern would be breaking out and heading towards the moon, Targeting $4-$6
XLMT2 marks the spot. Final countdown before blast off.
Could always go lower, but this is where I would get on if I
didn't want to miss my ride.
All aboard, the next shuttle to the moon is about to lift off.

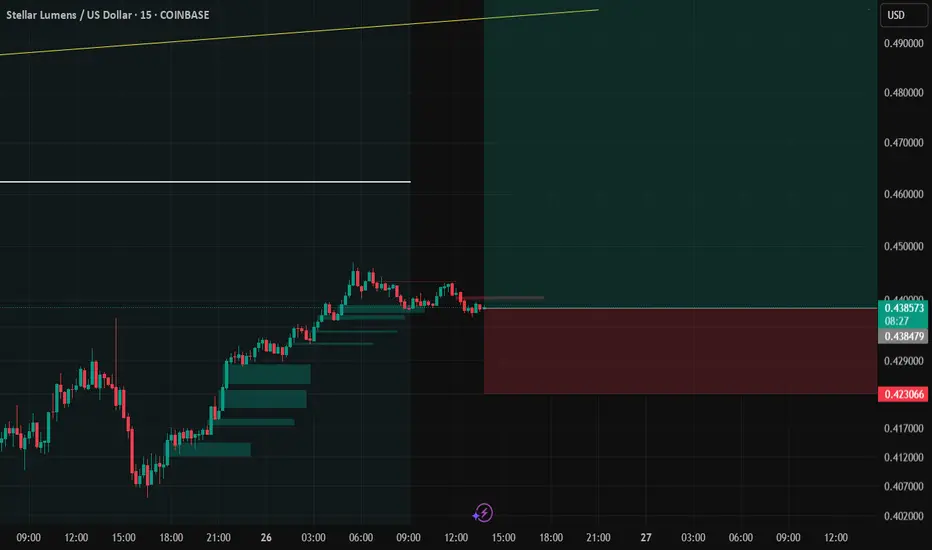
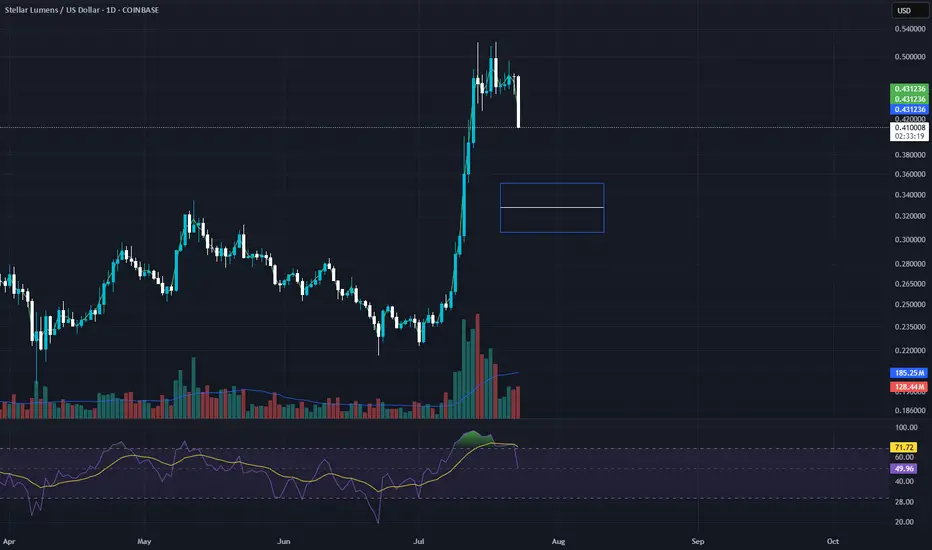
XLM/USD Entry on pullback ideaI am ooking for market to reprice XLM against USD at levels show in blue box. Could be a level to add or enter.
XLM/USD – Glow Faded FastStellar had a beautiful rally—until it didn’t. Price lost the $0.4080 key level and sits well below the 200 SMA, confirming a bear-biased market. Current bounce toward $0.3950–$0.4000 is technical and weak, lacking follow-through or strong RSI signals (still under 52). This remains a fade-the-rip setup unless buyers force a structural reclaim above previous supply.
🔴 SHORT bias continues below $0.4080.
🟢 Long only valid if bullish flip + volume returns above 200 SMA.
📊 Keywords: #XLMUSD #FadingMomentum #SMARejection #CryptoBearish #ChartPatterns #BreakdownAlert
Bears Take Control: XLM/USD Struggles Below $0.40
Price has closed below the middle Bollinger Band (blue line), indicating bearish pressure.
Recent candles show rejection wicks on top and strong red-bodied candles, signaling active selling.
Support zone around $0.40 has been breached and price is struggling to reclaim it.

XLM target hit - But is there more downside?7/23- My first post - Xlm was $.42
7/24-Xlm hit T2 @ $.4
7/27-Pumped 15% - as anticipated (indicated on this chart on 7/23)
After 2 fakeouts I would expect XLM to bounce from the GP.
If not, the bottom of T2 may be hit, then bounce.

XLM: Bullish Pennant Signals Possible Breakout Rally IncomingXLM has formed a bullish pennant on the daily chart—a classic continuation pattern that typically follows a strong upward price surge. This formation, marked by a consolidation phase in the shape of a symmetrical triangle, suggests that buyers are briefly pausing before potentially resuming the uptrend.
A breakout above the pennant’s upper trendline would likely confirm bullish momentum, giving traders a clear signal to enter long positions. If this breakout occurs with strong volume, XLM could see an explosive move higher, potentially mirroring the size of the initial flagpole that led into the consolidation. Keep an eye on resistance levels as a break could spark the next leg up.
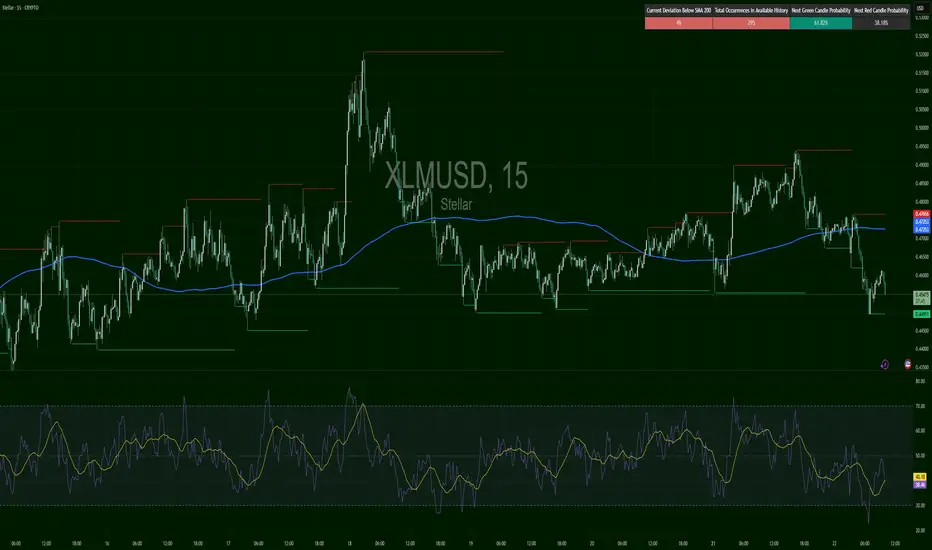
XLMUSD – Trying to Stand UpXLM fell aggressively from $0.4850 and broke below its SMA 200 for the third time in two sessions. RSI rebounded from oversold (~30), currently hovering near 42. The price is stabilizing near $0.4550 support — possible relief bounce brewing, but no higher highs yet. Caution advised.
Solana Hits Target with 9x ROI, More Upside Ahead?Solana just smashed our target, delivering up to 9x returns for those who held on. In this video, we break down the current setup, where the next 40% move could come from, and what to watch in funding rates and BTC dominance. Altcoins are waking up. Are you ready?
This content is not directed to residents of the EU or UK. Any opinions, news, research, analyses, prices or other information contained on this website is provided as general market commentary and does not constitute investment advice. ThinkMarkets will not accept liability for any loss or damage including, without limitation, to any loss of profit which may arise directly or indirectly from use of or reliance on such information.

XLMUSDBullish pattern, ascending triangle with target 10usd.
We will see this target.
The only thing that matters is time.

XLM/USD XLM is showing one of the strongest bullish setups right now.
A macro “Cup”, with a smaller “Cup with Handle” forming inside it — a powerful setup often leading to parabolic breakouts.
Before a true breakout, price may fake out to the downside, trapping longs.
This is classic market maker behavior — shakeouts followed by strong reversal and breakout. Stay focused on the reaction around yellow zone.
Currently in the final stages of the “handle” formation.
A breakout may confirm a move toward $4
